Sample Category Title
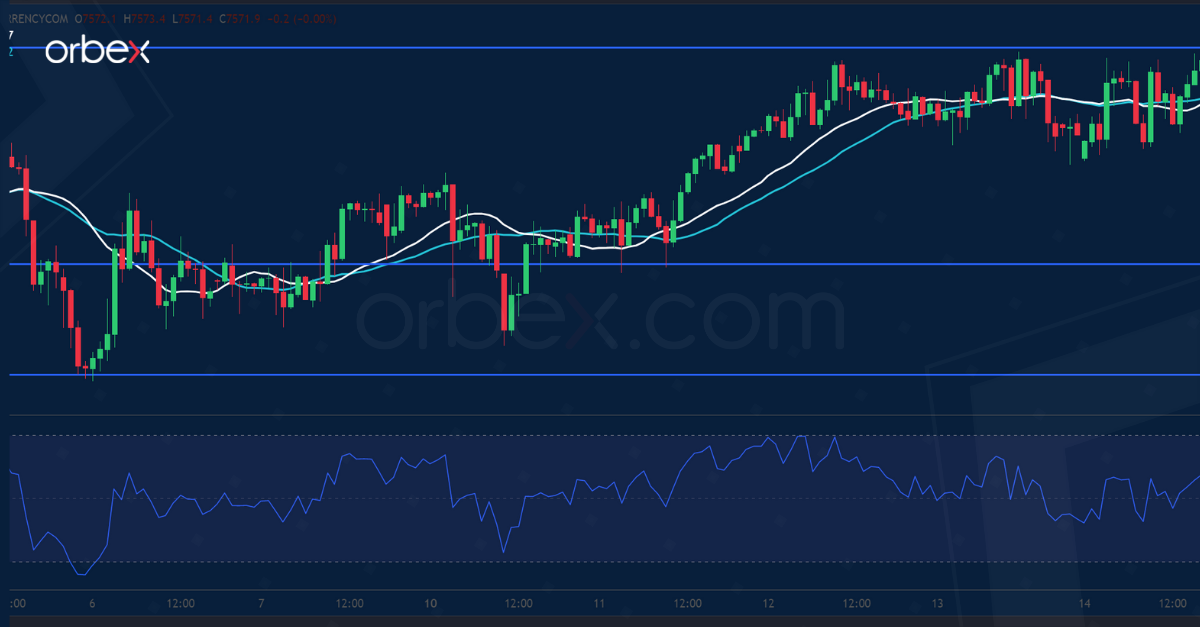
UK 100 Consolidates Gains
The FTSE 100 finds support from the UK’s stronger-than-expected GDP. A break above the top of the previous consolidation range (7545) means a continuation of the current uptrend.
Trend-followers may consider a pullback as an opportunity to stake in. Short-term sentiment remains bullish as long as the index is above 7470.
A break above the immediate resistance at 7580 would extend the rally upward. A deeper retracement would test 7370 which used to be a major resistance from the double top on the daily chart.
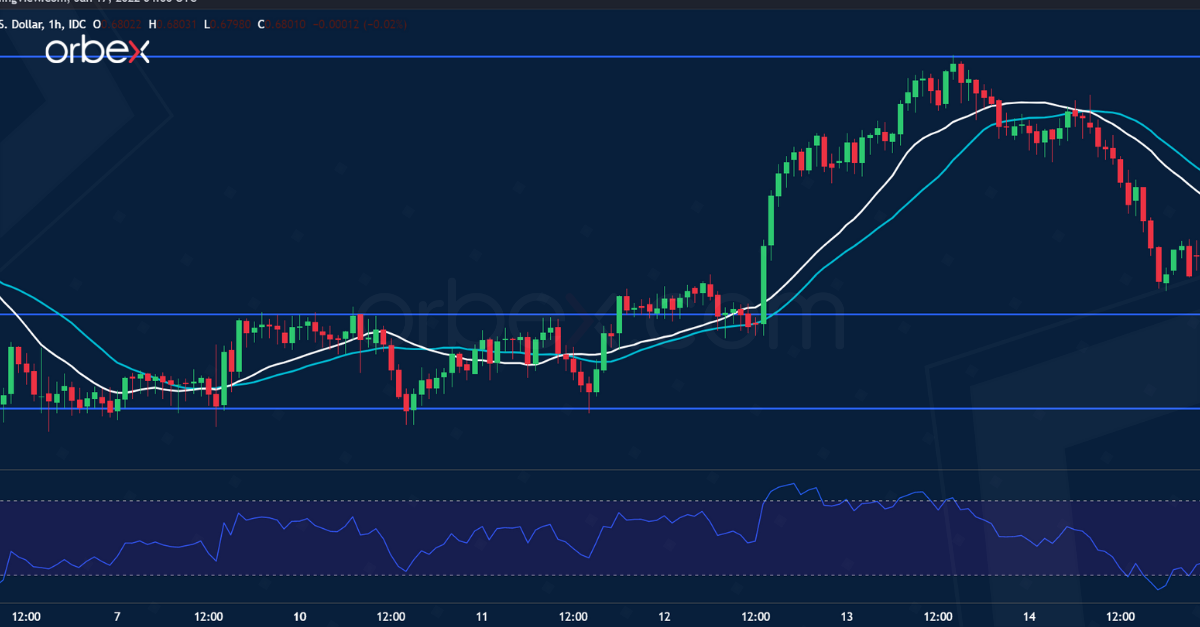
NZD/USD Seeks Post-Rally Support
The New Zealand dollar fell as risk sentiment subsided going into the weekend. The surge above the supply zone around 0.6850 has triggered a reversal fever after a month-long sideways action.
As the RSI drops back into the neutrality area, buyers could be waiting to jump in at a discount. A pullback below 0.6840 has led to some profit-taking but as long as the price stays above 0.6780 the rebound is valid, or the kiwi could revisit the critical floor at 0.6700.
A break above the recent high at 0.6890 would extend the rally to 0.6960.
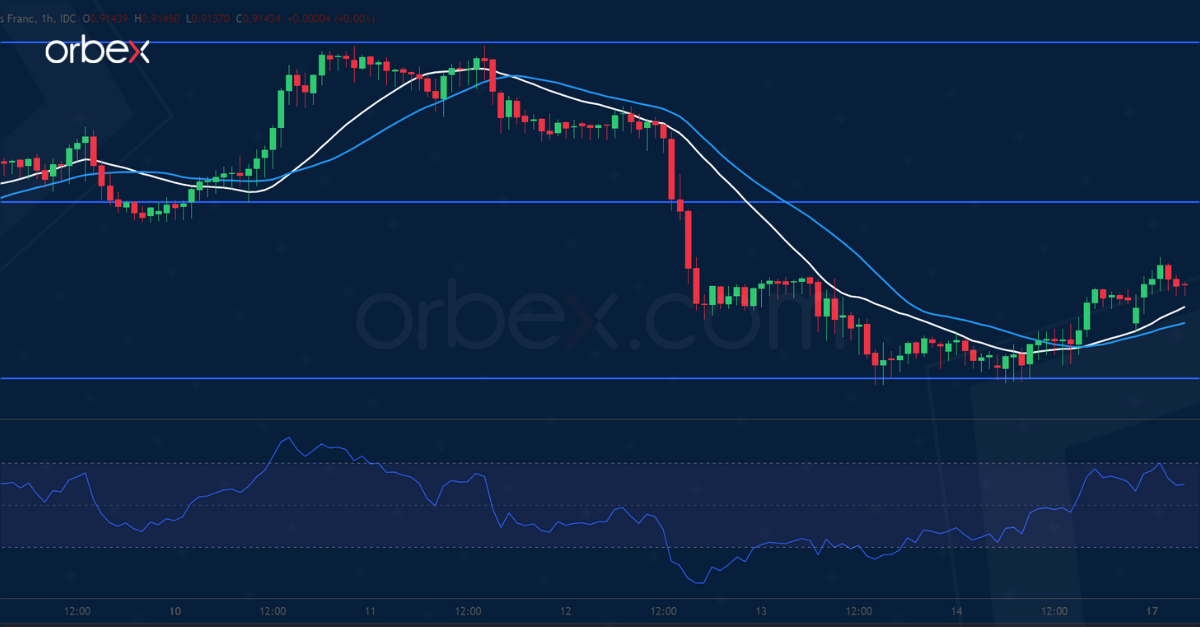
USD/CHF Attempts to Rebound
The US dollar came under pressure after a contraction in December’s US retail sales.
Strong selling pressure from the supply area around 0.9280 has pushed the pair all the way below the daily support at 0.9100.
An oversold RSI triggered a buying-the-dips behavior but the rebound could be limited as sentiment tilted to the bearish side.
The bulls will need to reclaim the support-turned-resistance at 0.9190 first. Otherwise, a new round of sell-off below 0.9090 could send the greenback to last August lows near 0.9020.
US30 Index Meets Support at 200-SMA; Bearish Forces Persist
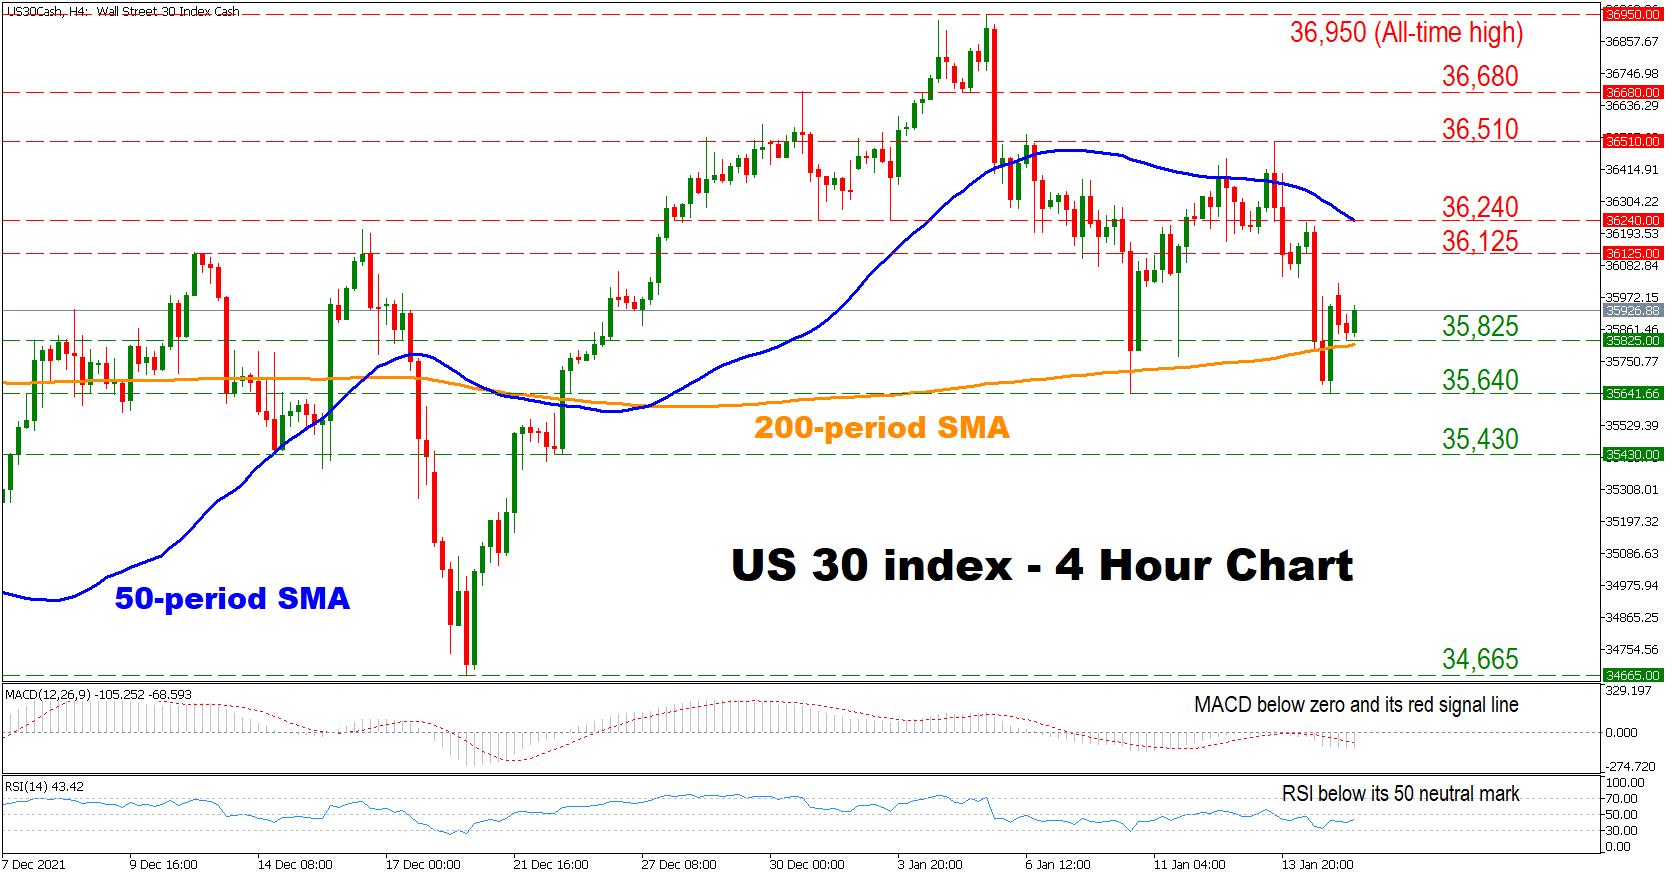
The US 30 index has retreated from its all-time high in early January amid strengthening negative momentum. Moreover, the index has crossed below the 50-period simple moving average (SMA), which is considered as a bearish sign for the near term.
Short-term momentum indicators are also reflecting a negative bias for the index, as the RSI is located below its 50 neutral mark. The MACD is found below zero and below its red signal line, indicating that negative momentum might be gaining further ground.
Should the bears remain in charge, initial support might be found at the region which includes the 35,825 level and the 200-period SMA currently at 35,800. A break below that area could pressure the price towards the 35,640 obstacle, before sellers eye the 35,430 hurdle. Crossing below the latter, could increase selling pressures, opening the door towards the 34,665 barrier.
On the flip side, if the bulls retake control, the first target might be the 36,125 resistance before shifting their attention towards the area which includes the 50-period SMA and the 36,240 level. A decisive move above the latter could restore positivity for the index, paving the way towards the 36,510 point. Surpassing this obstacle, the price could then test the 36,680 barrier before sellers shift their attention towards the all-time high at 36,950.
In brief, the short-term outlook for the index is cautiously bearish. For sentiment to change, buyers would need to drive the price above the 50-period SMA.
Pound Drifting Close to 1.37
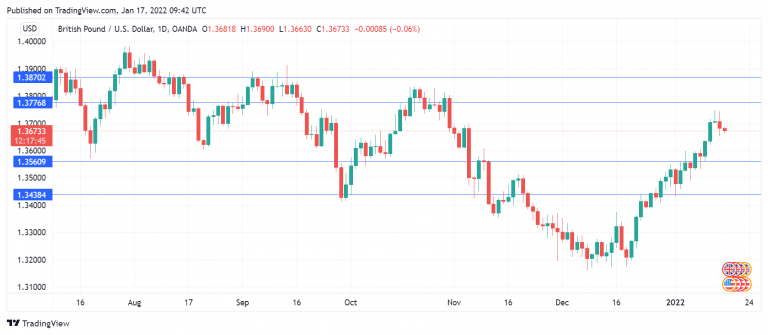
The British pound is flat as we start the new trading week. The currency enjoyed another positive week and GBP/USD has now risen for four consecutive weeks, as the US dollar continues to struggle.
There are two factors behind which are driving the pound higher. First, investor risk appetite remains strong, which has led to a rotation out of US dollars and into the major currencies. Investors remain in risk-on mode despite soft US employment and retail sales numbers and a more hawkish Federal Reserve. Second, UK data has been solid, as the recovery continues to gain steam. UK GDP for November jumped 0.9%, much stronger than expected and pushing GDP above the pre-Covid level for the first time. On Tuesday, the UK releases key employment numbers, and I would expect some movement from GBP/USD in the European session.
Johnson leadership in crisis
Prime Minister Boris Johnson is under intense pressure to resign, over all things, reports that he and his staff took part in numerous parties when lockdowns and Covid restrictions were in effect. Johnson has admitted that he attended a party with alcohol in May 2020, during the first lockdown, but claimed it was a work event. This has been met with ridicule and some of Johnson’s fellow Conservative lawmakers have joined in the growing calls for him to resign. An official investigation into the matter, which will be released shortly, will likely determine whether Johnson keeps his job. The latest political crisis has not made a dent in the pound’s upswing, but the currency could come under pressure if this political storm topples Johnson and leads to a period of political instability in the UK.
GBP/USD Technical Analysis
- There are support levels at 1.3560 and 1.3438
- GBP/USD faces resistance at 1.3776. This is followed by resistance at 1.3870
Brent Crude Hits a New Multi-Year High
Oil prices are showing no signs of easing as the bull market remains well supported by fundamentals. Brent crude has rallied for four consecutive weeks, surging by more than 11% since the beginning of the year and up 32% from the lows of early December 2021 when the highly transmissible Omicron coronavirus variant began spreading across the globe.
Crude futures touched a new three-year high at $86.71 in Asia this morning as traders closely monitor whether the bull run will continue. This is the level when Brent peaked in October last year and in October 2018 after which prices dropped sharply by 42% in the following three months. An upside breakout from here leaves us with no near-term major resistance level, suggesting a potential test of $90 and the more psychological resistance level of $100. What seemed impossible a few months ago is now highly likely to occur.
Several factors have contributed to the latest rally, including outages in Libya, Nigeria, Angola, Ecuador, and Canada most recently due to the extreme cold weather. Refiners may have also reduced purchases in December when the Omicron variant began to spread, but they were caught by a surprise as demand wasn’t severely affected, and now they are trying to cover the gap. So, it is both sides of the supply/demand equation that is contributing to the rally and previous expectations of supply outpacing demand in the first quarter isn’t materialising.
Geopolitical risk premium may also increase if the conflict between Russia and Ukraine escalates. Further disruptions of Russia’s gas supplies to Europe will not only lead to higher gas prices but also crude oil.
Only OPEC members and their allies can bring prices down at this stage by pumping more crude from the big players. However, there doesn’t seem to be a willingness to do this. Instead, OPEC+ are likely to continue pursuing their strategy of gradually relaxing output cuts as they enjoy the current high price tag.
While current prices may not be sustained at current or higher levels in the long run, we are still likely to see a further rally in the near term as tailwinds remain intact.
Will US Inflation Calm Down in 2022?
Breaking news: coronavirus won't be the number one enemy of the global economy in 2022. Instead, this year's most significant risks will come from inflation and policymakers' decisions in the recovery era from the consequences of the pandemic. Unfortunately, things are about to get worse before they get steadily better. This is roughly the belief economists have of the trajectory of US inflation in 2022.
In 2021, policymakers at the Federal Reserve and other central banks confidently shrugged off concerns about inflation, labor shortages, and supply chain bottlenecks as short-term consequences of the pandemic. Just give it some time, and these problems will be solved. That was the reasoning of central banks.
If this proves not true within the next 12 months, policymakers got it wrong, and the consequences will be worse than the COVID-19 recession.
How does the Federal Reserve see inflation?
The Fed stuck to the narrative that a large part of the inflation "surprise" during 2021 was due to the temporary rise in energy prices that affected the rest of the sectors, with transportation and shipping costs rising strongly, as supply problems increased, which led to strengthening the inaction of central banks.
However, by September, US inflation was at 6.8% annually, the highest level in 30 years and nearly three times the Fed's forecast at the beginning of 2021. As a result, in December, the inflation narrative finally shifted from "it's temporary" to "it's taking a long time to calm down, and may need a push to move on."
Markets are now betting that the Federal Reserve will raise interest rates at least three times in 2022 to withdraw stimulus and cheap money from the markets in an attempt to control inflation as quickly as possible after it reached its highest level in 40 years in December (7.1%).
The US economy will grow despite high inflation
Bloomberg expects the US economy to grow by 4.4% during the first half of 2022 and then slow to 2.7% in the second half of the year.
One of the main reasons the US economy will grow is that most American consumers still have money to spend — that $2.6 trillion stimulus in household bank accounts the US government gave them. These funds will help support demand and revive the economy.
When will inflation decline in the United States?
(1) The supply chains are expected to become somewhat more organized later in the year.
(2) It is unlikely that there will be a repeat of the exceptional lockdown period that we saw at the beginning of the coronavirus. Some commodities, including oil, have already surpassed their record pandemic heights.
(3) The Fed has begun to tighten its monetary policy, and these factors are supposed to tip the scales towards lower inflation rates. Add all that together, and you'll see why most economists expect inflation to slow to less than 3% by the end of 2022.
Gold Price Moved into a Short-Term Negative Zone Below $1,820
Gold price failed to clear the $1,830 resistance and corrected lower against the US Dollar. The price broke the $1,820 support level to move into a short-term negative zone.
Besides, there was a break below the $1,815 level and the 50 hourly simple moving average. However, the bulls are now protecting the $1,812 support zone. It is now rising and approaching the $1,820 resistance zone.
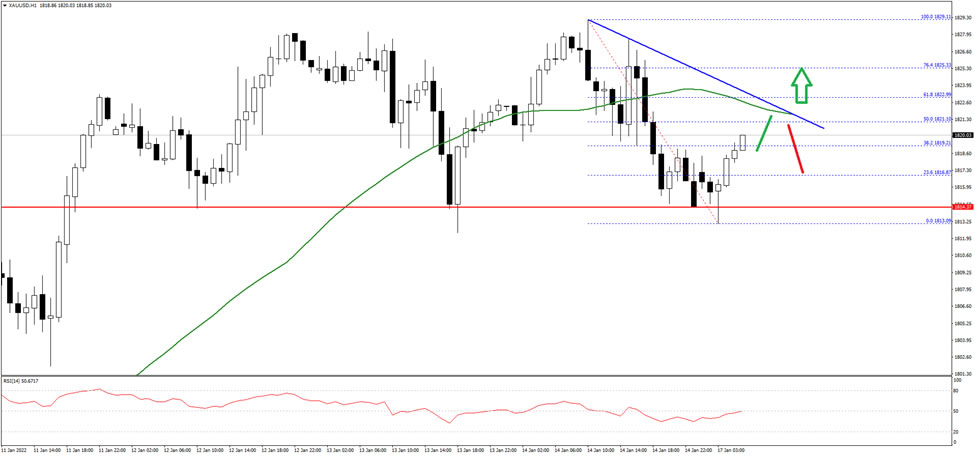
On the upside, the price is facing resistance near the $1,822 level. There is also a key bearish trend line with resistance near $1,822 on the same chart. The next main resistance could be near the $1,830 level, above which the price could rise towards the $1,842 level.
An initial support on the downside is near the $1,815 level, below which there is a risk of more downsides. In the stated case, the price could test $1,800 on FXOpen.
EURUSD Hovers Beyond Long-Term Descending Line; Weak Bullish Bias
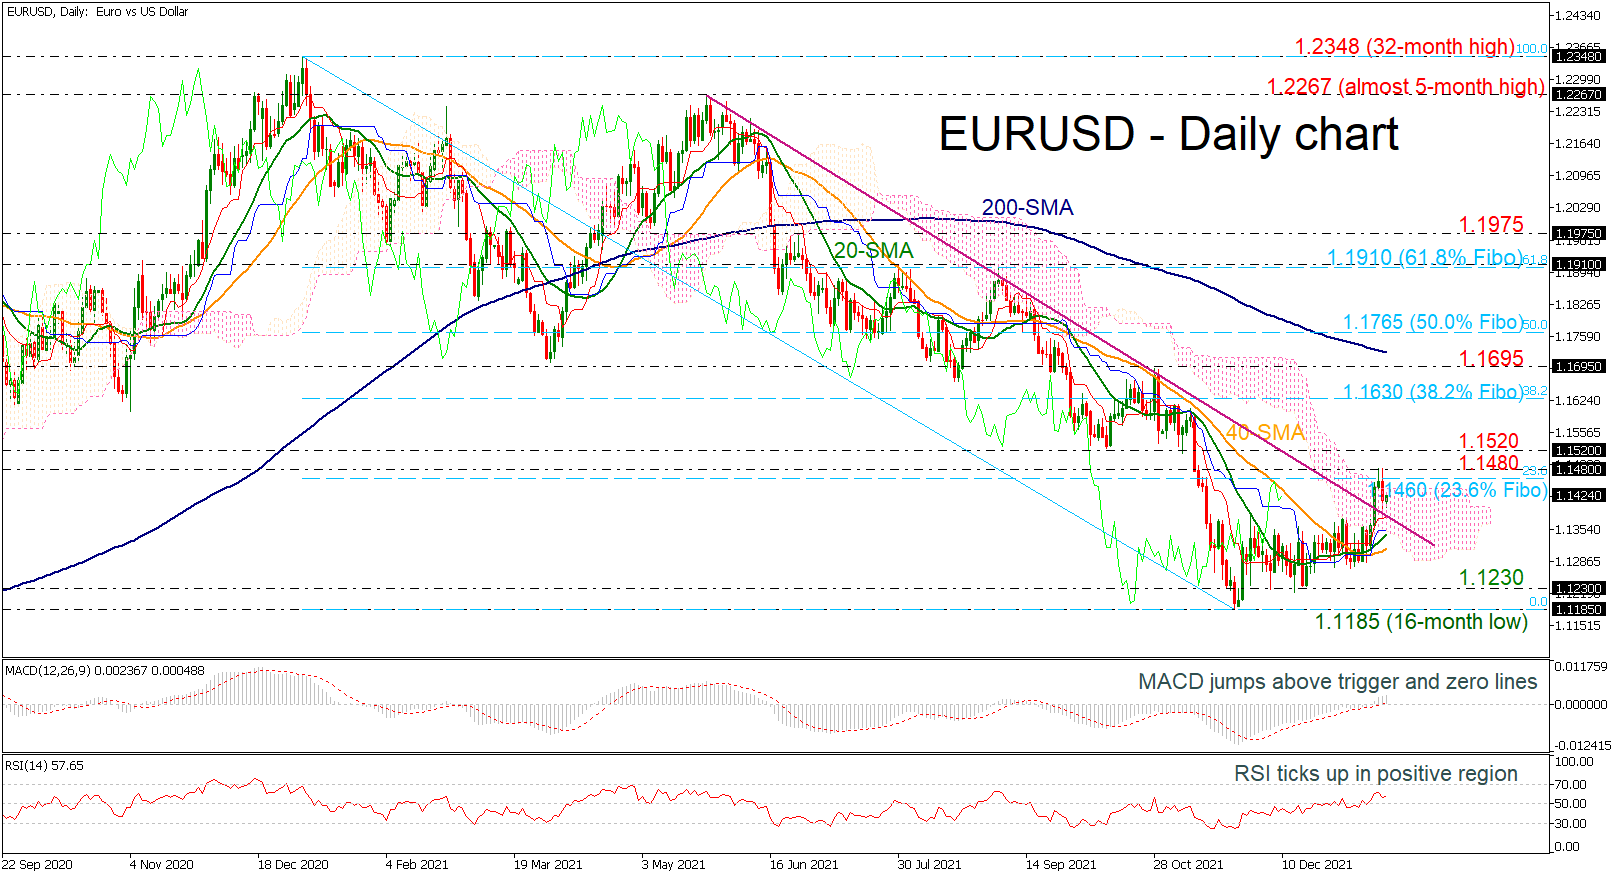
EURUSD is returning around the 1.1400 level and is flirting with the long-term descending trend line in the Ichimoku cloud. Also, the price is still hovering underneath the 23.6% Fibonacci retracement level of the down leg from 1.2348 to 1.1185 at 1.1460 and is trying to overcome the latest highs of the preceding week.
According to technical indicators, the MACD oscillator is holding above its trigger and zero lines, while the RSI is pointing slightly up in the positive region. The 20- and 40-day simple moving averages (SMAs) are following the current market action, confirming the recent bullish crossover.
Should buying forces strengthen, the 1.1480-1.1520 resistance area will come under the spotlight. The 38.2% Fibonacci of 1.1630 could initially be a tough resistance to the bias on the negative side. However, moving higher, the 1.1695 barrier and the 200-day SMA at 1.1725 could next add some footing ahead of the 50.0% Fibonacci of 1.1765.
Alternatively, a close below the Ichimoku cloud will turn the focus to the downside again, pushing the price towards the 1.1230 support level. Beyond that, the rally may gear down to the 16-month low of 1.1185 and the 1.1015 hurdle, taken from the inside swing high in April 2020.
In brief, EURUSD is facing a weakening bullish bias, where a drop below 1.1300 is expected to enhance selling interest again.
Daily Technical Analysis
EUR/USD
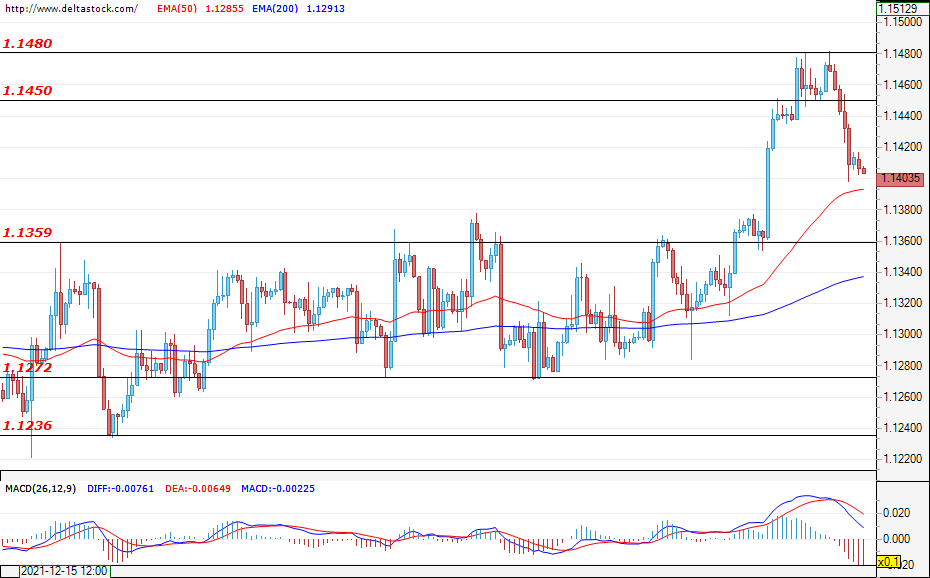
After the rally was limited by the resistance zone at 1.1480, the bears prevailed. The European common currency lost quite a bit of ground against the dollar and, during the early hours of today`s trading, the pair is holding positions around the psychological level at 1.1400. If the bearish prevalence continues, then the expectations will be for a test of the support at 1.1359. A breach of the mentioned zone could easily deepen the corrective move towards 1.1272. If the bulls re-enter the market, then their first resistance can be found at 1.1450. Only a successful violation of the next target at 1.1480, however, could lead to future gains and could easily head the price towards the November 2021 levels of around 1.1520. The expected data for the initial jobless claims (Thursday; 13:30 GMT) should lead to increased volatility.
USD/JPY
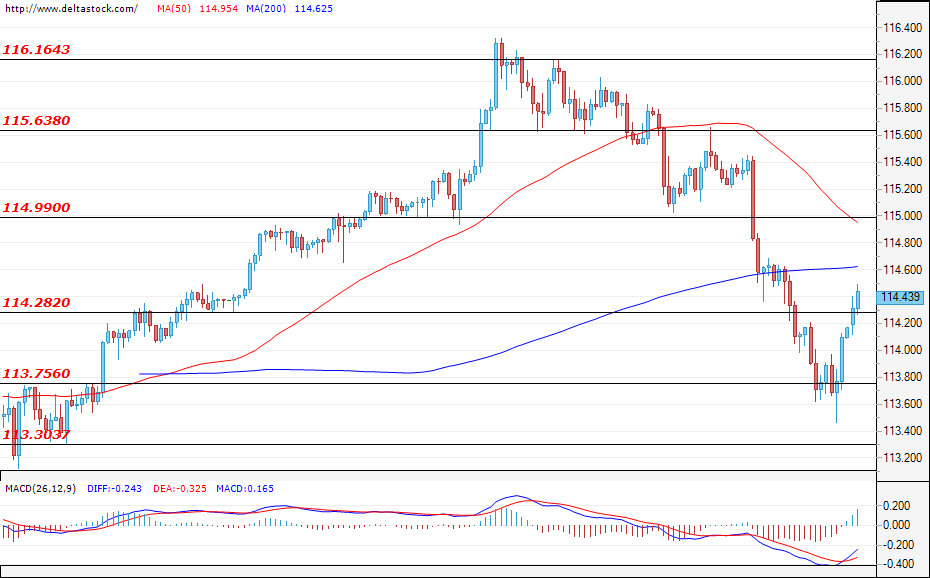
The support zone at 113.75 withheld the bearish attack and the Ninja recovered some of its recent losses. The price tested the close resistance at 114.28 and, at the time of writing, is trading above the mentioned zone. A confirmation of the breach could easily lead to a recovery and could pave the way for a violation attempt of the next resistance at 114.99. If the bullish momentum fades, then a new successful test of the zone at 113.75 on behalf of the bears could mark the current move as a corrective and could easily deepen the decline towards the support zone at 113.30.
GBP/USD
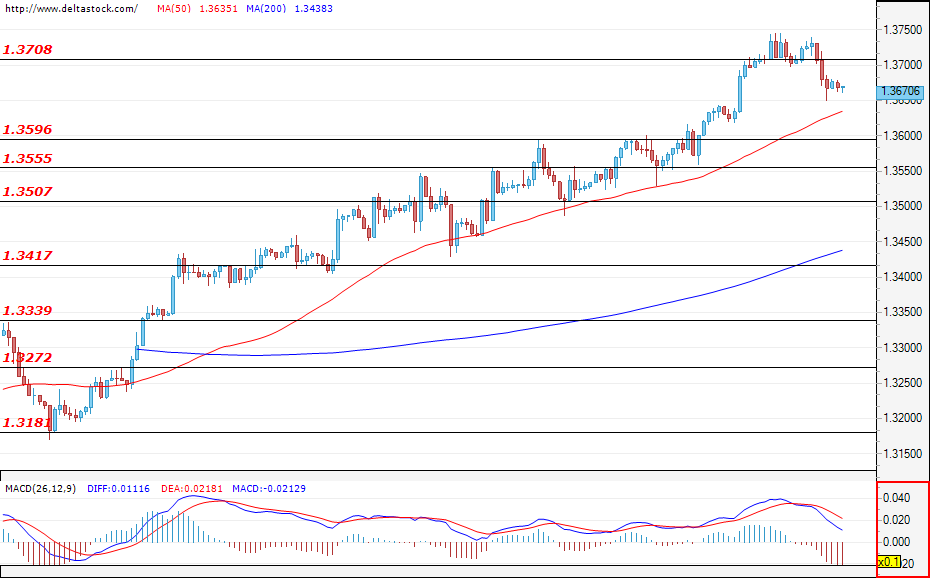
The breach of the resistance zone at 1.3708 was not confirmed and the GBP lost some ground against the USD. The pair consolidated under the mentioned level and, if the bears prevail, then a test of the support at 1.3596 would be the most probable scenario. A violation of the next target at 1.3555, followed by a breach of the lower support at 1.3507, could lead to a change in the current sentiment of the market participants. If the bulls re-enter the market, then a new attack and a breach of the resistance zone at 1.3708 could most likely prolong the pair’s rally.
EUGERMANY40
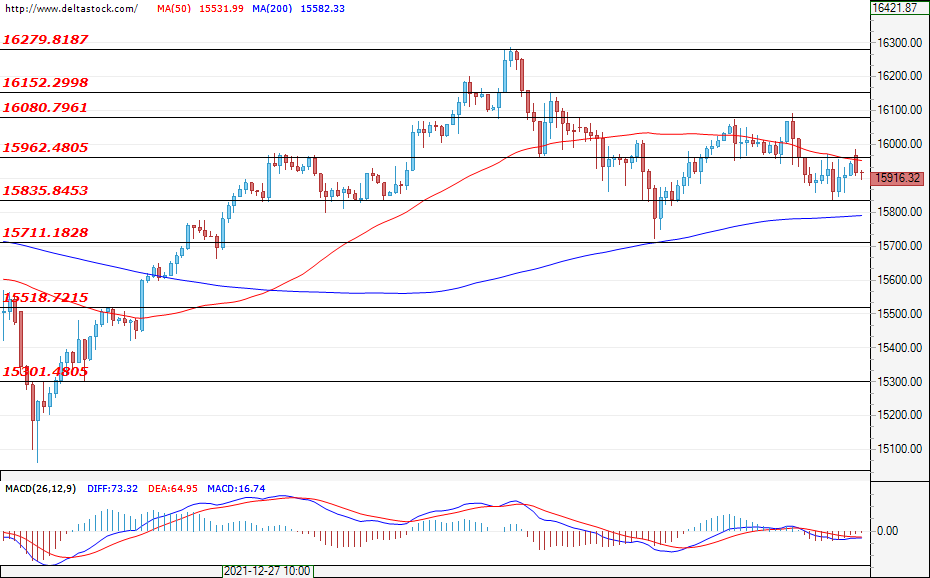
Neither the bulls nor the bears managed to gain enough momentum and trading activity remains locked in the zone between 15835 and 15962. A breach of the upper border could easily lead the German index towards the next resistance at 16080, where a violation would strengthen the positive expectations. In the negative direction, the first support is found at the level of 15835, followed by the lower zone at 15711.
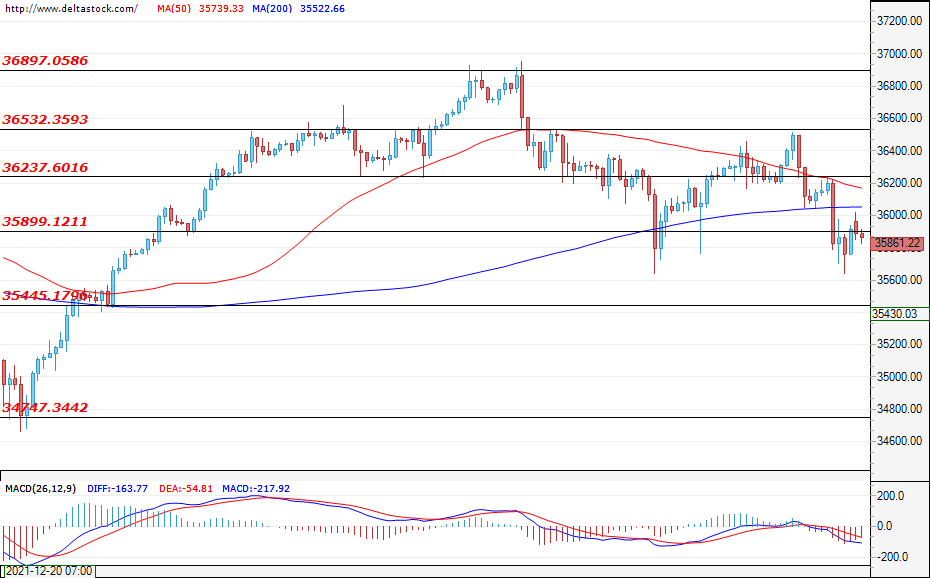
US30
The US30 tested the support zone at 35899 and, during the early hours of today`s trading, the price is hovering under the mentioned level. A confirmation of the breach and a successful violation of the lower target at 35445 could easily deepen the decline and lead to a drop towards 34747. An important resistance for the bulls is the level at 36237, followed by the upper zone at 36532. This week, investors will focus on the expected initial jobless claims data for the U.S. (Thursday; 13:30 GMT).