

Sample Category Title
USD/CAD Daily Outlook
Daily Pivots: (S1) 1.2488; (P) 1.2529; (R1) 1.2588; More...
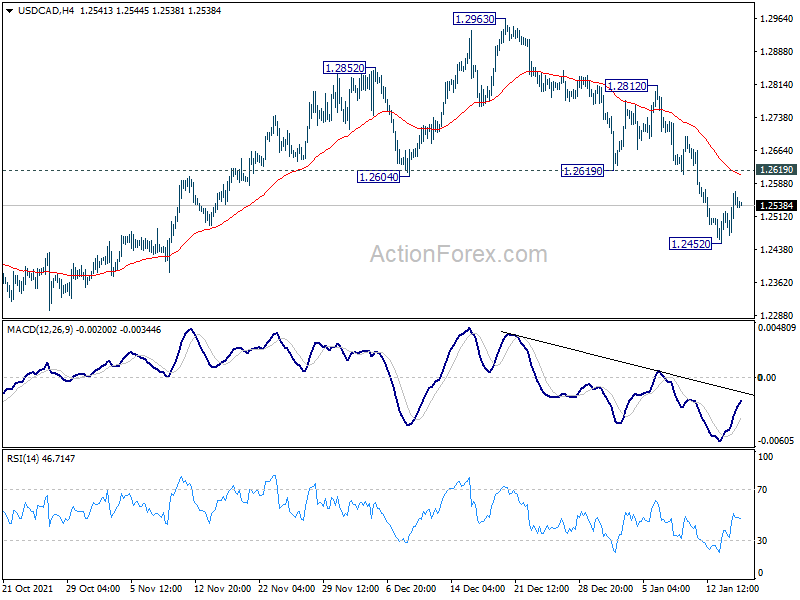
Intraday bias in USD/CAD remains neutral for consolidation above 1.2452 temporary low. Further fall is expected as long as 1.2619 support turned resistance holds. Current development argues that whole pattern from 1.2005 has completed with three waves to 1.2963. Below 1.2452 will target 1.2286 support, and possibly further to retest 1.2005 low. Nevertheless, firm break of 1.2619 will bring stronger rebound back to 1.2812 resistance.
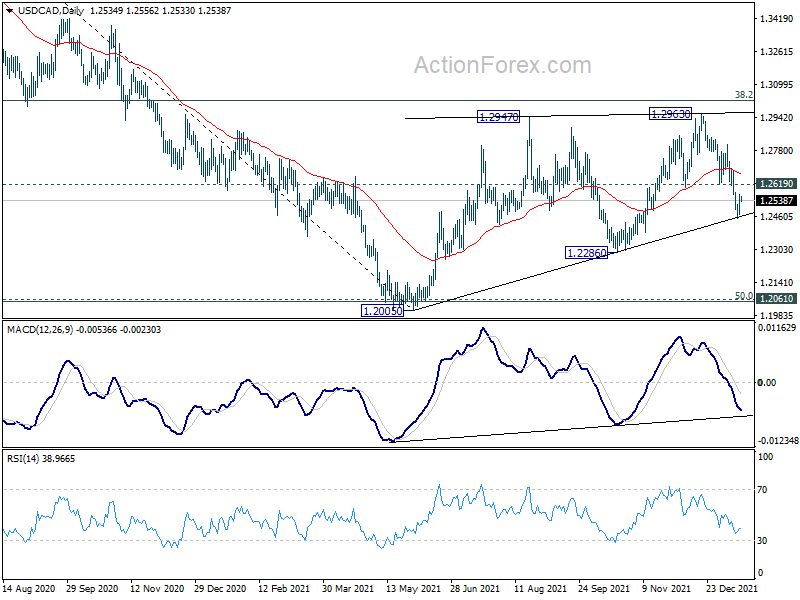
In the bigger picture, focus will be on 38.2% retracement of 1.4667 (2020 high) to 1.2005 (2021 low) at 1.3022. Sustained break there should confirm that the down trend from 1.4667 has completed after defending 1.2061 long term cluster support. Further rise would then be seen towards 61.8% retracement at 1.3650. However, rejection by 1.3022 will maintain medium term bearishness. Break of 1.2005 will resume the down trend form 1.4667 and that carries larger bearish implications too.
EUR/GBP Daily Outlook
Daily Pivots: (S1) 0.8337; (P) 0.8350; (R1) 0.8357; More...
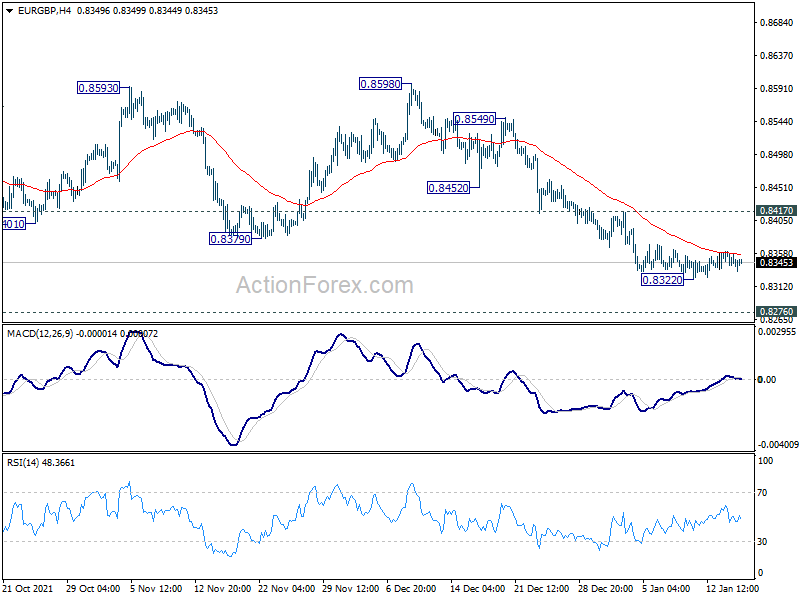
Intraday bias in EUR/GBP remains neutral and more consolidations could be seen above 0.8322. Upside of recovery should be limited by 0.8417 resistance to bring another decline. On the downside, break of 0.8322 will resume recent down trend to 0.8276 key long term support. On the upside, however, above 0.8417 will turn bias back to the upside for stronger rebound.
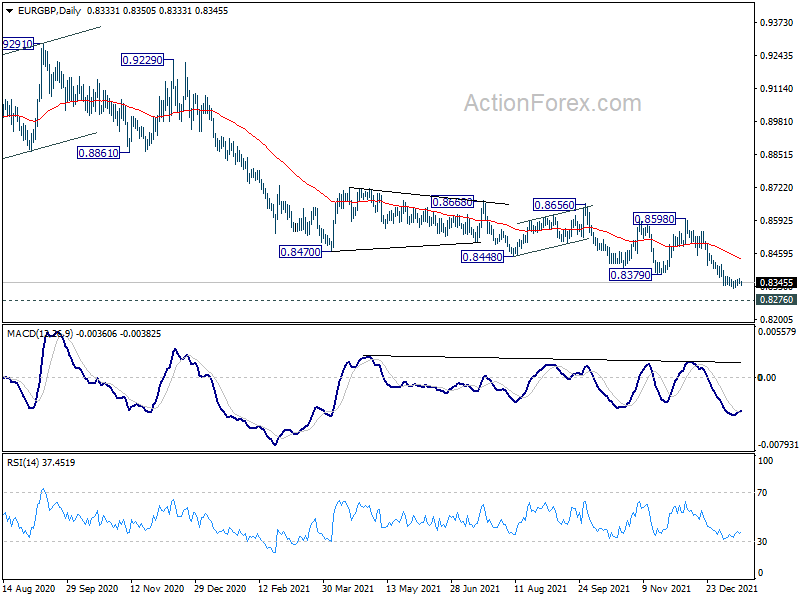
In the bigger picture, price actions from 0.9499 (2020 high) are still seen as developing into a corrective pattern. Deeper fall could be seen as long as 0.8598 resistance holds, towards long term support at 0.8276. We'd look for bottoming signal around there to bring reversal. Meanwhile, firm break of 0.8598 will now be an early sign of medium term bottoming and bring stronger rebound. However, sustained break of 0.8276 will argue that the long term trend has reversed.
EUR/AUD Daily Outlook
Daily Pivots: (S1) 1.5746; (P) 1.5798; (R1) 1.5868; More...
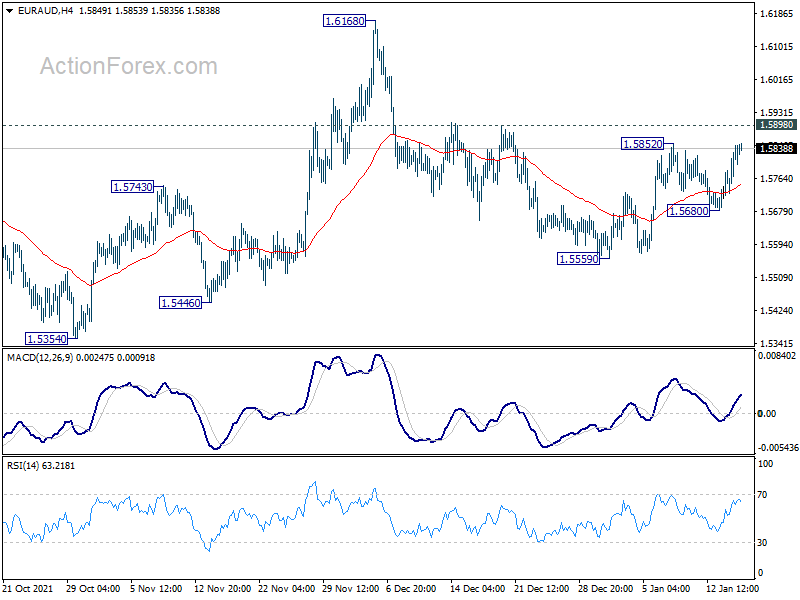
Intraday bias in EUR/AUD remains neutral and outlook is unchanged. On the downside, break of 1.5559 will resume the fall from 1.6168 to retest 1.5250/5354 support zone. On the upside, however, break of 1.5898 will argue that pull back from 1.6168 has completed. Intraday bias will be back to the upside for 1.6168 resistance.
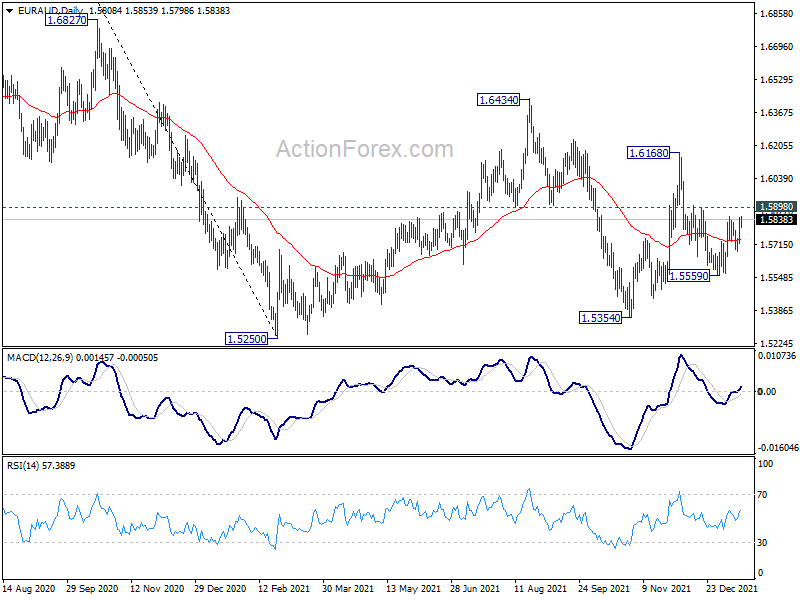
In the bigger picture, rise from 1.5354 is seen as the third leg of the corrective pattern from 1.5250 low. Further rise cannot be ruled out, but even in that case, strong resistance should be seen at 38.2% retracement of 1.9799 to 1.5250 at 1.6988. Larger down trend from 1.9799 is in favor to extend through 1.5250 at a later stage.
EUR/CHF Daily Outlook
Daily Pivots: (S1) 1.0418; (P) 1.0433; (R1) 1.0447; More....
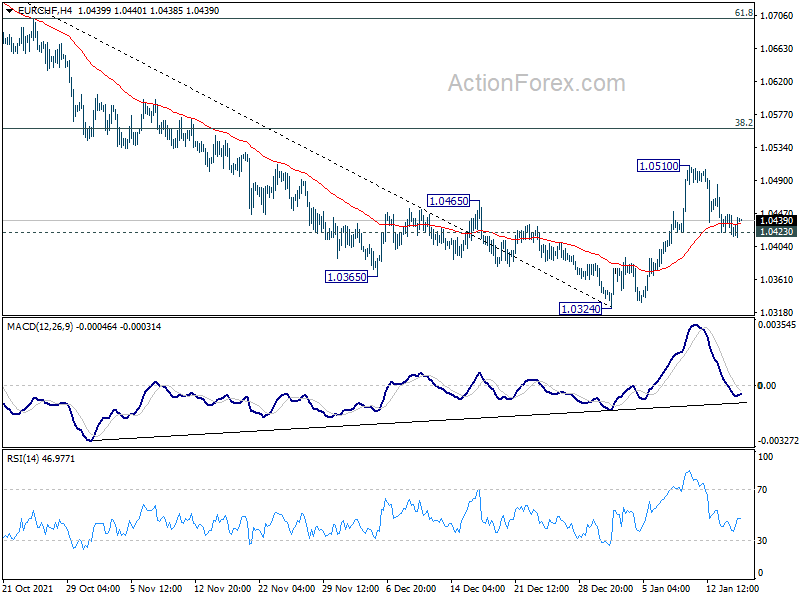
Intraday bias in EUR/CHF remains neutral for the moment. Rebound from 1.0324 could still extend higher. But upside should be limited by 38.2% retracement of 1.0936 to 1.0324 at 1.0558. On the downside, firm break of 1.0423 will bring retest of 1.0324 low. Break there will resume larger down trend from 1.1149.
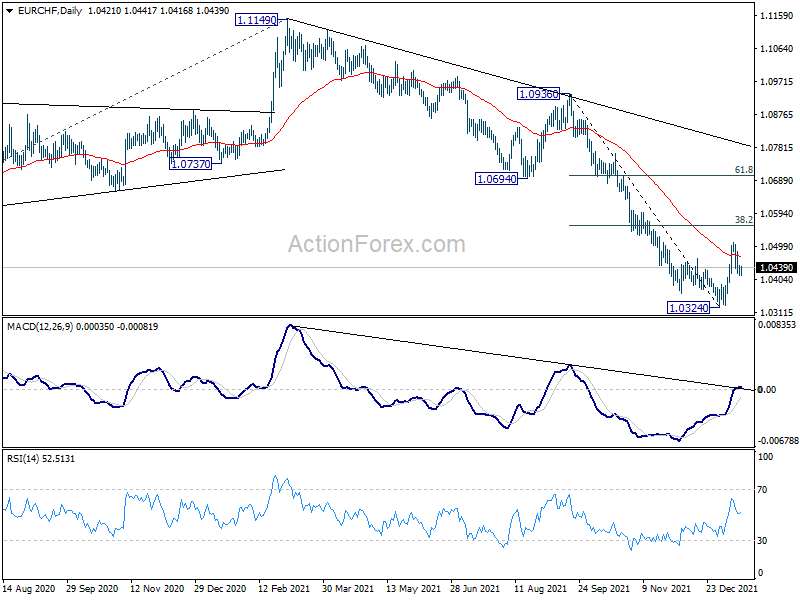
In the bigger picture, long term down trend from 1.2004 (2018 high) is now extending. Next target is 61.8% projection of 1.2004 to 1.0505 to 1.1149 at 1.0223. On the upside, firm break of 1.0505 support turned resistance is needed to be the first sign of medium term bottoming. Otherwise, outlook will remain bearish even in case of rebound.
EUR/JPY Daily Outlook
Daily Pivots: (S1) 129.83; (P) 130.34; (R1) 130.90; More....
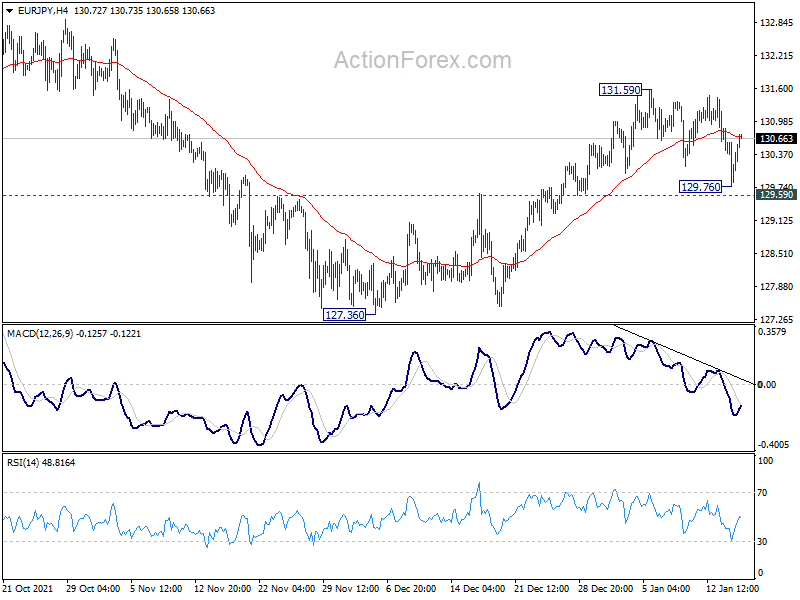
Intraday bias in EUR/JPY remains neutral for the moment. On the upside, break of 131.59 resistance will reaffirm the bullish case that consolidation from 134.11 could have completed with three waves down to 127.36, ahead of 126.58 medium term fibonacci level. Further rally would then be seen to retest 133.44/134.11 resistance zone. On the downside break of 129.59 minor support will argue that rebound from 127.36 has completed and turn bias back to the downside for this support.
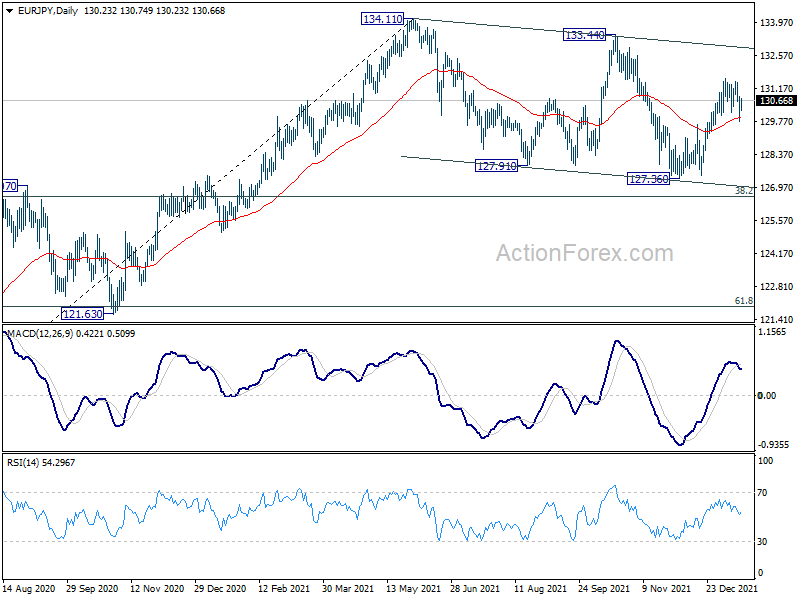
In the bigger picture, as long as 38.2% retracement of 114.42 (2020 low) to 134.11 at 126.58 holds, up trend from 114.42 is still in favor to continue. Break of 134.11 will target long term resistance at 137.49 (2018 high). However, sustained break of 126.58 will raise the chance of medium term bearish reversal. In this case, deeper decline would be seen to 61.8% retracement at 121.94, and possibly below.
GBP/JPY Daily Outlook
Daily Pivots: (S1) 155.59; (P) 156.11; (R1) 156.75; More...
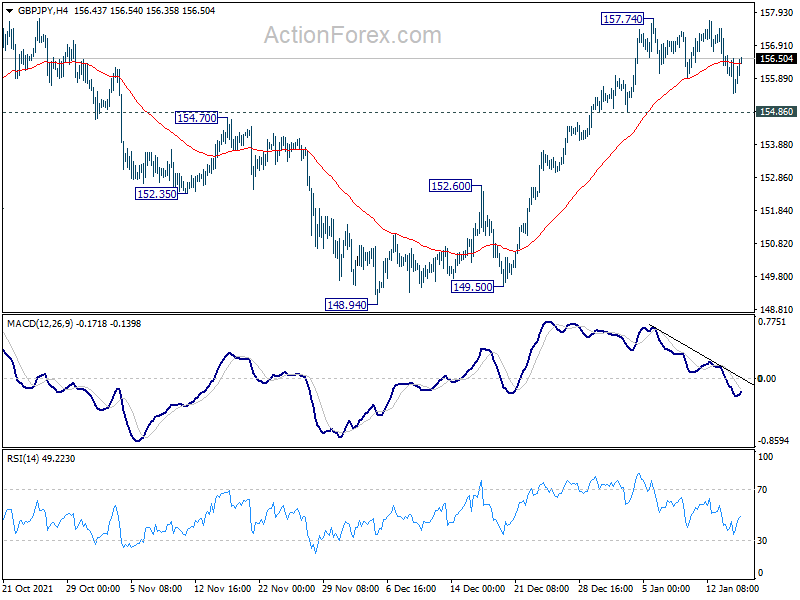
Intraday bias in GBP/JPY remains neutral for the moment, and consolidation from 157.74 could extend. Overall, further rise is still expected with 154.86 support intact. On the upside, decisive break of 158.19 high will resume larger up trend to 167.93 long term fibonacci level. On the downside, below 154.86 minor support will turn intraday bias back to the downside for deeper pull back.
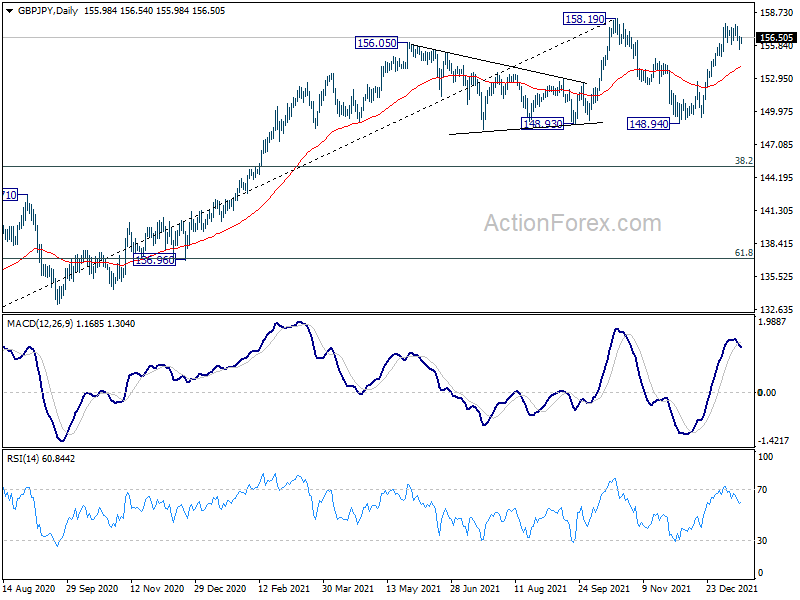
In the bigger picture, strong rebound from 148.93 key structural support retains medium term bullishness. Firm break of 158.19 high will resume whole up trend from 123.94 (2020 low), to 61.8% retracement of 195.86 to 122.75 at 167.93. Nevertheless, firm break of 148.93 will bring deeper correction to 38.2% retracement of 123.94 to 158.19 at 145.10, and possibly further lower, as a correction to up trend from 123.94 at least.
Yen Paring Some Gains in Quiet Asia
The markets are overall relatively quietly in Asian session today and trading could be subdued with US on holiday. Canadian Dollar is resilient with WTI oil staying firm at around 84 handle. Euro and Dollar are both strengthening notably. On the other hand, Yen, Aussie and Kiwi are softening. In particular, traders seem to be lightening up Yen positions ahead of tomorrow's BoJ policy decision and statement.
Technically, while the selloff in USD/JPY was steep last week, EUR/JPY and GBP/JPY are staying in consolidative range only. In particular, GBP/JPY is holding comfortably above 154.86 minor support. We'll turn our focus to 131.59 and 157.12 resistance in EUR/JPY and GBP/JPY today. Break there will resume recent rally in both crosses. If that happens, we'll see if EUR/USD and GBP/USD would break through corresponding levels at 1.1482 and 1.3748.
In Asia, at the time of writing, Nikkei is up 0.77%. Hong Kong HSI is down -0.59%. China Shanghai SSE is up 0.59%. Singapore Strait Times is up 0.08%. Japan 10-year JGB yield is up 0.0044 at 0.155.
China GDP grew 4.0% yoy in Q4, weak retail sales
China GDP grew 4.0% yoy in Q4, much faster than expectation of 3.3% yoy. On a quarterly basis, GDP grew 1.6% qoq, above expectation of 1.1% qoq. For 2021 as a whole, GDP grew 8.1%, slightly above expectation of 8.1%.
In December, industrial production rose 4.3% yoy, above expectation of 3.6%. Retail sales rose 1.7% yoy, below expectation of 3.7% yoy. Fixed asset investment rose 4.9% ytd yoy, slightly above expectation of 4.8%.
The National Bureau of Statistics said, "we must be aware that the external environment is more complicated and uncertain, and the domestic economy is under the triple pressure of demand contraction, supply shock and weakening expectations."
Also from China, steel production dropped for the first time in six years in 2021, down -3% from 1.065B tonnes to 1.03B tonnes. Birth rate dropped to a record low of 7.52 births per 1000 people in 2021, down from 2020's 8.52 births per 1000 people.
Bitcoin staying in sideway consolidation, still defending 40k
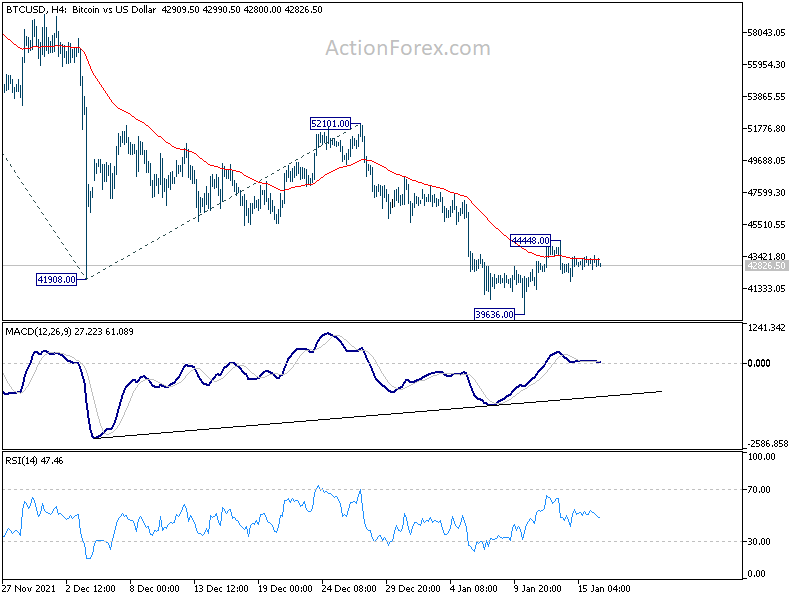
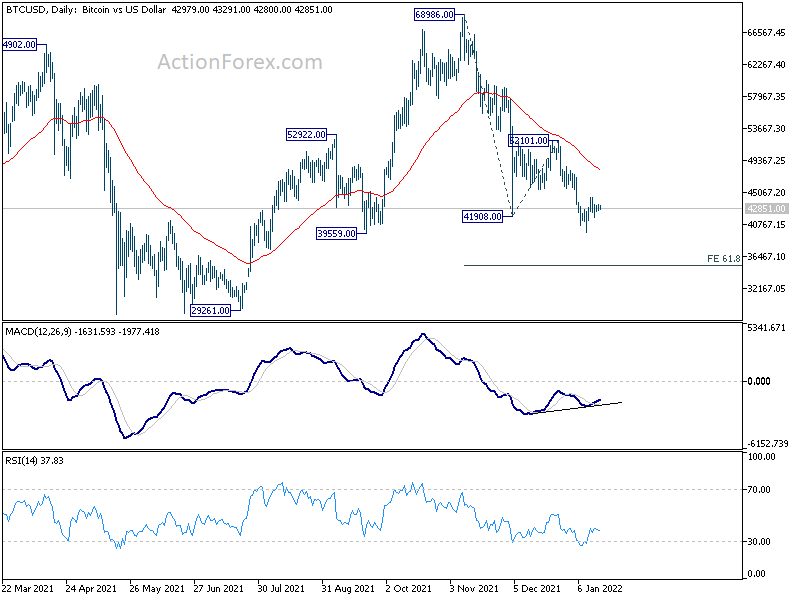
Bitcoin is now staying in consolidation above 39636 short term bottom, after quickly defending 40k handle. Considering that it's sitting just above 39559 structural support too, the consolidation could extend for a while. But outlook will stay bearish for another fall to 61.8% projection of 68986 to 41908 from 52101 at 35366 before completing the decline from 68986 high.
The timing of the downside breakout will depend on the eventual reaction to 4 hour 55 EMA (now at 43211) which it's struggling with. A strong break above 4 hour 55 EMA will stronger rebound to 55 day EMA (now at 48230) first, and rejected there to bring down trend resumption. Meanwhile, rejection by the current level could bring downside breakout rather quickly through 396363 to the mentioned 35366 target.
BoJ to highlight the week, with a batch of UK data
BoJ meeting is a focus for the week even though no policy change is expected. There are talks that debates on telegraphing a rate hike has already started between policymakers. While BoJ is still distant from actually delivering it, they may start to build up market expectations for an eventual hike, by gradually tweaking the forward guidance. It could also be argued that a hint on rate increase could help solidify positive inflation expectation. Meanwhile, CPI from japan will also be closely watched.
Elsewhere, UK will also release a batch of data including employment, inflation and retail sales. But it unsure if markets would shrug off them just like the strong GDP data released last week. Germany ZEW, Canada CPI and retail sales, Australia employment, and China GDP will also be closely watched.
Here are some highlights for the week:
- Monday: Japan machine orders, tertiary industry index; China GDP, retail sales, industrial production, fixed asset investment; Canada foreign securities purchases, manufacturing sales, BoC business outlook survey.
- Tuesday: New Zealand NZIER business confidence; BoJ rate decision; UK employment; Swiss PPI; Germany ZEW economic sentiment; Canada housing starts; US empire state manufacturing, NABH housing index.
- Wednesday: Australia Westpac consumer sentiment; Germany CPI final; UK CPI, PPI; Eurozone current account; Canada CPI, wholesale sales; US housing starts and building permits.
- Thursday: Japan trade balance; Australia employment; Eurozone CPI final, ECB meeting accounts; Germany PPI; US jobless claims, Philly Fed survey, existing home sales.
- Friday: New Zealand BusinessNZ manufacturing index; Japan CPI, BoJ meetings; UK Gfk consumer confidence, retail sales; Canada retail sales, new housing price index.
GBP/JPY Daily Outlook
Daily Pivots: (S1) 155.59; (P) 156.11; (R1) 156.75; More...
Intraday bias in GBP/JPY remains neutral for the moment, and consolidation from 157.74 could extend. Overall, further rise is still expected with 154.86 support intact. On the upside, decisive break of 158.19 high will resume larger up trend to 167.93 long term fibonacci level. On the downside, below 154.86 minor support will turn intraday bias back to the downside for deeper pull back.
In the bigger picture, strong rebound from 148.93 key structural support retains medium term bullishness. Firm break of 158.19 high will resume whole up trend from 123.94 (2020 low), to 61.8% retracement of 195.86 to 122.75 at 167.93. Nevertheless, firm break of 148.93 will bring deeper correction to 38.2% retracement of 123.94 to 158.19 at 145.10, and possibly further lower, as a correction to up trend from 123.94 at least.
Economic Indicators Update
| GMT | Ccy | Events | Actual | Forecast | Previous | Revised |
|---|---|---|---|---|---|---|
| 23:50 | JPY | Machinery Orders M/M Nov | 3.40% | 1.40% | 3.80% | |
| 00:01 | GBP | Rightmove House Price Index M/M Jan | 0.30% | -0.70% | ||
| 02:00 | CNY | GDP Y/Y Q4 | 4.00% | 3.30% | 4.90% | |
| 02:00 | CNY | Retail Sales Y/Y Dec | 1.70% | 3.70% | 3.90% | |
| 02:00 | CNY | Industrial Production Y/Y Dec | 4.30% | 3.60% | 3.80% | |
| 02:00 | CNY | Fixed Asset Investment YTD Y/Y Dec | 4.90% | 4.80% | 5.20% | |
| 04:30 | JPY | Tertiary Industry Index M/M Nov | 1.10% | 1.50% | ||
| 11:00 | EUR | German Buba Monthly Report | ||||
| 13:30 | GBP | NIESR GDP Estimate (3M) Dec | 0.90% | |||
| 13:30 | CAD | Manufacturing Sales M/M Nov | 1.70% | 4.30% | ||
| 15:30 | CAD | BoC Business Outlook Survey |
Technical Outlook and Review
DXY:
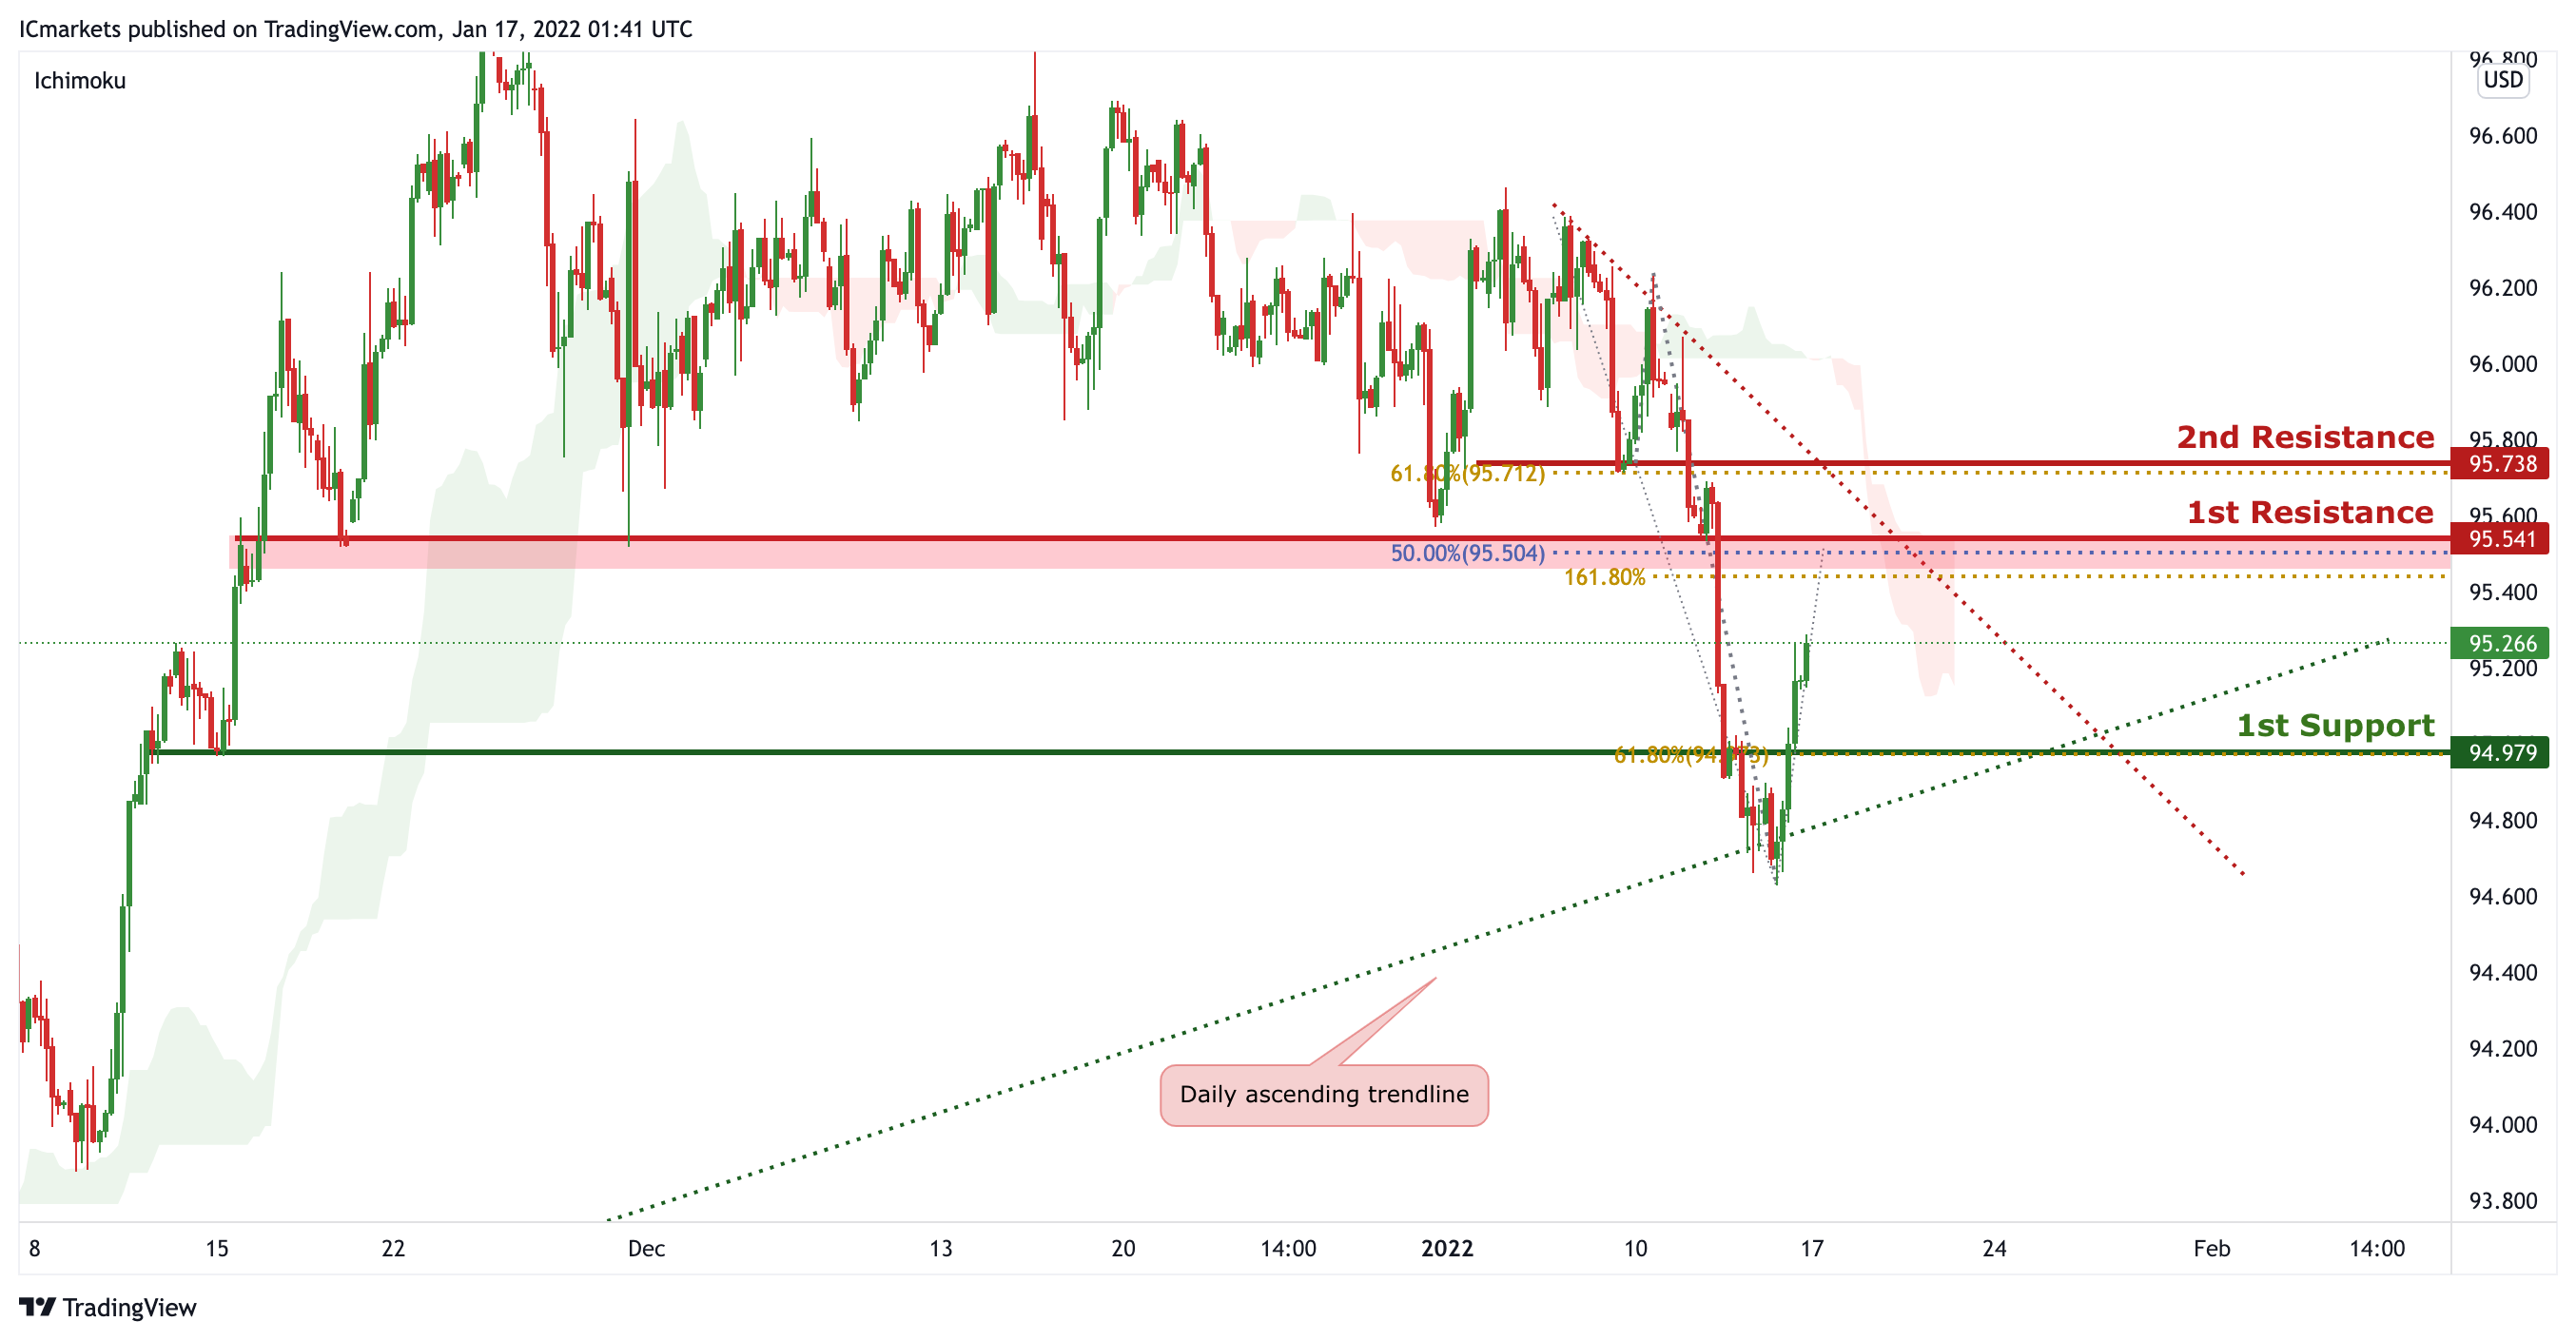
On the H4 timeframe, price is abiding to the ascending trendline support on the daily and descending trendline resistance on the H4. We can now expect price to push higher up to the 1st Resistance in line with 50% Fibonacci retracement and 161.8% Fibonacci projection and drop to 1st Support in line with 61.8% Fibonacci retracement. Our short-term bearish bias is further supported by the Ichimoku cloud indicator acting as a resistance.
Areas of consideration:
- H4 time frame, 1st resistance at 95.541
- H4 time frame, 1st support at 94.979
XAU/USD (GOLD):
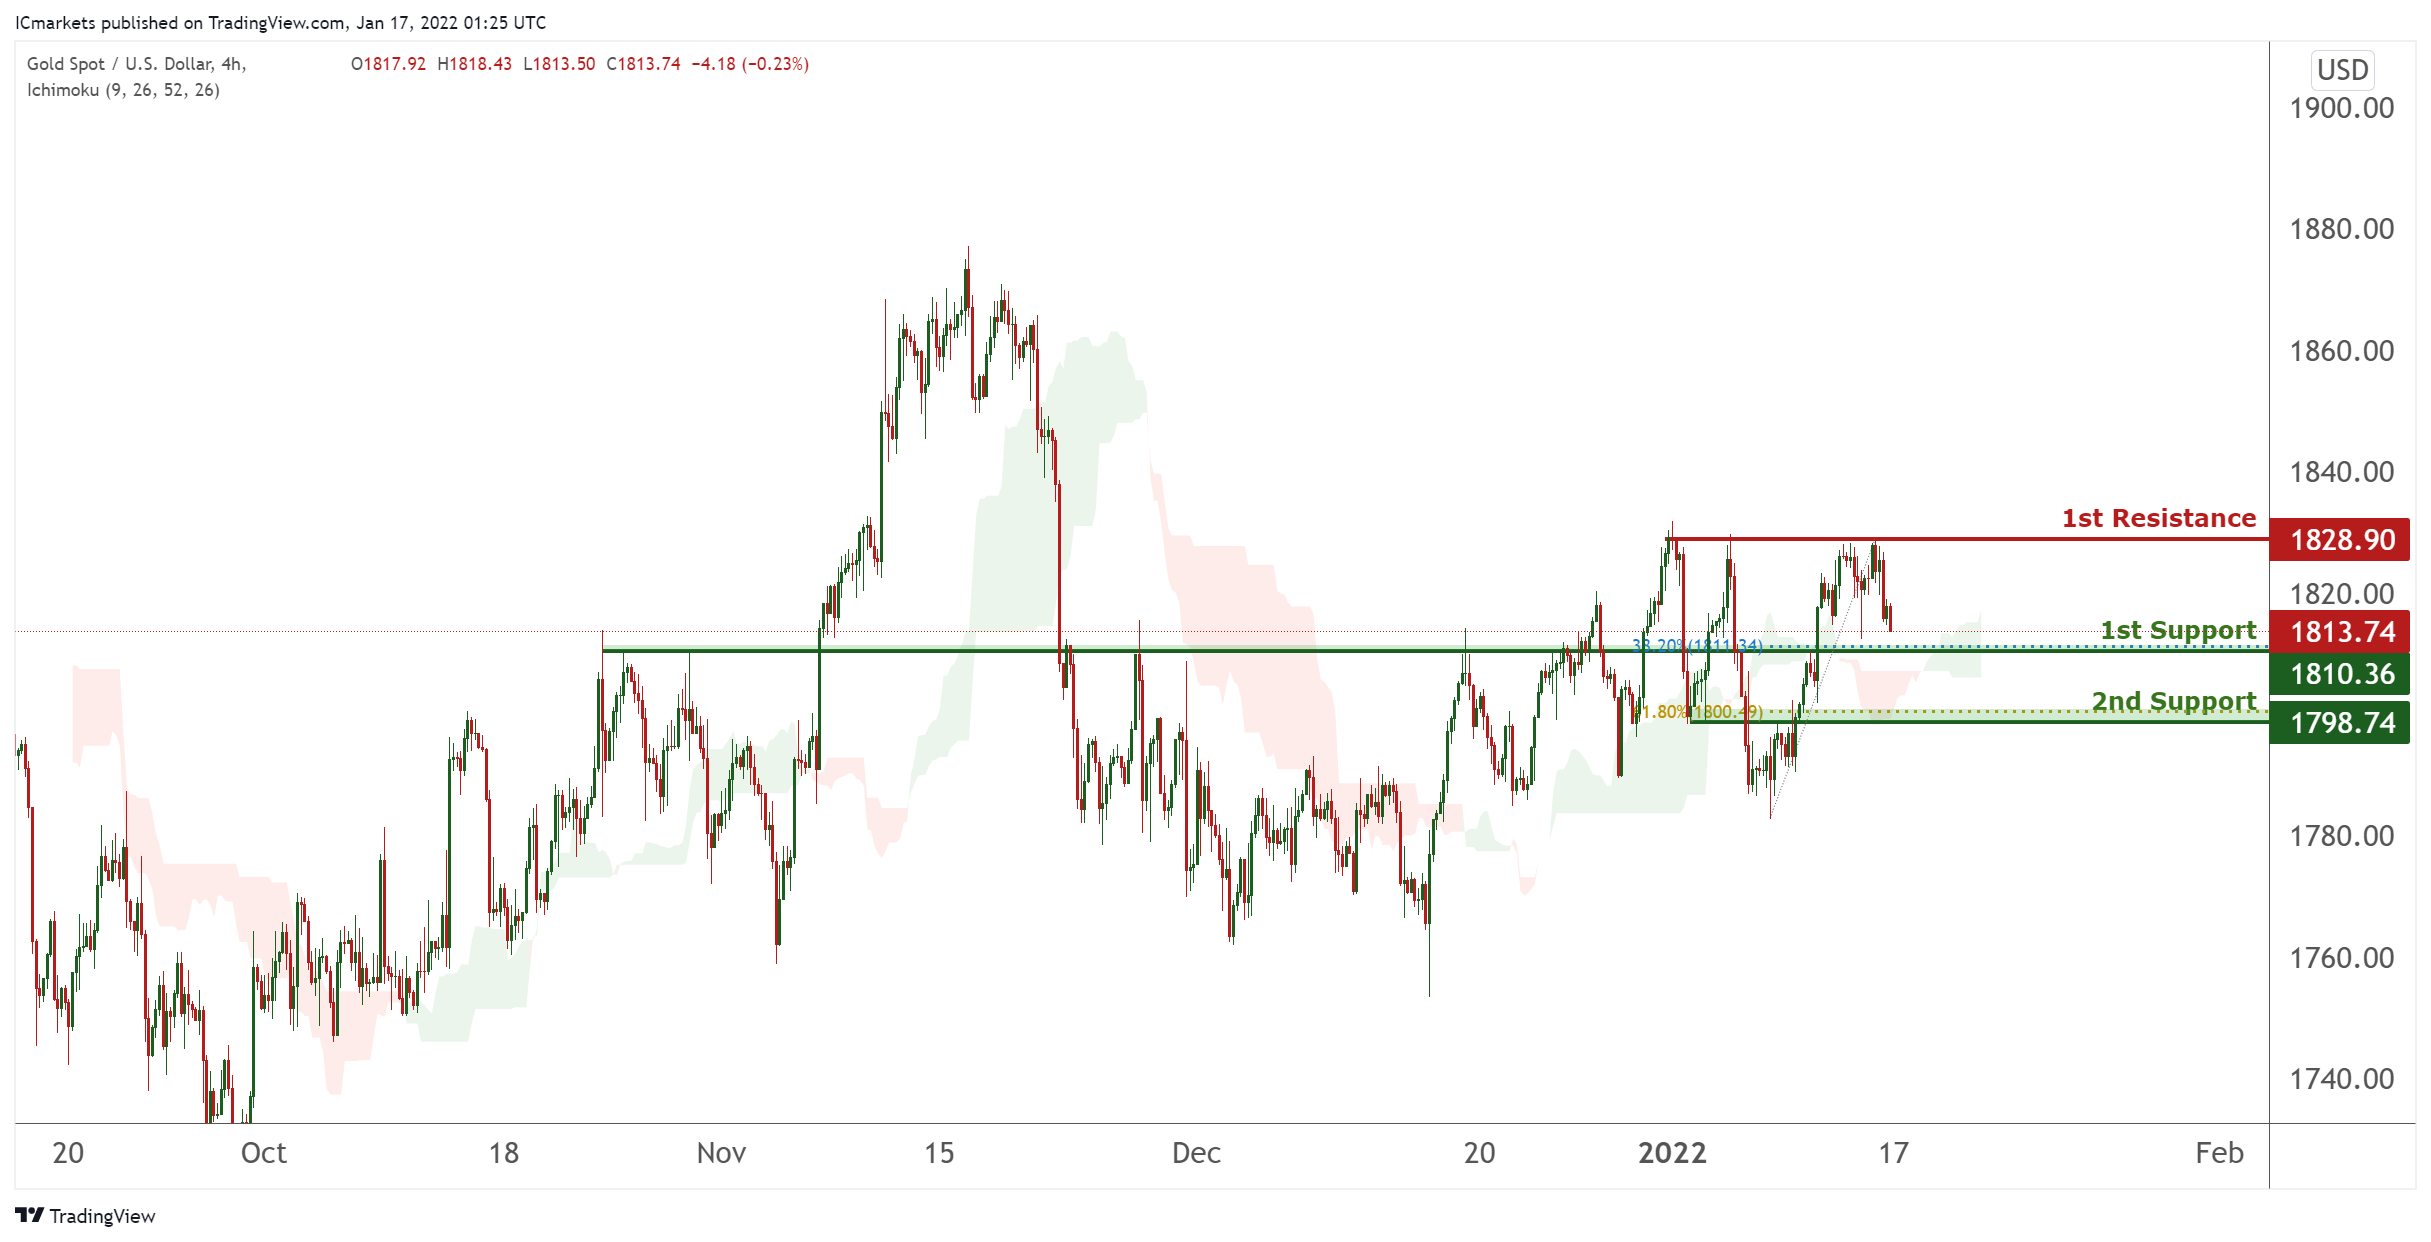
On the H4, with price moving above the ichimoku cloud, we have a bullish bias that price will rise to our 1st resistance at 1828 which is in line with horizontal swing high resistance from 1st support at 1810, which is in line with horizontal overlap support and 738.2% Fibonacci retracement level. Alternatively, price may break 1st support structure and head for 2nd support at 1798, which coincides with horizontal swing overlap support and 61.8% Fibonacci retracement level .
Areas of consideration:
- 4h 1st support at 1828
- 4h 1st resistance at 1810
GBP/USD
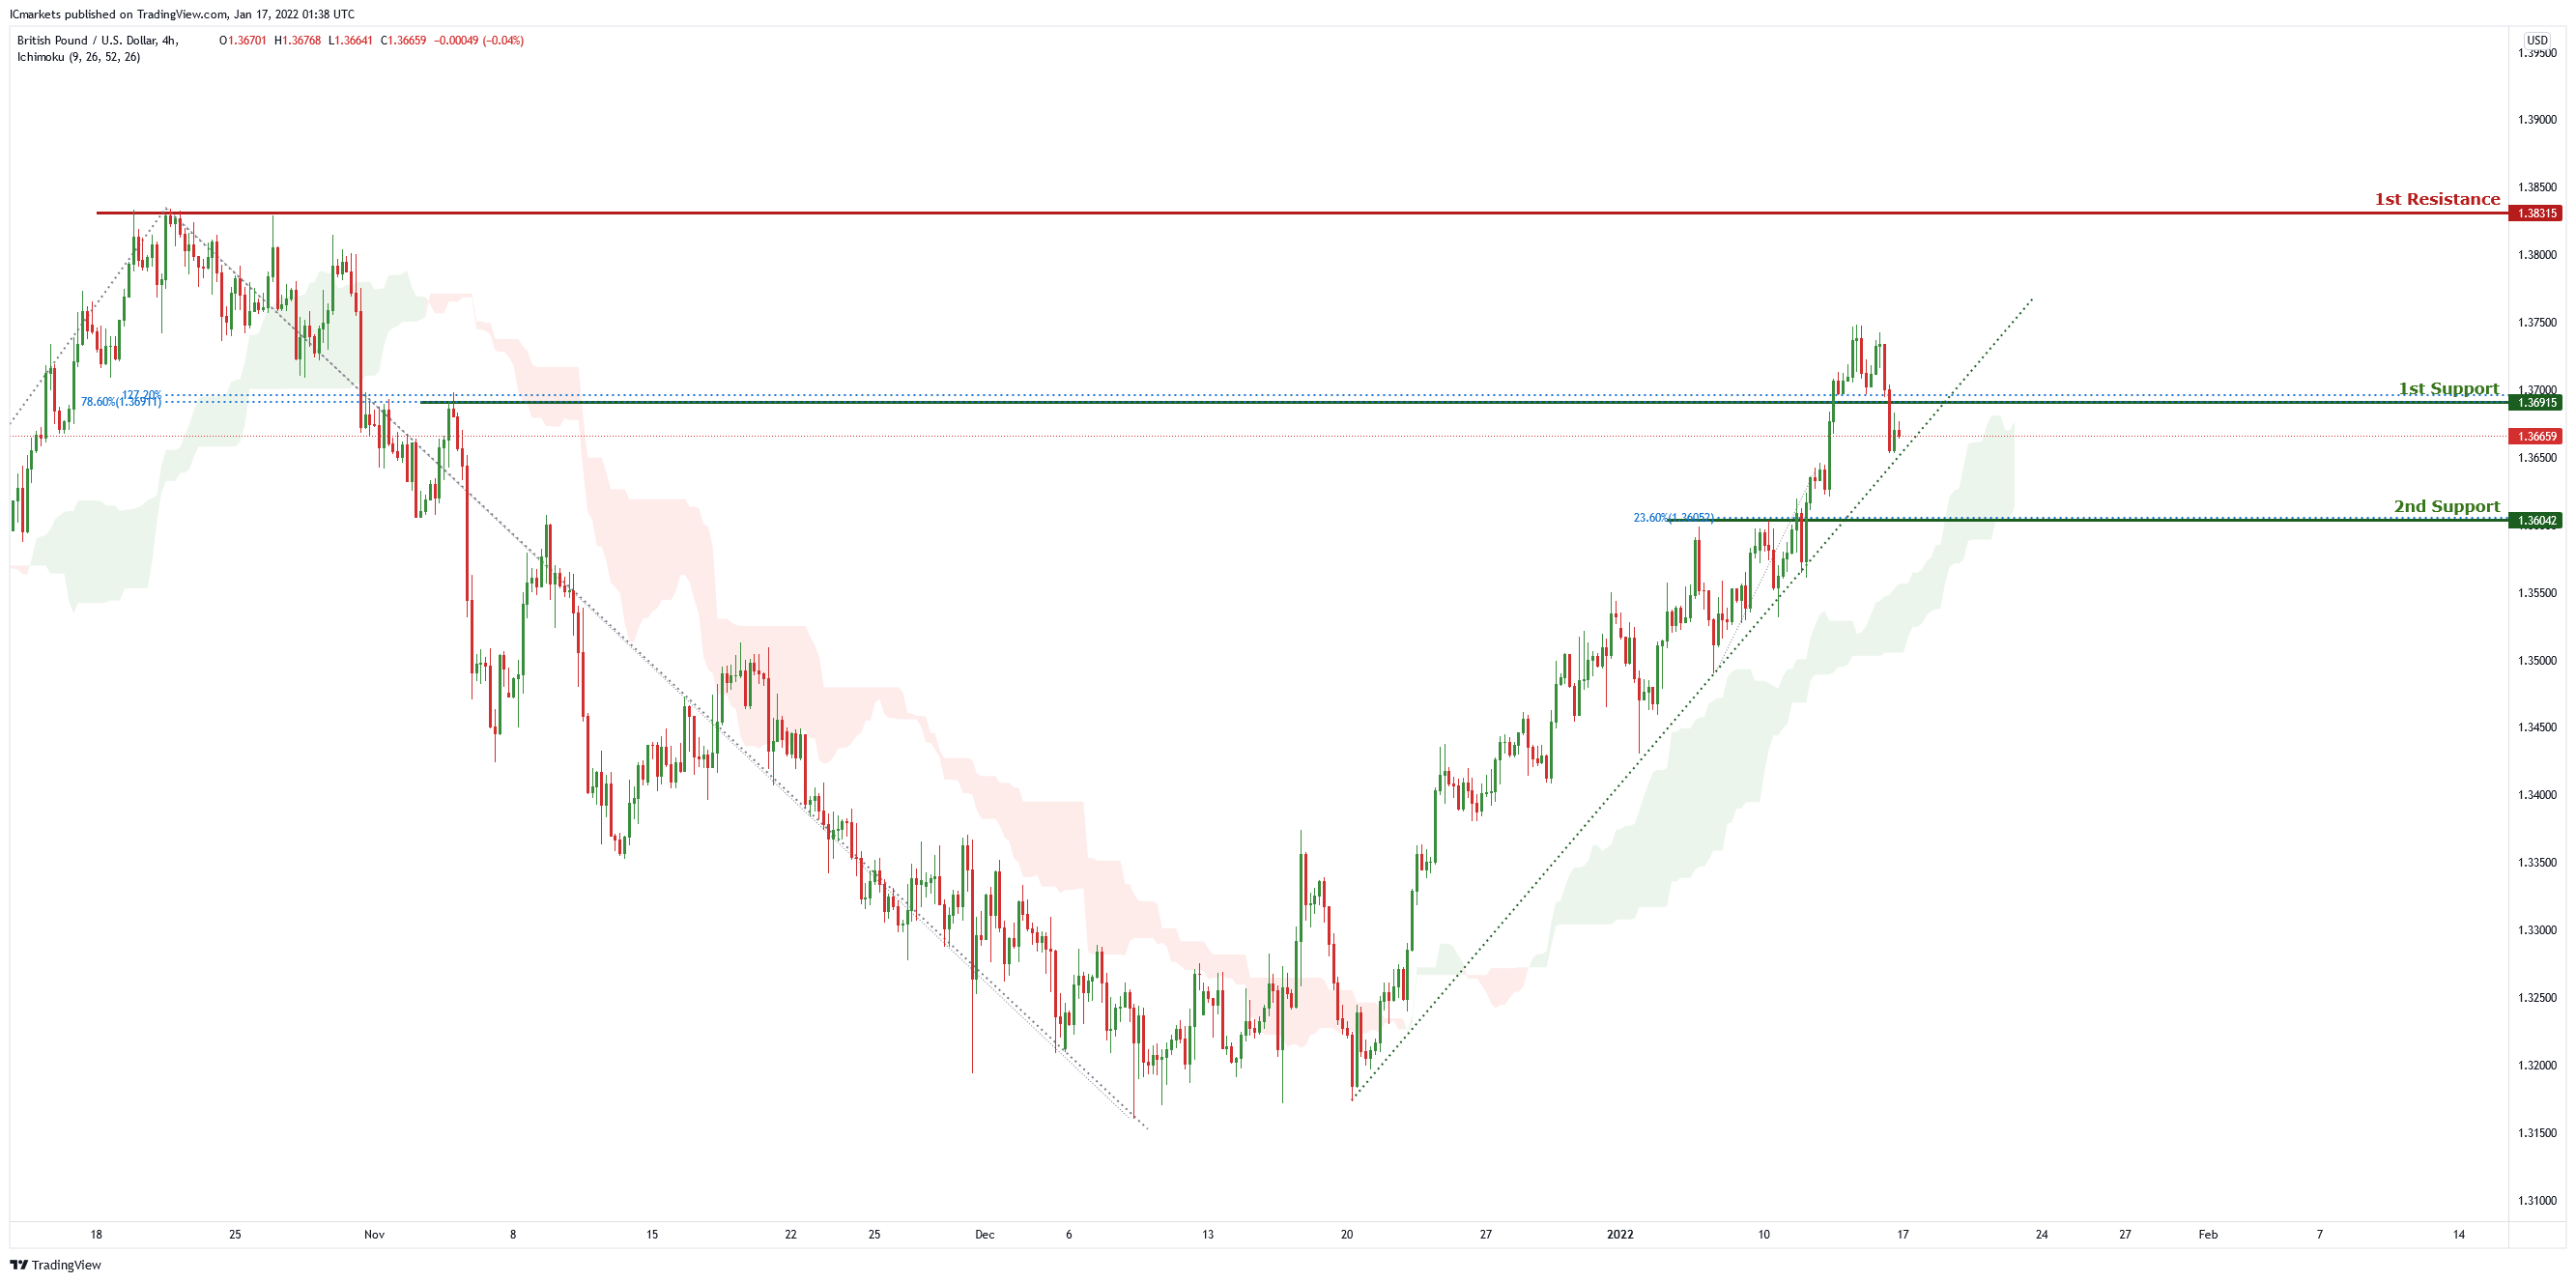
On the H4 chart price is abiding by an ascending trendline and near the first support level of 1.36915 which is also 78.6%% Fibonacci retracement and 127.2% Fibonacci projection . Price can potentially go to the 1st resistance level of 1.38315 which is the graphical swing high level. Our bullish bias is supported by the ichimoku cloud indicator as price is trading above it.
Areas of consideration:
- H4 1st resistance at 1.38315
- H4 1st support 1.36915
USD/CHF
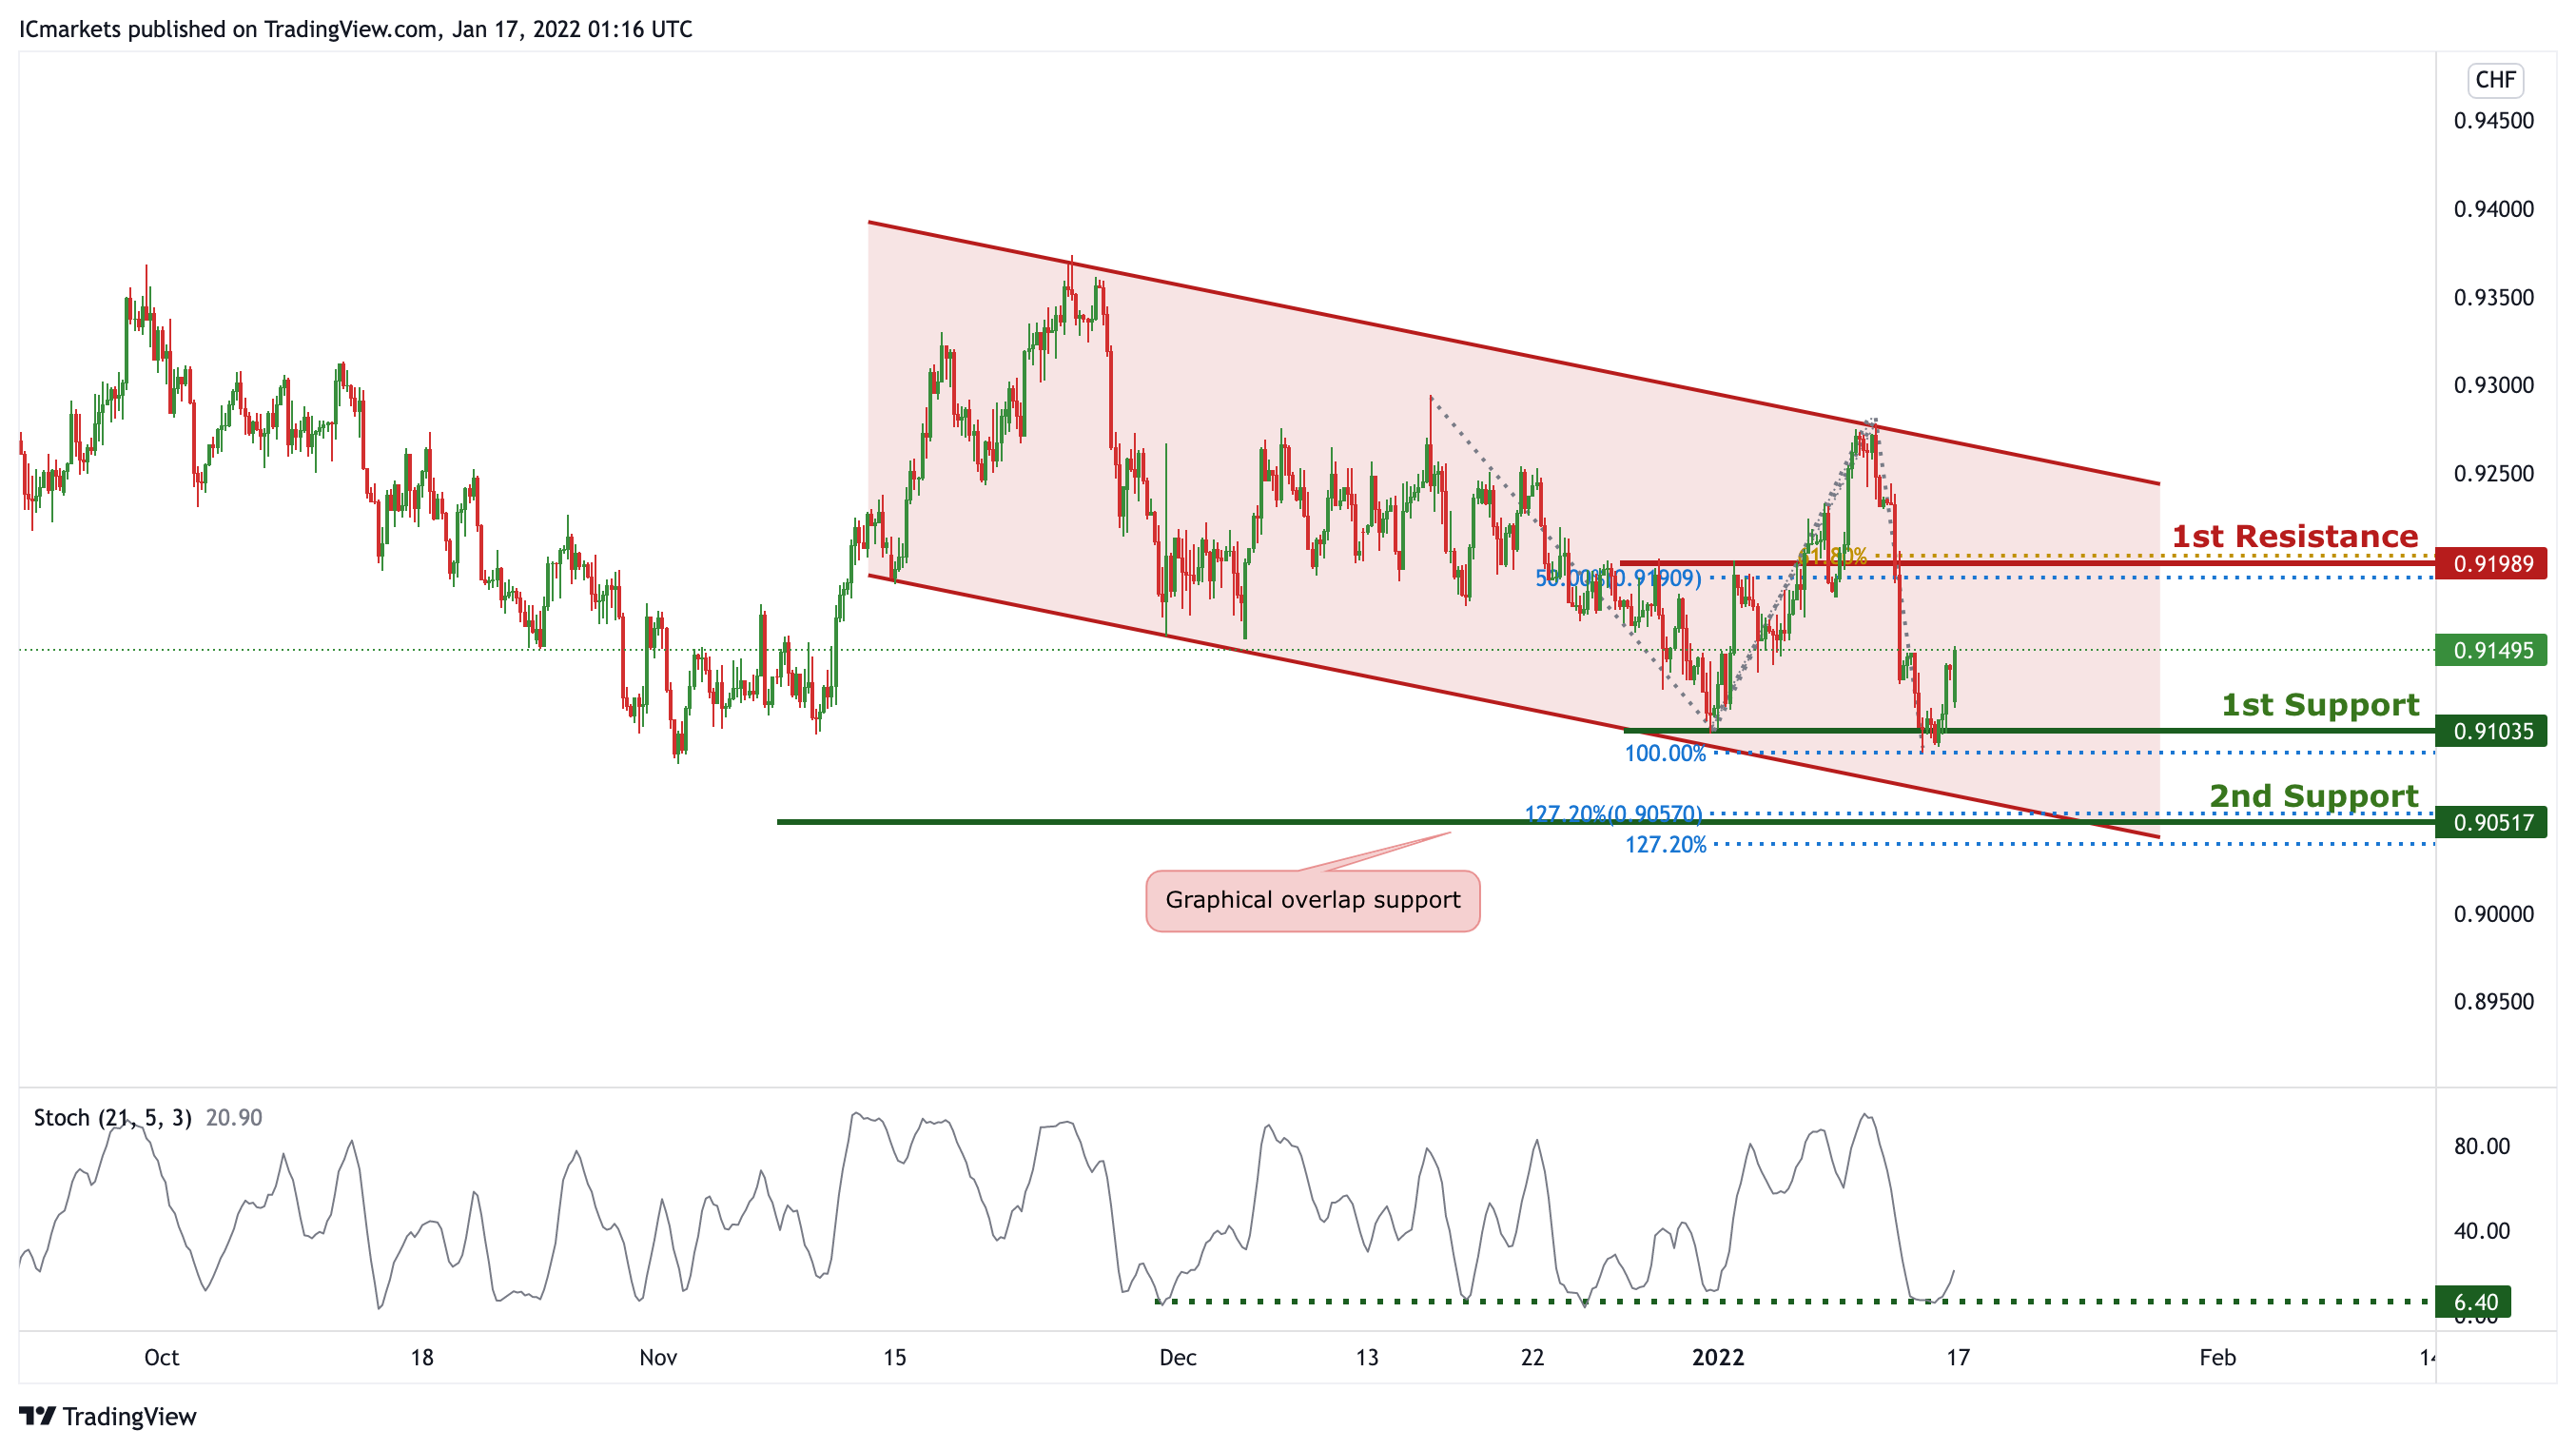
On the H4 timeframe, price is abiding to a descending channel, signifying a bearish momentum. Price is approaching a support level, we can expect price to make a short-term bullish bounce in line with 78.6% Fibonacci Projection and 161.8% Fibonacci retracement towards 1st Resistance in line with 78.6% Fibonacci projection. Our short-term bullish bias is further supported by the stochastic indicator where the %K line is approaching the support level.
Areas of consideration:
- Watch 1st Support at 0.91113
- Watch 1st Resistance at 0.92698
EUR/USD :
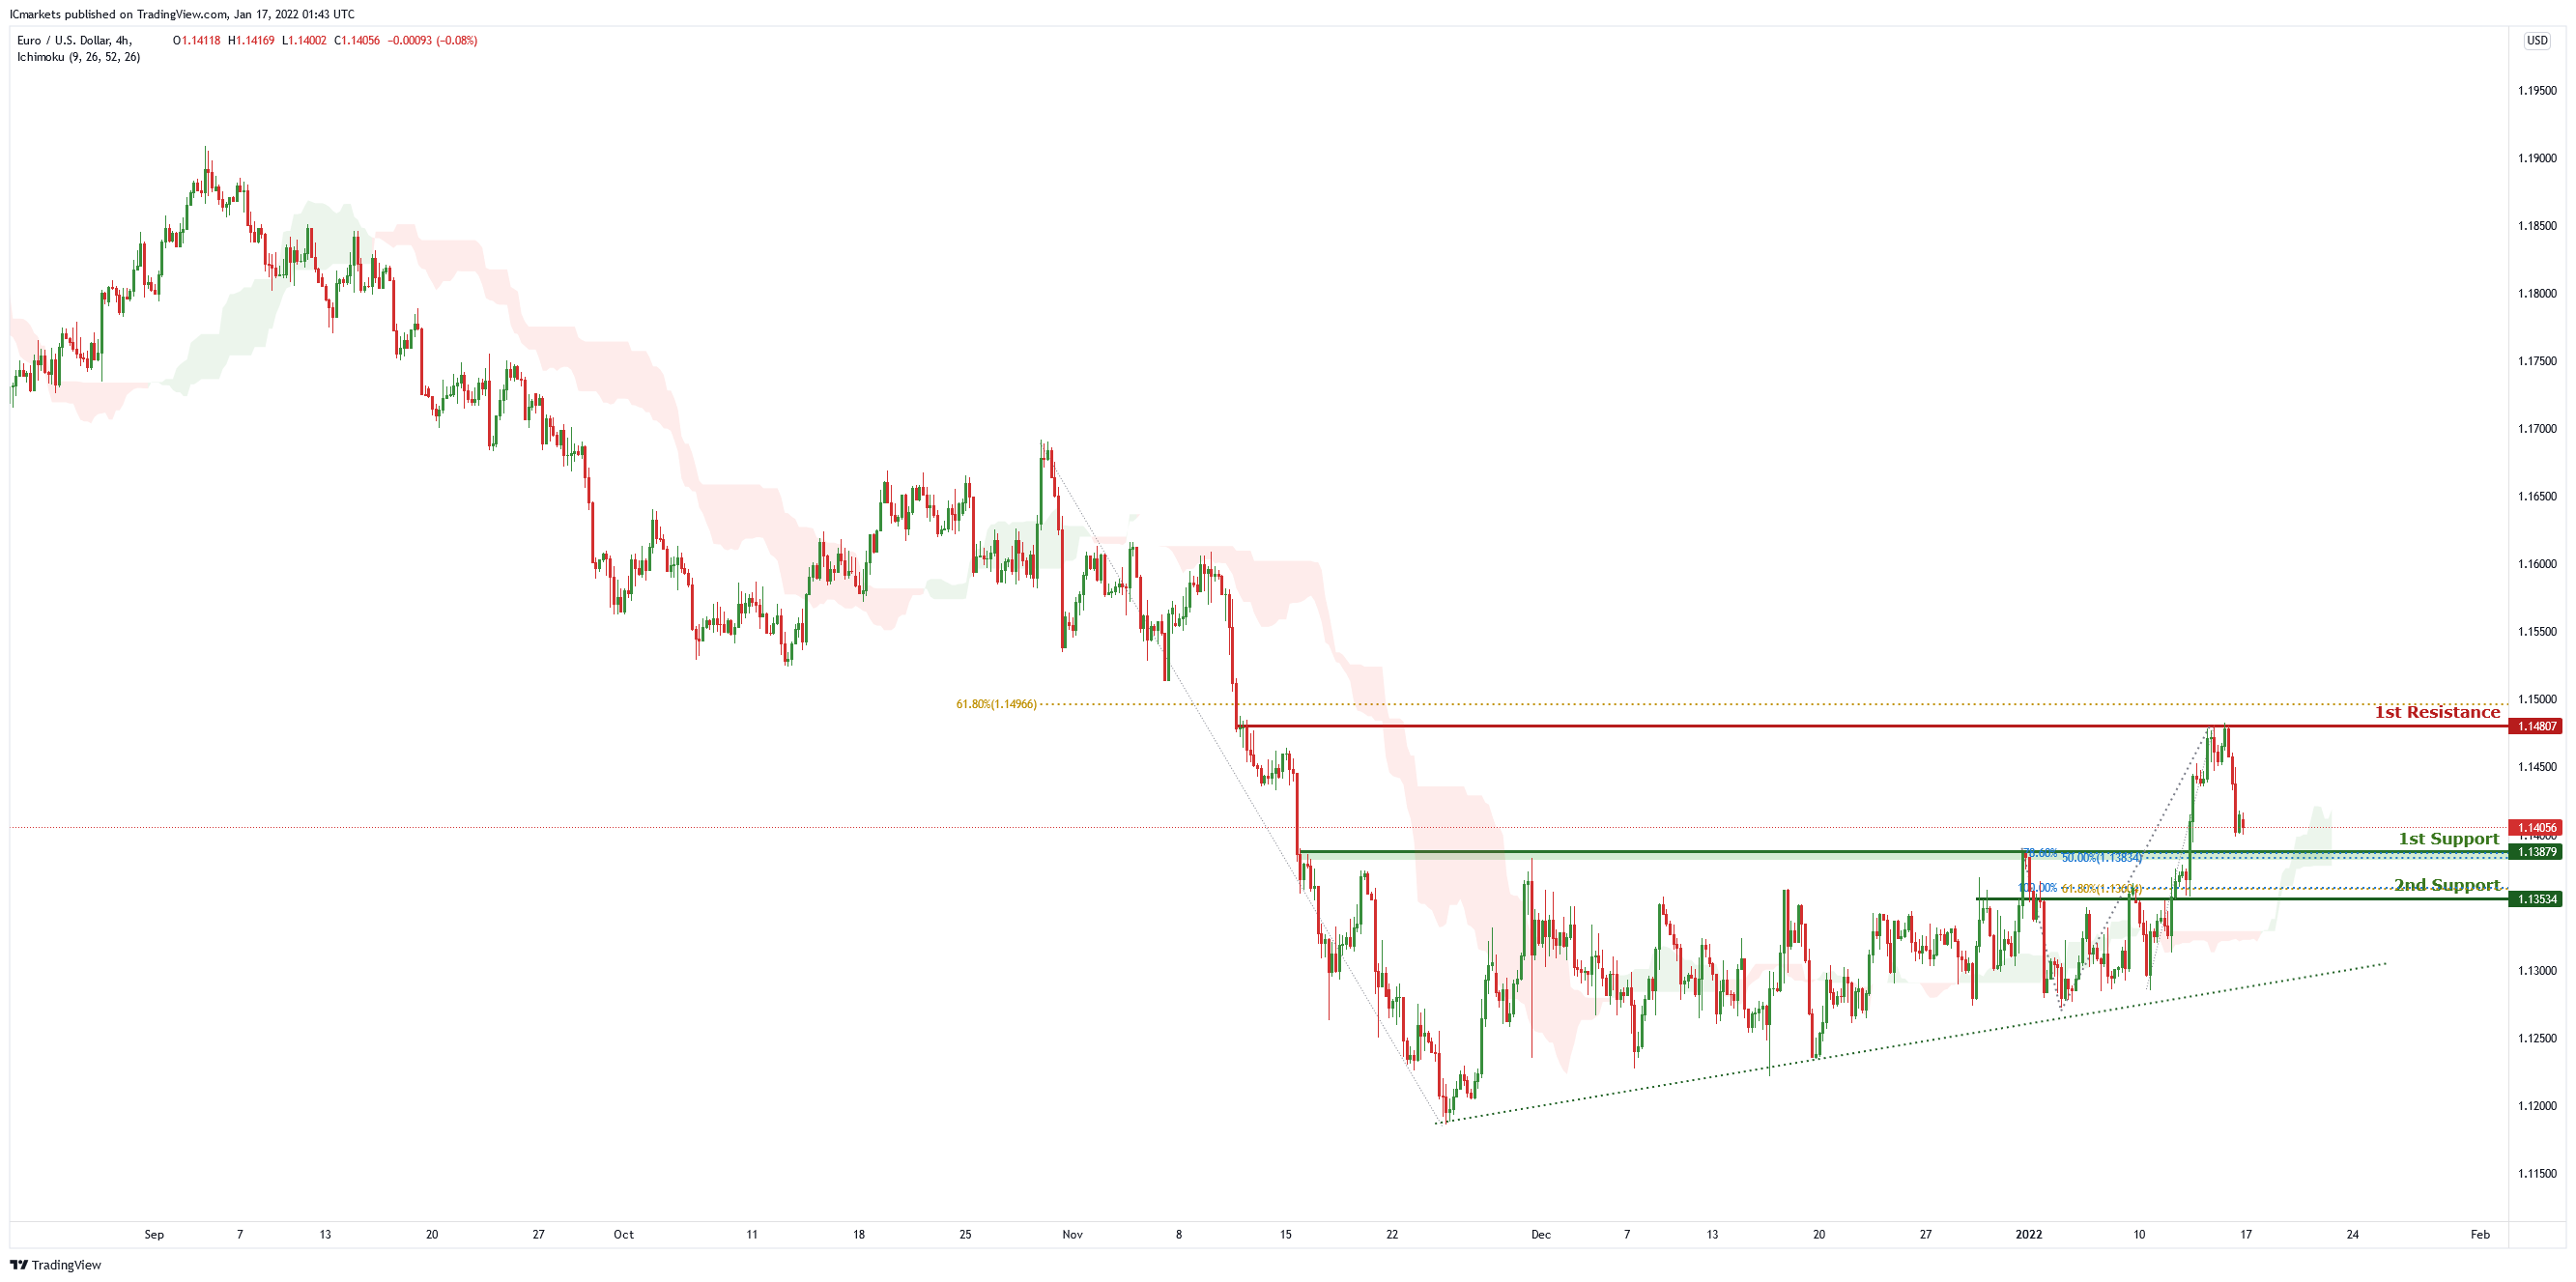
On the H4 chart , price is abiding by an ascending trendline and is near 1st support level of 1.13879 which is also 78.6% Fibonacci projection and 50% Fibonacci retracement. Price can potentially go to the 1st resistance level of 1.14807 which is also 61.8% Fibonacci retracement. Our bullish bias is supported by the ichimoku cloud indicator as price is trading above it.
Areas of consideration:
- H4 1st resistance at 1.14807
- H4 1st support at 1.13879
USD/JPY:
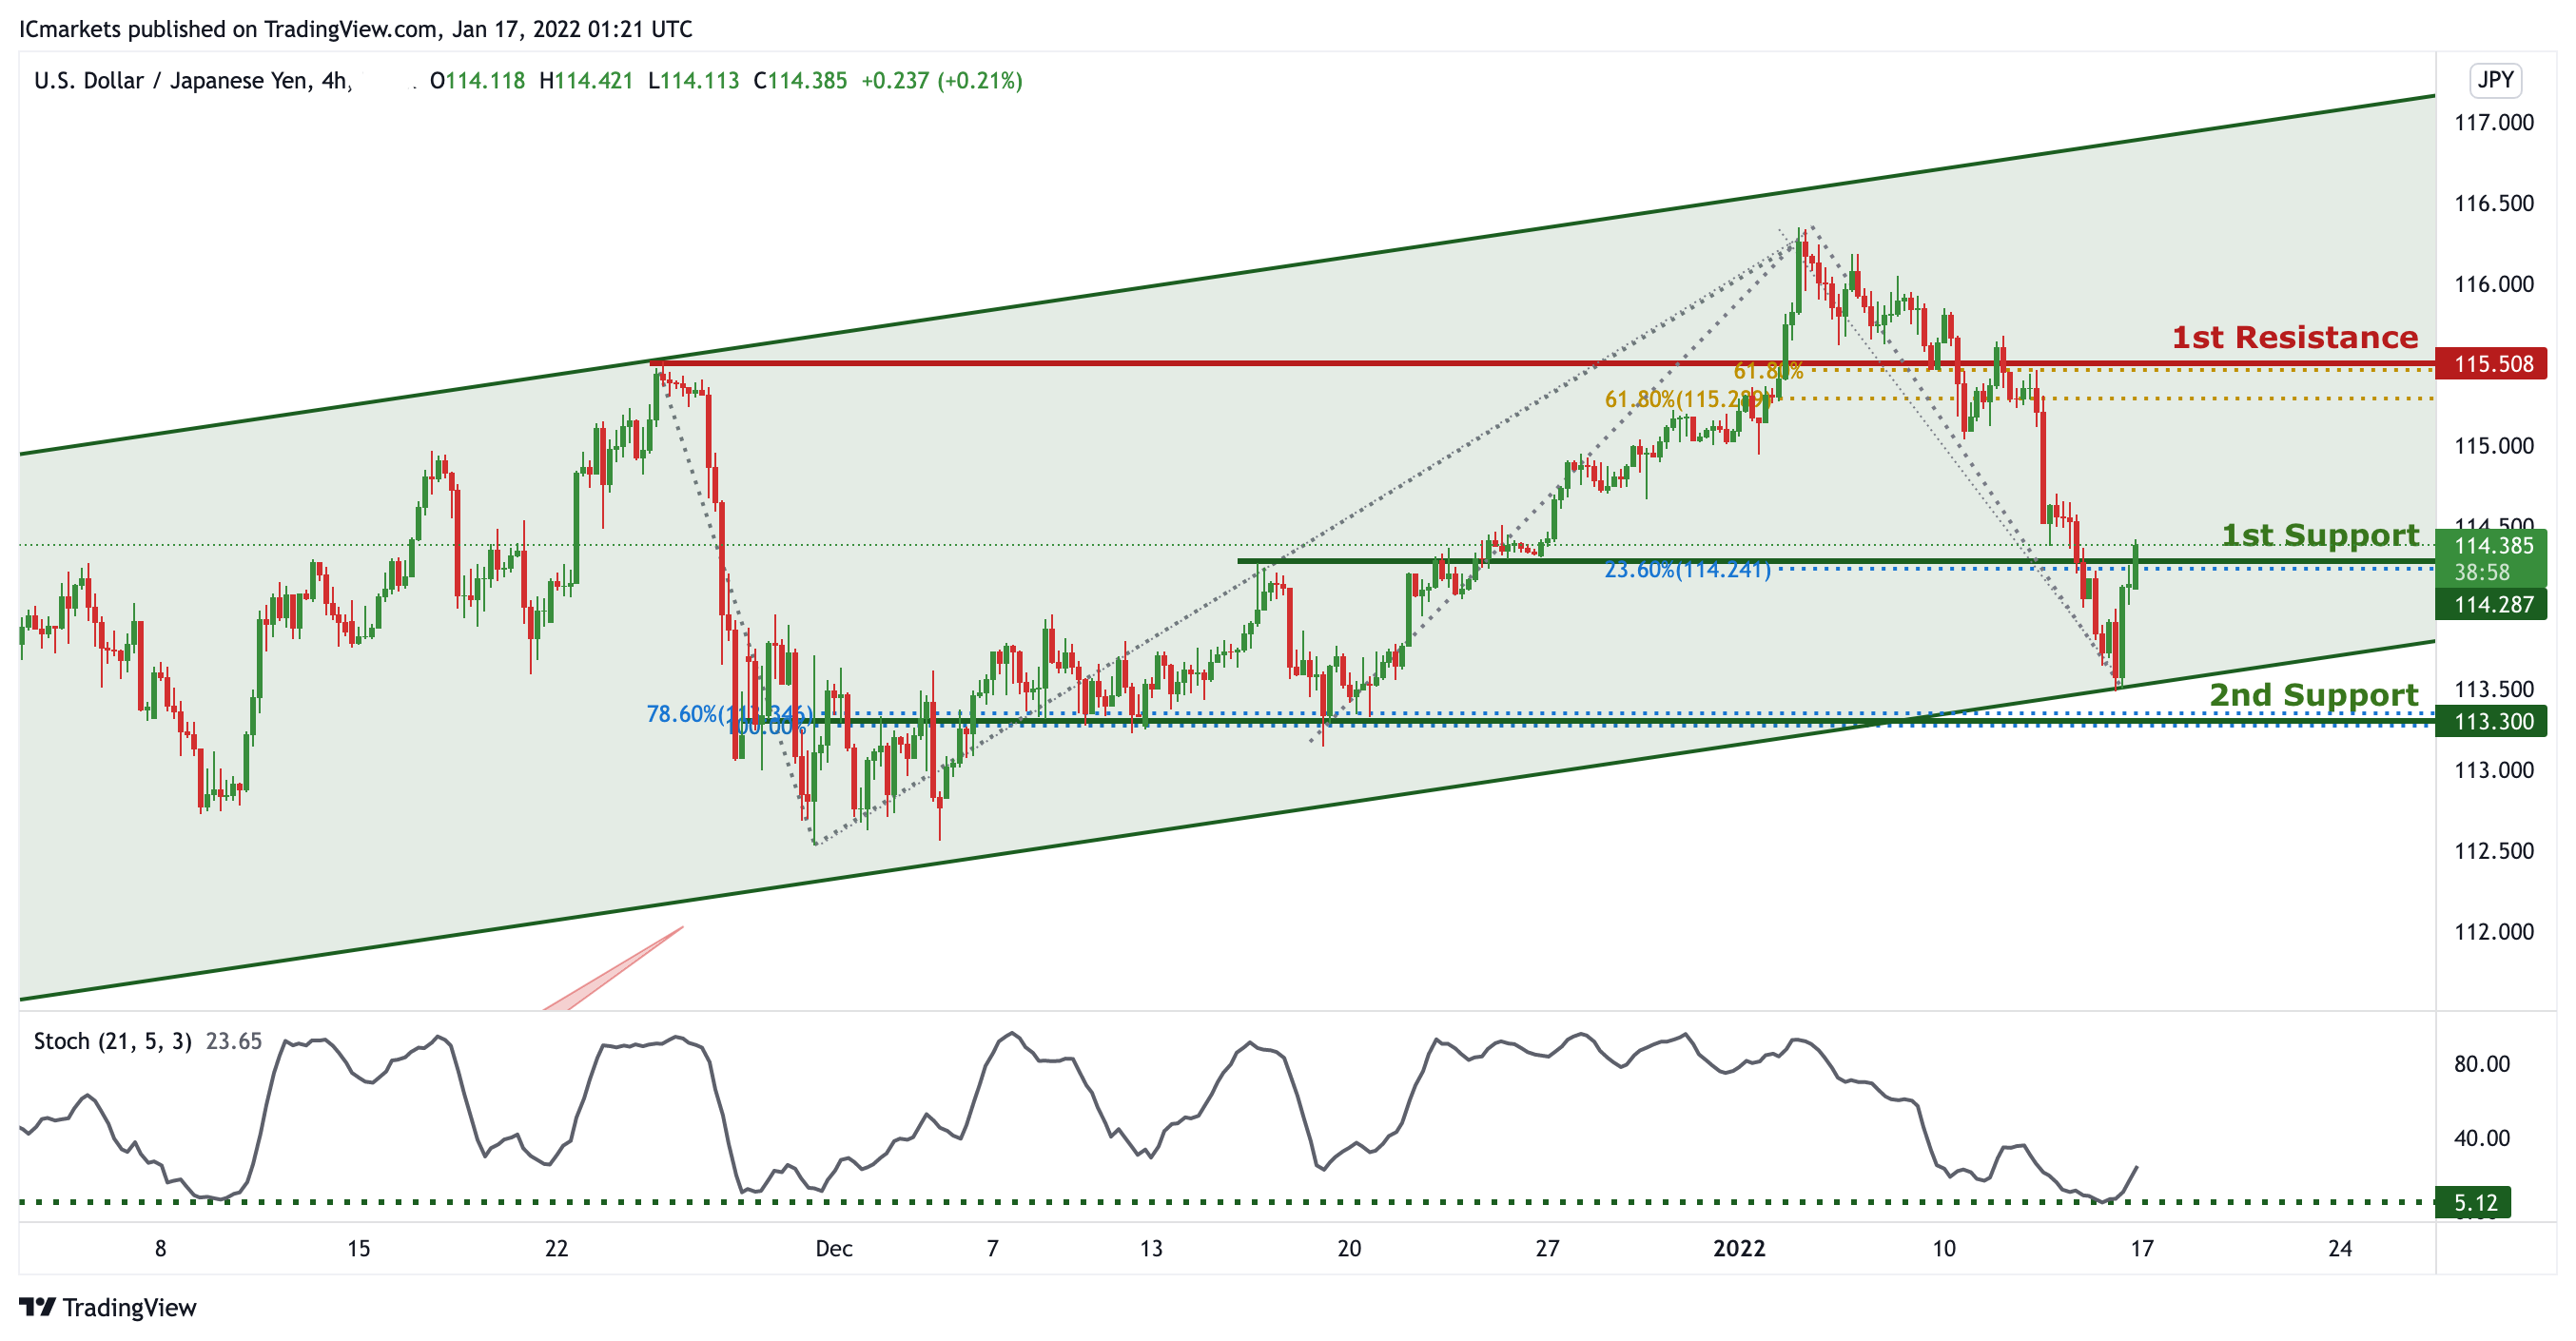
In reference to last week’s analysis, price indeed bounced at previous 1st Support. On the H4 timeframe, is abiding to the ascending channel on the daily, signifying an overall bullish momentum. We can now expect price to push higher from 1st Support in line with 23.6% Fibonacci retracement and graphical overlap support towards 1st Resistance in line with 61.8% Fibonacci projection and 61.8% Fibonacci retracement. Our bullish bias is further supported by the stochastic indicator where the %K line is at the support level.
Areas of consideration:
- H4 1st resistance level 115.508
- H4 1st support level 114.287
AUD/USD:
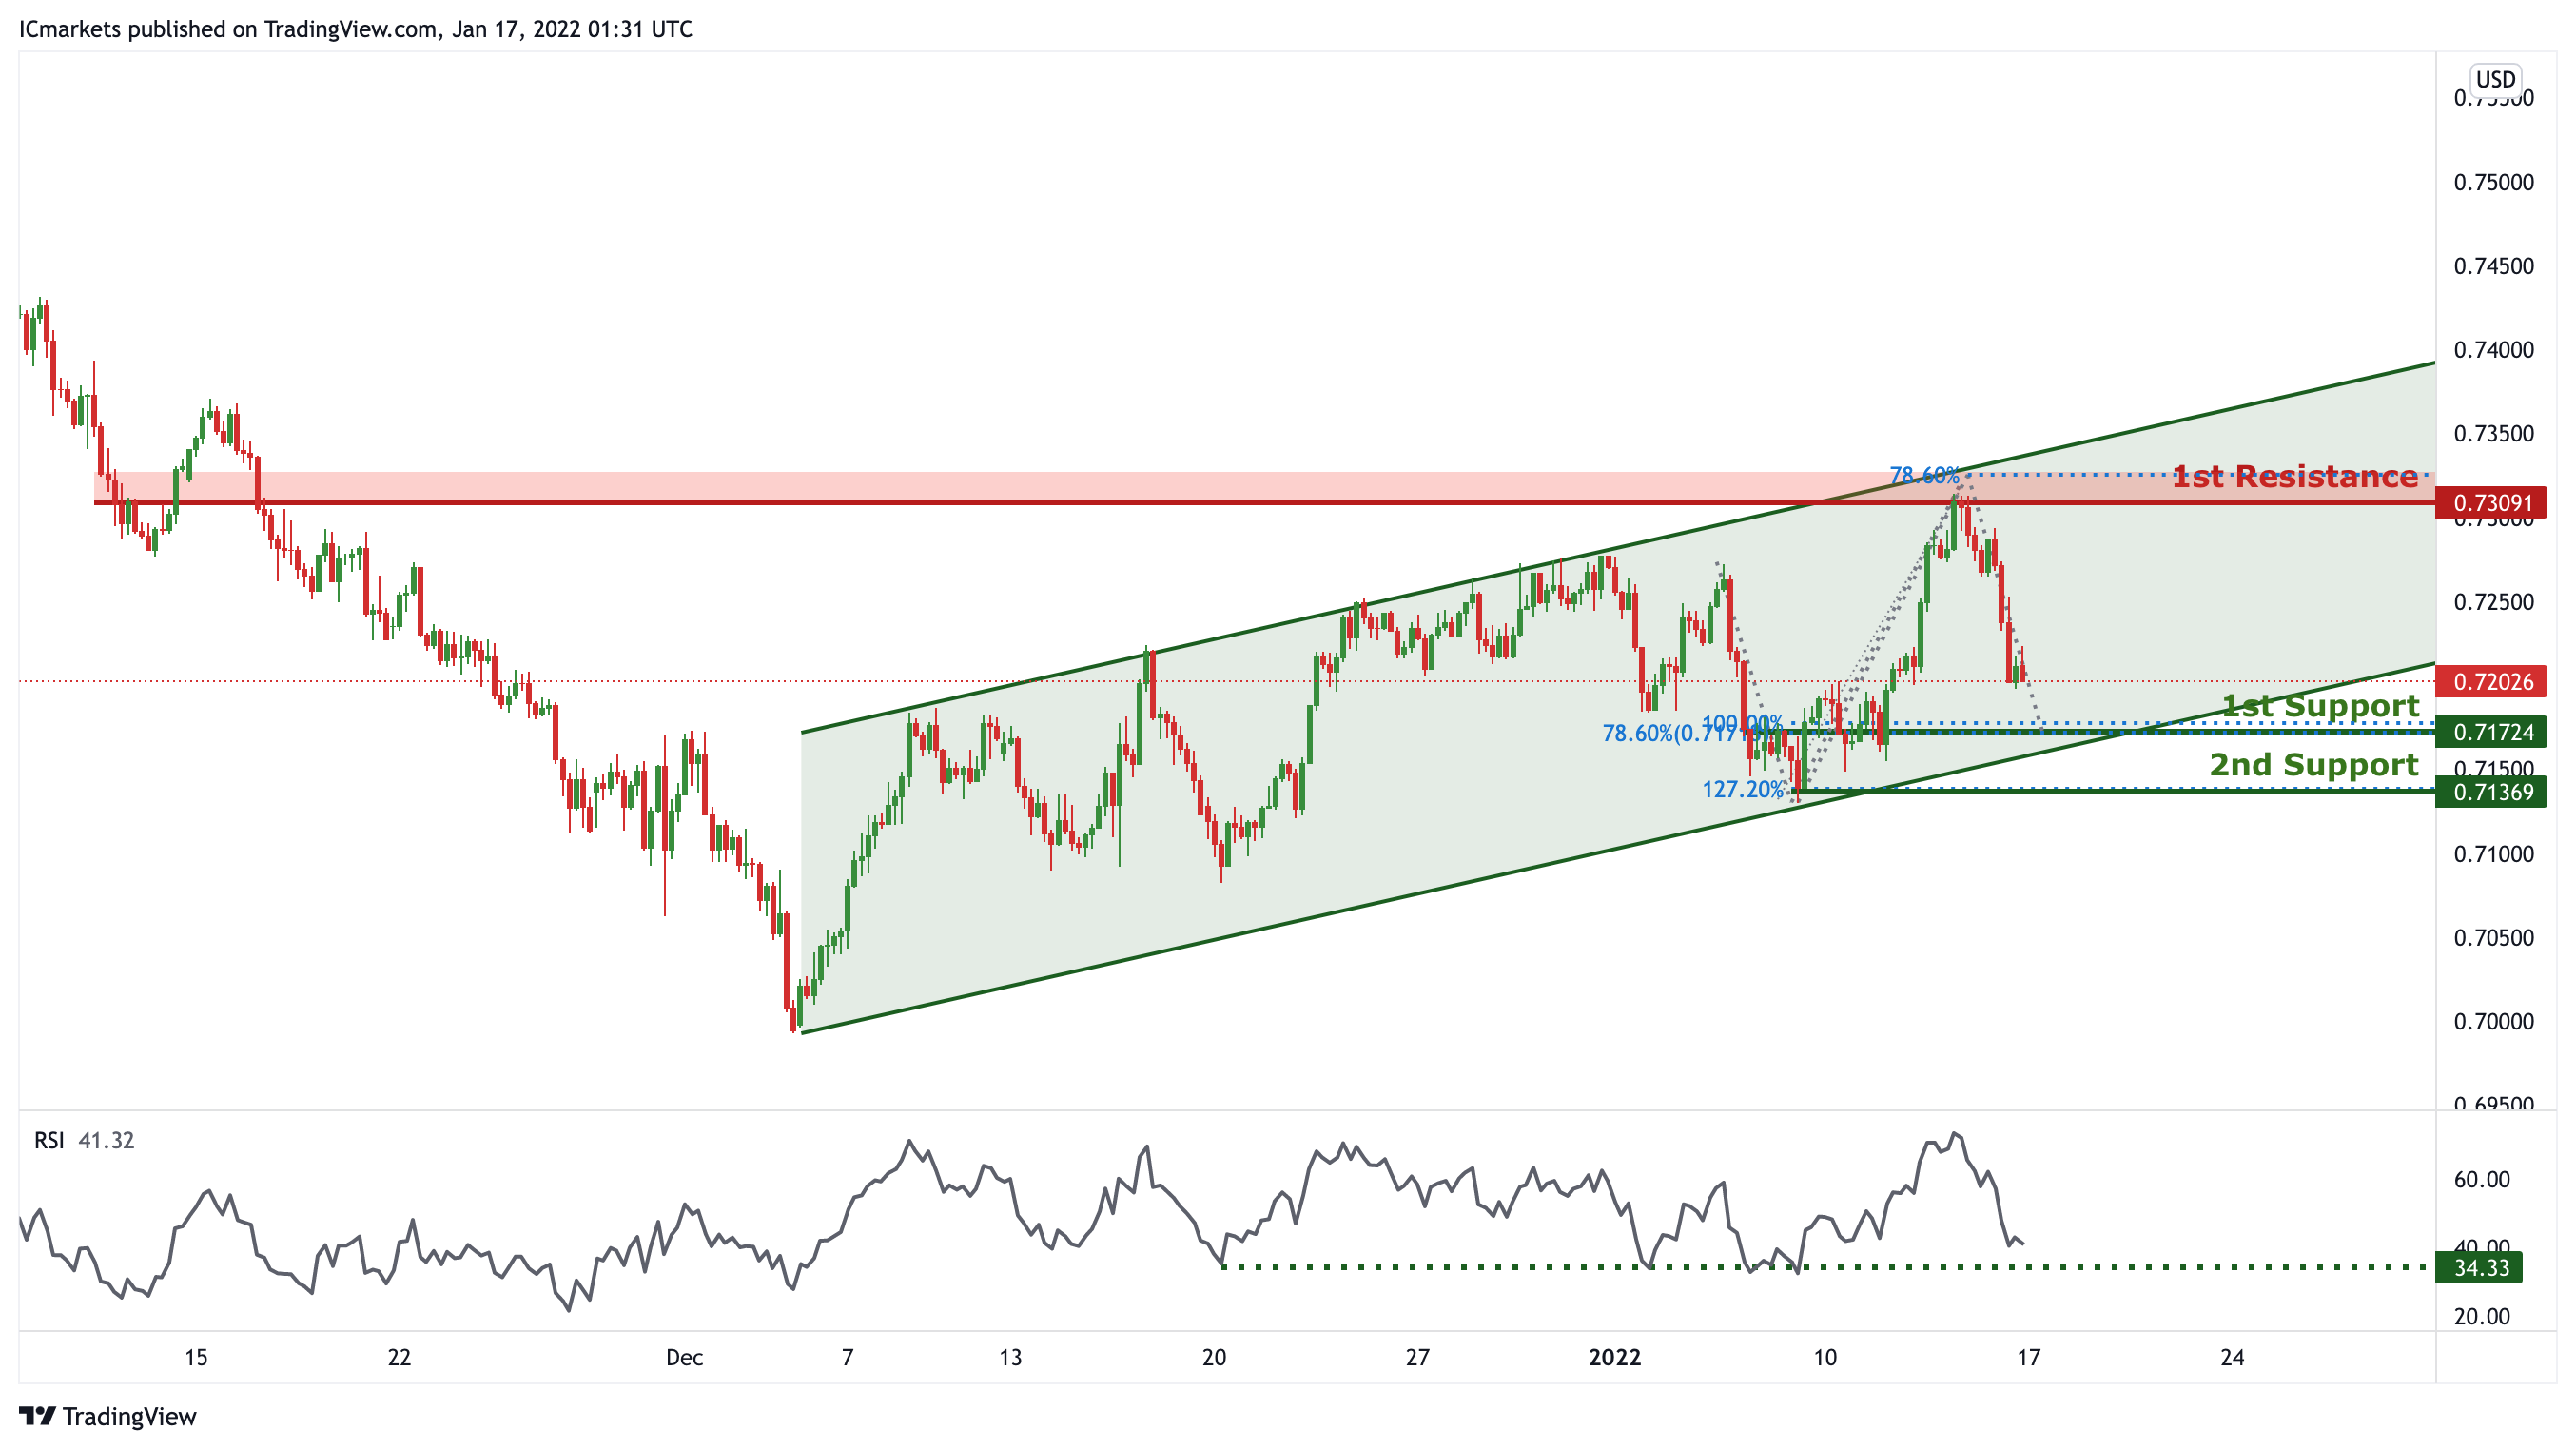
In reference to last week’s analysis, price indeed dropped to 1st Support @ 0.72023. On the H4, price is reacting within the ascending channel, signifying an overall bullish momentum. Price is approaching the 1st Support, we can expect to see price make a bullish bounce from 1st Support in line with 100% Fibonacci projection, 78.6% Fibonacci retracement and ascending channel support towards 1st Resistance in line with previous swing high and 78.6% Fibonacci projection. Our short-term bearish bias is further supported by the RSI indicator where it is approaching the support level.
Areas of consideration:
- H4 1st Support level 0.71724
- H4 1st resistance level 0.73091
NZD/USD:
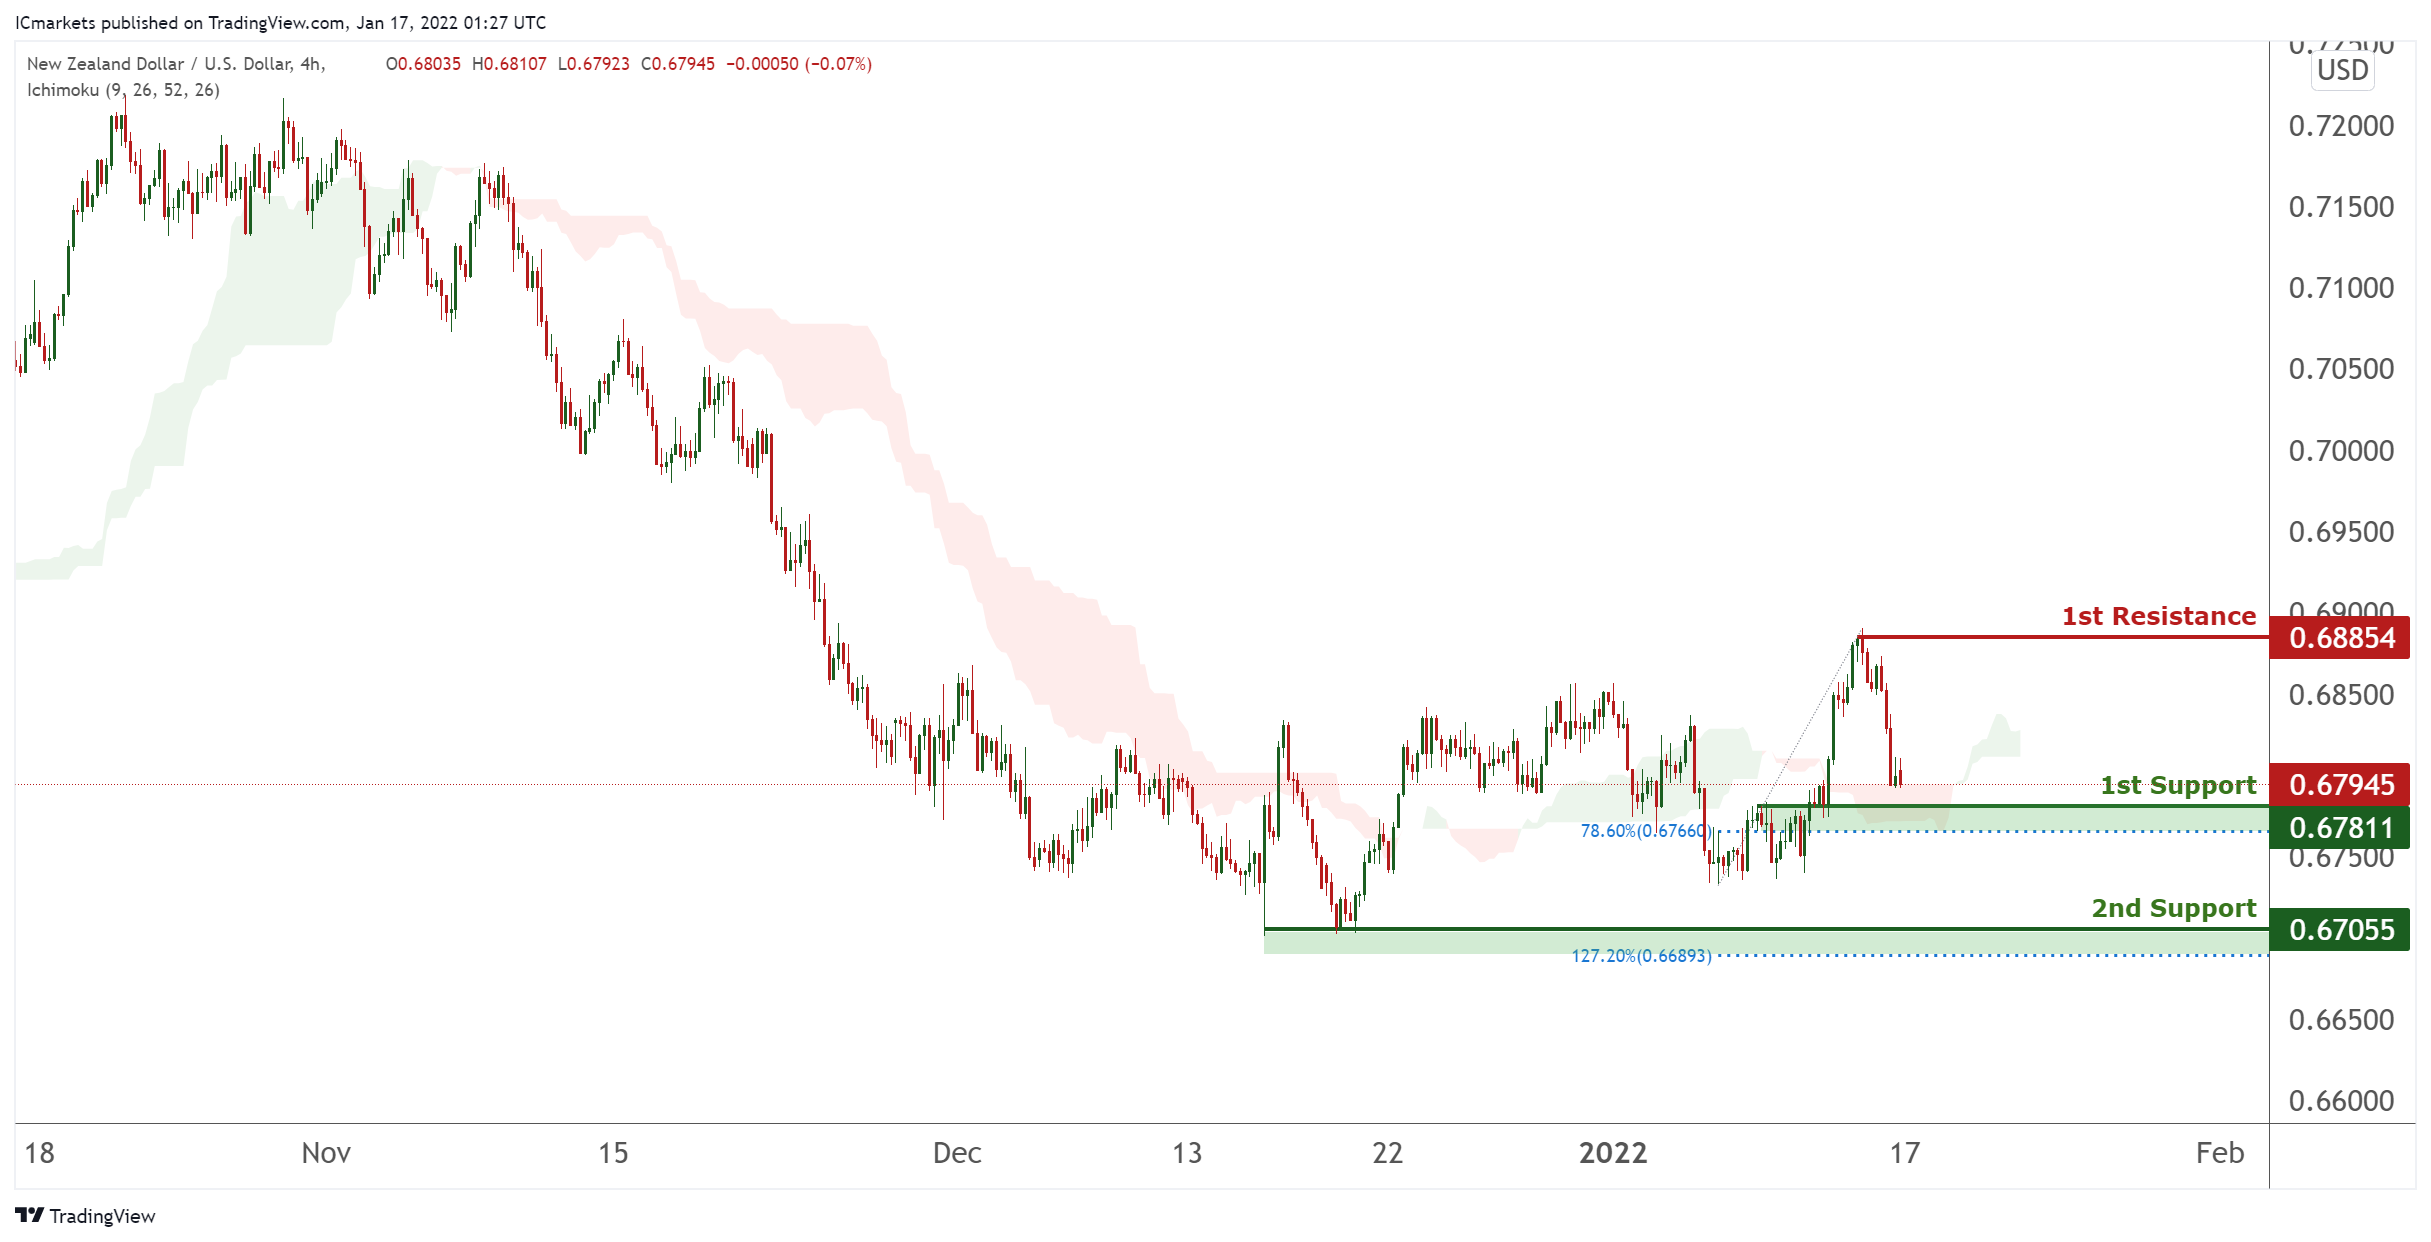
On the H4, with price moving above the ichimoku cloud, we have a bullish bias that price will rise to our 1st resistance at 0.68854 which is in line with horizontal swing high resistance from 1st support at 0.67811, which is in line with horizontal overlap support and 78.6% Fibonacci retracement level. Alternatively, price may break 1st support structure and head for 2nd support at 0.67055, which coincides with horizontal swing low support and 127.2% Fibonacci extension level .
Aras of consideration:
- H4 time frame, 1st resistance at 0.68854
- H4 time frame, 1st support at 0.67811
USD/CAD:
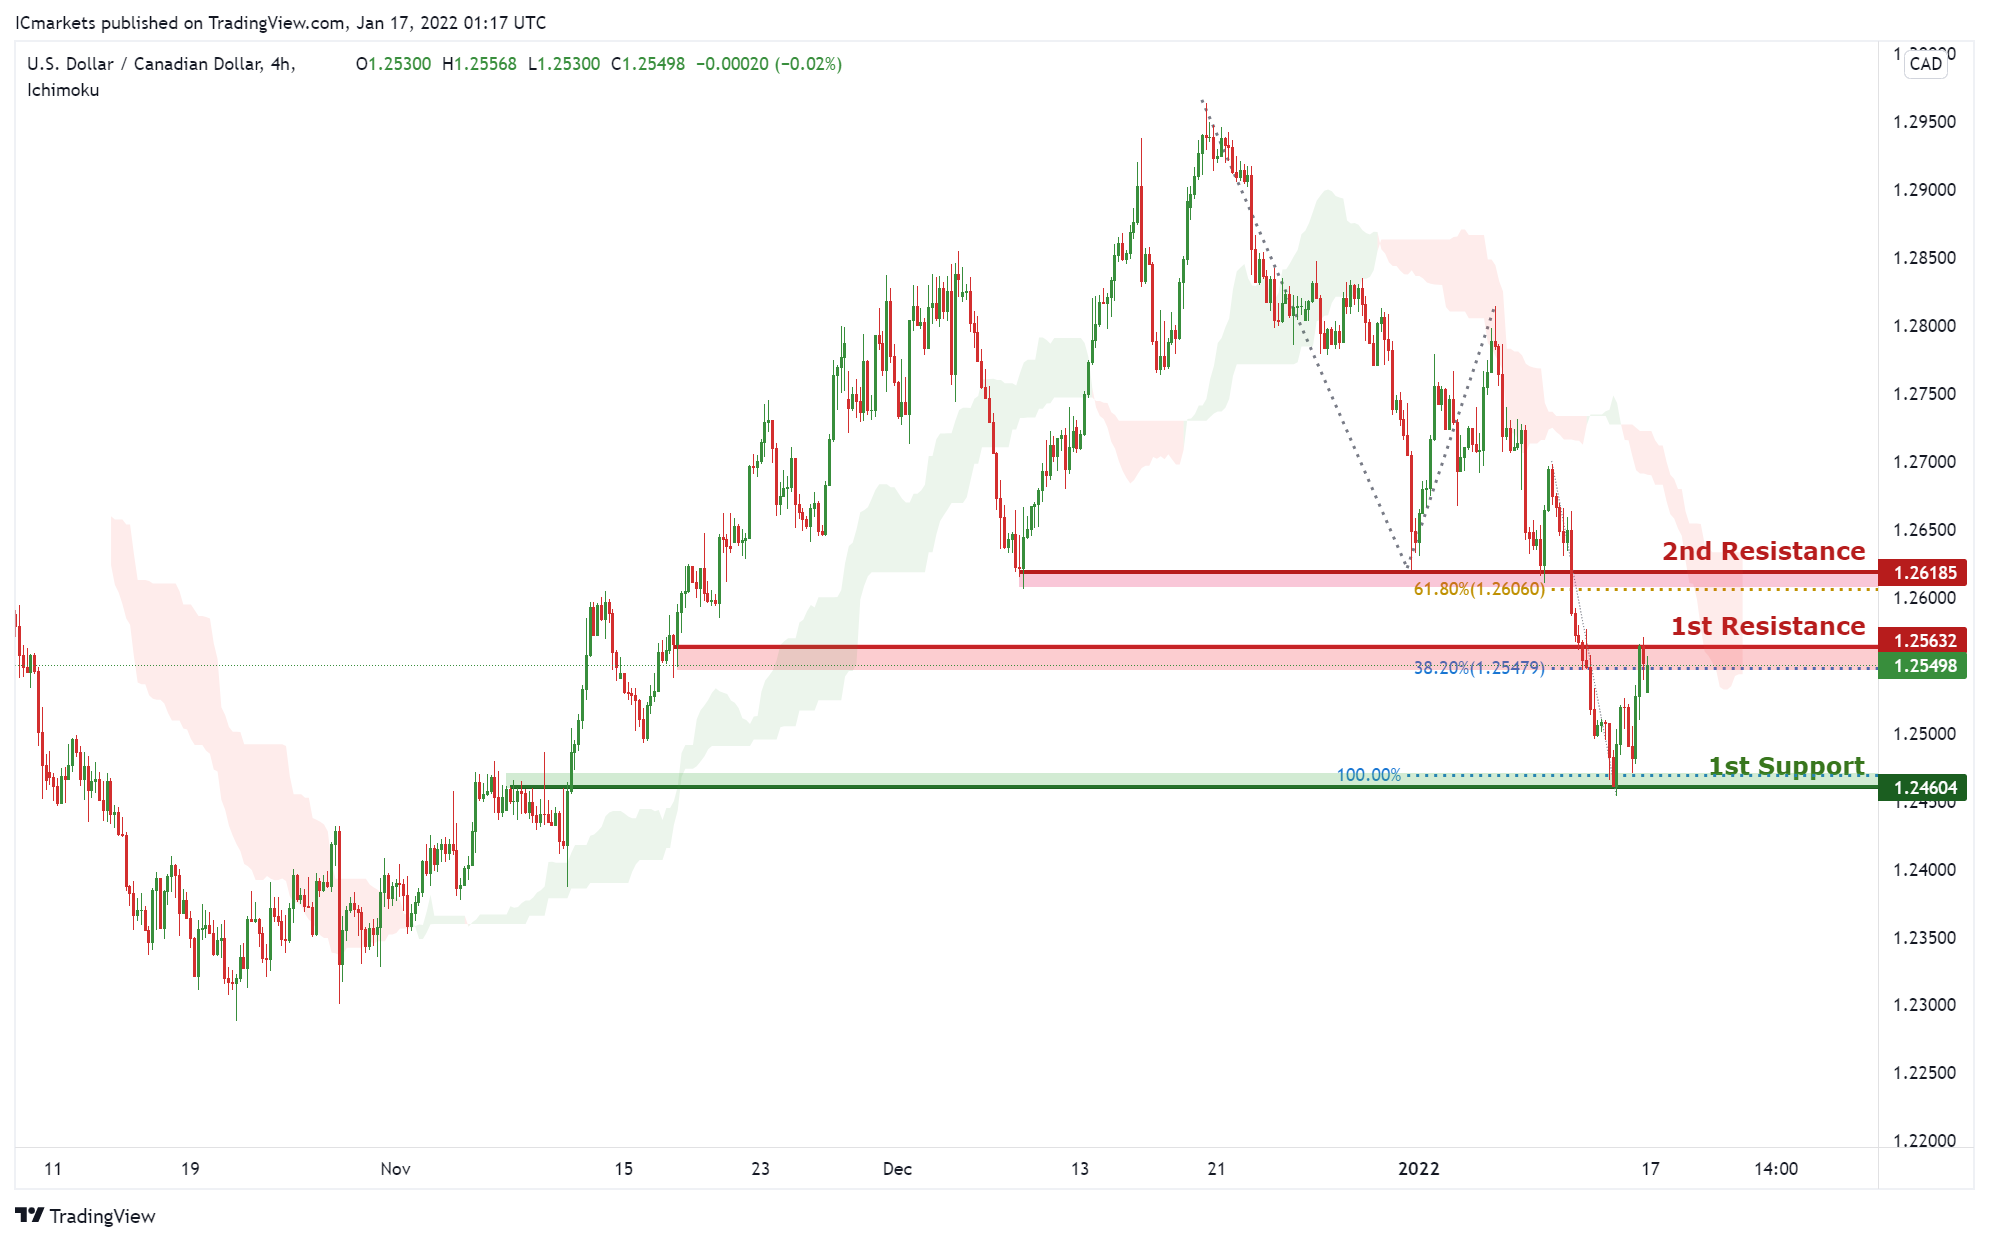
On the H4, with price moving below the ichimoku cloud, we have a bearish bias that price will from from our 1st resistance at 1.25632 which is in line with horizontal overlap resistance and 38.2% Fibonacci retracement to 1st support at 1.24604, which is in line with horizontal overlap support and 100% Fibonacci projection level. Alternatively, price may break 1st resistance structure and head for 2nd resistance at 1.26185, which coincides with horizontal overlap resistance and 61.8% Fibonacci retracement.
Areas of consideration:
- H4 time frame, 1st support at 1.24604
- H4 time frame, 1st resistance at 1.25479
OIL:
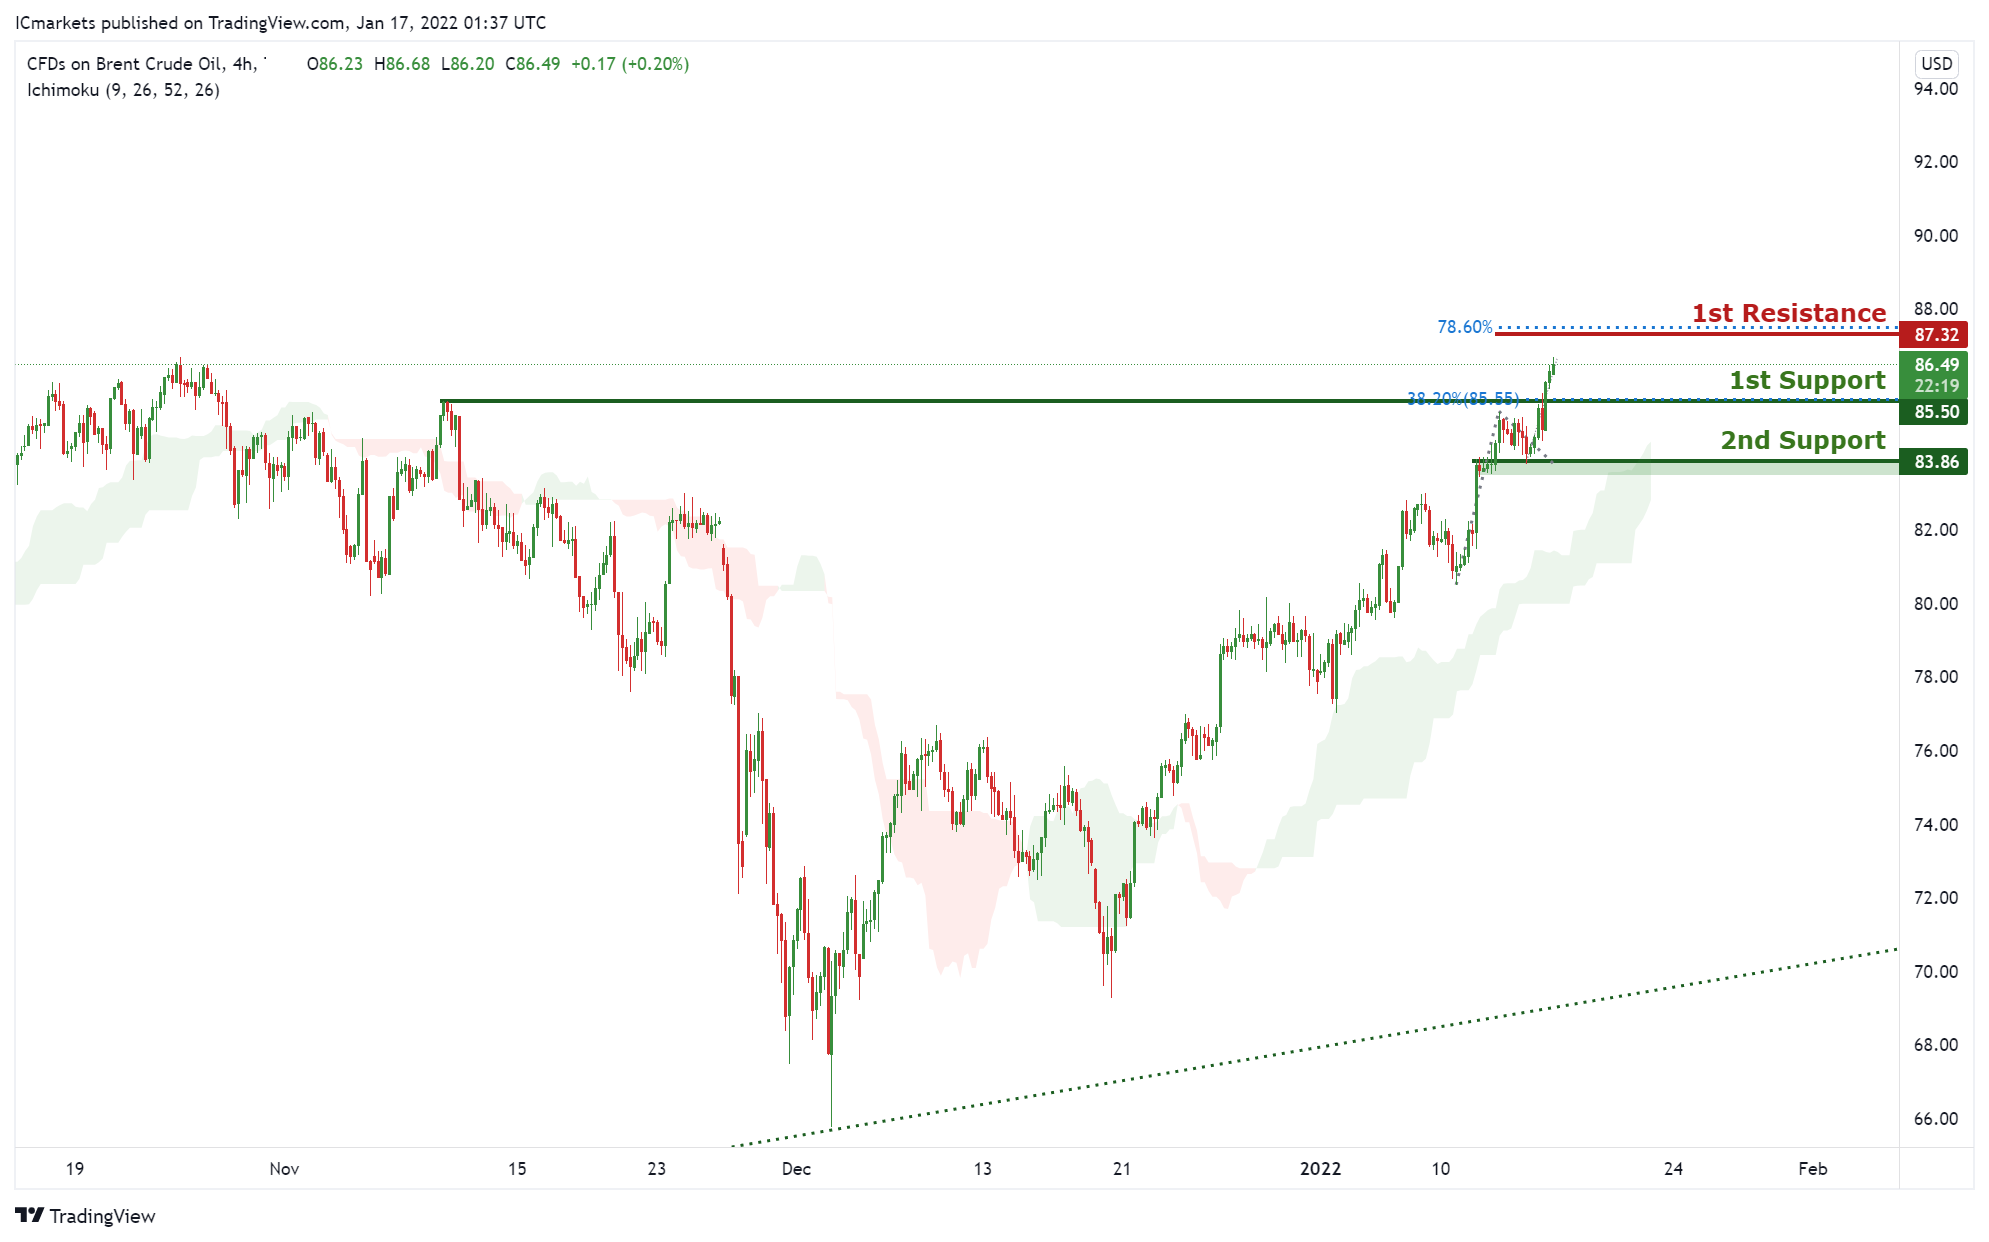
On the H4, with price moving above the ichimoku cloud, we have a bullish bias that price will rise to our 1st resistance at 87.32 which is in line with horizontal swing high resistance and 78.6% Fibonacci projection level from 1st support at 85.5, which is in line with horizontal overlap support and 38.2% Fibonacci retracement level. Alternatively, price may break 1st support structure and head for 2nd support at 83.86, which coincides with horizontal overlap support.
Areas of consideration:
- H4 time frame, 1st resistance of 87.32
- H4 time frame, 1st support of 85.5
Dow Jones Industrial Average:
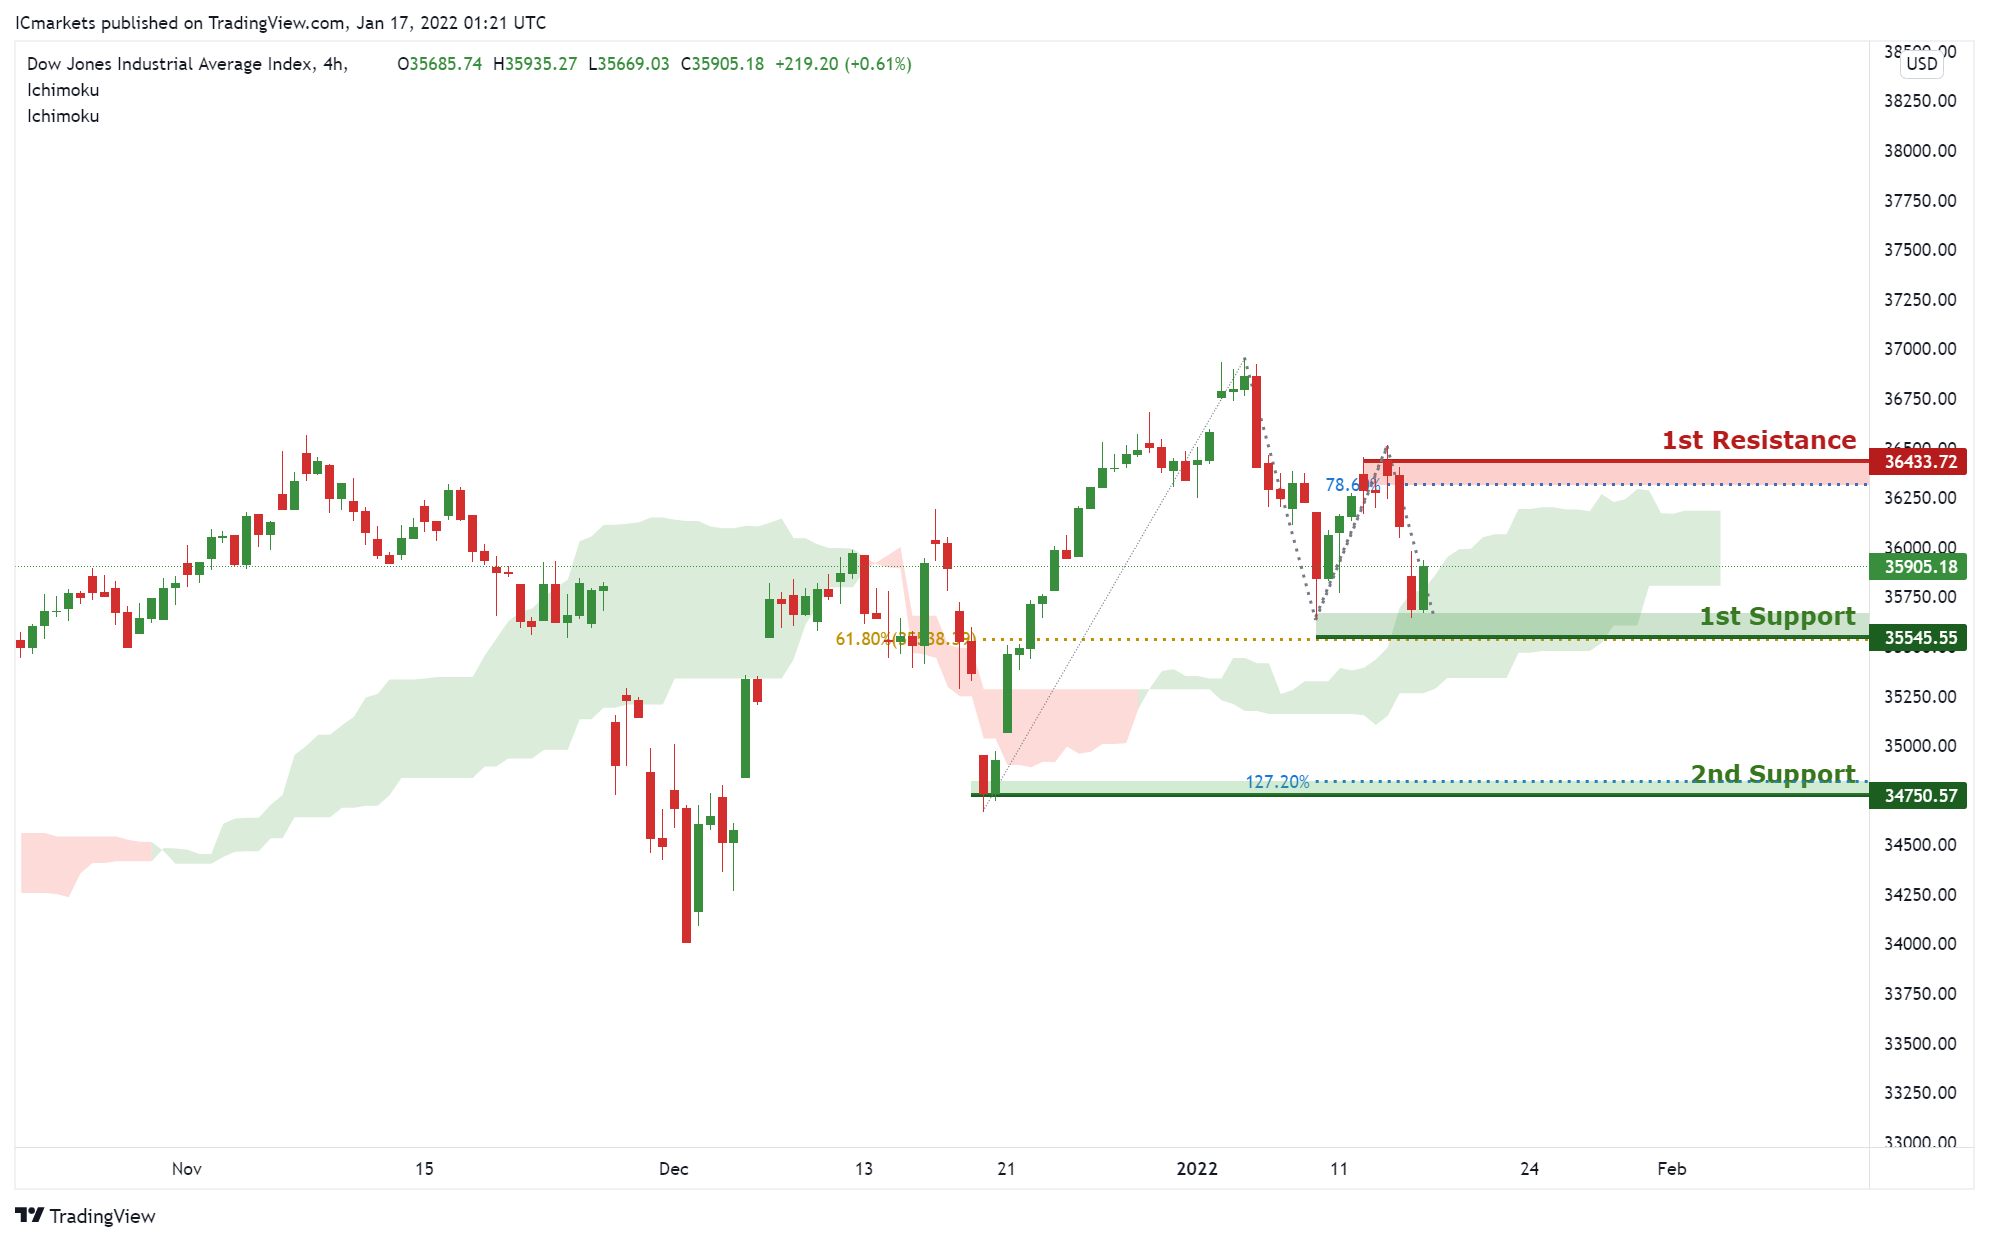
On the H4, with price moving above the ichimoku cloud, we have a bullish bias that price will rise to our 1st resistance at 36433 which is in line with horizontal swing high resistance and 78.6% Fibonacci retracement level from 1st support at 35545, which is in line with horizontal swing low support and 61.8% Fibonacci retracement level. Alternatively, price may break 1st support structure and head for 2nd support at 34750, which coincides with horizontal swing low support and 127.2% Fibonacci extension level.
Areas of consideration:
- H4 time frame, 1st resistance of 36433
- H4 time frame, 1st support of 35545
EUR/USD Corrects Gains, Resistance Turned Support
Key Highlights
- EUR/USD rallied after it broke the 1.1400 resistance zone.
- A major bullish trend line is forming with support near 1.1340 on the 4-hours chart.
- GBP/USD rallied above 1.3700 before it faced sellers.
- USD/JPY found support near 113.60 and corrected higher.
EUR/USD Technical Analysis
This past week, the Euro started a major increase after it cleared the 1.1380 resistance against the US Dollar. EUR/USD rallied above 1.1400 to move into a positive zone.
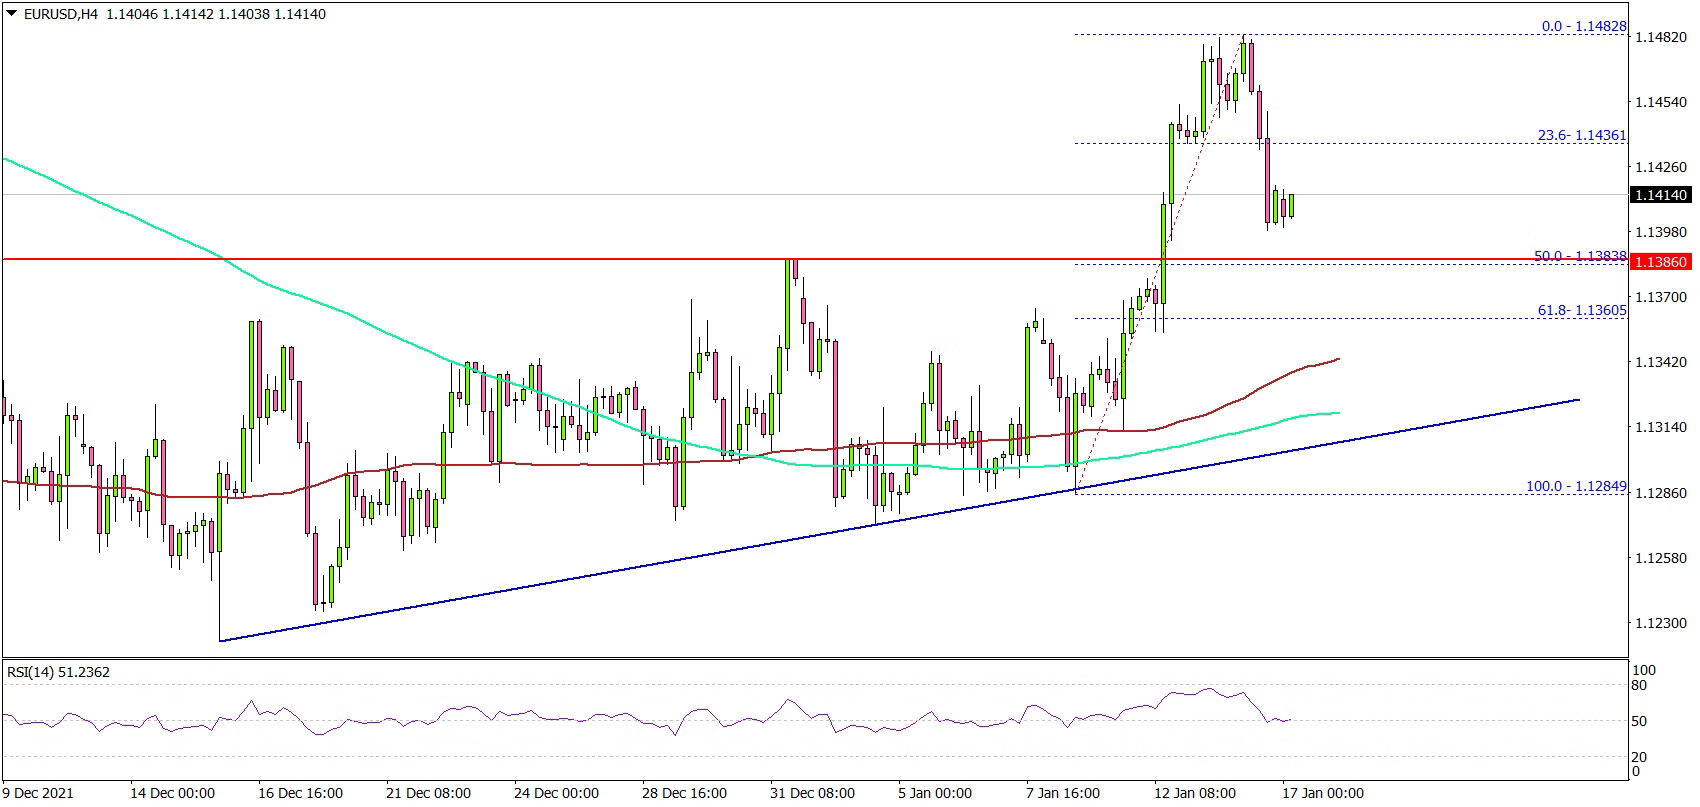
Looking at the 4-hours chart, the pair gained pace above the 1.1420 level. There was a close above the 1.1400 level, the 100 simple moving average (red, 4-hours), and the 200 simple moving average (green, 4-hours).
The pair climbed above the 1.1450 level and traded as high as 1.1482. It is now correcting gains below 1.1450. There was a break below the 23.6% Fib retracement level of the upward move from the 1.1284 low to 1.1482 high.
On the downside, an immediate support is near the 1.1380 (resistance turned support) level. It is close to the 50% Fib retracement level of the upward move from the 1.1284 low to 1.1482 high.
The main support is forming near the 1.1340 level. There is also a major bullish trend line forming with support near 1.1340 on the same chart, below which the pair could drop to 1.1280.
On the upside, the pair is facing resistance near 1.1450 level. The next major resistance is near the 1.1480 level, above which the pair could test 1.1550.
Looking at GBP/USD, there was a strong upward move above the 1.3600 and 1.3650 resistance levels.
Economic Releases
- German Buba Monthly Budget.
Bitcoin staying in sideway consolidation, still defending 40k
Bitcoin is now staying in consolidation above 39636 short term bottom, after quickly defending 40k handle. Considering that it's sitting just above 39559 structural support too, the consolidation could extend for a while. But outlook will stay bearish for another fall to 61.8% projection of 68986 to 41908 from 52101 at 35366 before completing the decline from 68986 high.
The timing of the downside breakout will depend on the eventual reaction to 4 hour 55 EMA (now at 43211) which it's struggling with. A strong break above 4 hour 55 EMA will stronger rebound to 55 day EMA (now at 48230) first, and rejected there to bring down trend resumption. Meanwhile, rejection by the current level could bring downside breakout rather quickly through 396363 to the mentioned 35366 target.