

Sample Category Title
Australia Labour Force – The boom in November was echoed in December
Unemployment fell to 4.2%, we did not expected to see it that low till May.
The very solid update in November has been followed by a sound gain December highlighting a labour market continues to significantly outperforming expectations.
The December Labour Force Survey reported a solid 64.8k/0.5% gain in employment, stronger that Westpac’s +30k but on par with market expectations of +60k.
Recovery in NSW and Vic continued to have a large influence on the national figures, with employment in these two states increasing by 32k and 25k respectively. Their employment is back around where it was May having fallen 250k and 145k during the lockdowns.”
Total employment is well above where it was back in June 2021, pre the latest round of lockdowns, and now has a clear upwards trend.
The report continues the story of solid gains in full-time employment with a 41.5k/0.5% lift by this group but part-time workers did not miss out with a 23.3k/0.6% gain. In the year full-time employment is up 4.1% while part-time employment is up 0.5%.
Hours worked gained a solid 1.0% continuing the recent trend of hours worked outperform the gains in employment suggesting economic activity was continuing to grow to this point in time.
The reference period was the two weeks to 18th December so it misses the impact of the Omicron outbreak.
Given the growth in hours worked it should be no surprise that underemployment has also continued to fall, down 0.9ppt to 6.65%, the lowest level of underemployment since November 2008. This is significant as we find underemployment a more power explanator for wages growth than unemployment.
What was surprising is we did not jump in workers returning to the labour force. At just +2.5k this saw the participation rate flat at 66.1%. Flat participation is why there was an outsized fall in the unemployment rate to 4.2% from 4.6%. We have not expected the unemployment rate to hit 4.2% May this year. It is also the lowest rate since August 2008, just before the GFC.
Underutilisation, that is unemployment plus underemployment, fell from 12.1% to 10.8% the lowest level since November 2008.
It is worth noting that for the last three months, the ABS estimate of the working age population contracted slightly again. The closure of the international borders are still biting and it will be interesting see where this goes in 2022 as the borders reopen.
The ABS noted that the easing of restrictions in NSW and Vic had a large influence on the national figures, with employment in the two states increasing by 180k and 141k. Employment in those states is only 52k and 4k (respectively) below May, having fallen by 250k and 145k during the lockdowns.
While the focus is on NSW and Vic it would be remiss not to mention the other states. Employment gained 6.5k in Qld but fell -0.7k in WA -1.9k in SA and -1.0k in Tas. In terms of unemployment, it fell from 4.6% to 4.0% in NSW, 4.7% to 4.2% in Vic, down just 0.1ppt in Qld to 4.7%, down to 3.4% from 3.8% in WA and down from 4.6% to 3.9% in SA.
Crude Oil Price Extends Rally Above $85
Key Highlights
- Crude oil price started a fresh increase above the $80.00 resistance.
- A key bullish trend line is forming with support near $83.50 on the 4-hours chart of XTI/USD.
- EUR/USD declined to 1.1310, and GBP/USD found support near 1.3565.
- Gold price remained well bid above the $1,800 support zone.
Crude Oil Price Technical Analysis
This week, crude oil price started a major increase above the $82.50 resistance against the US Dollar. It broke many hurdles near $83.00 and $84.20 to move into a positive zone.
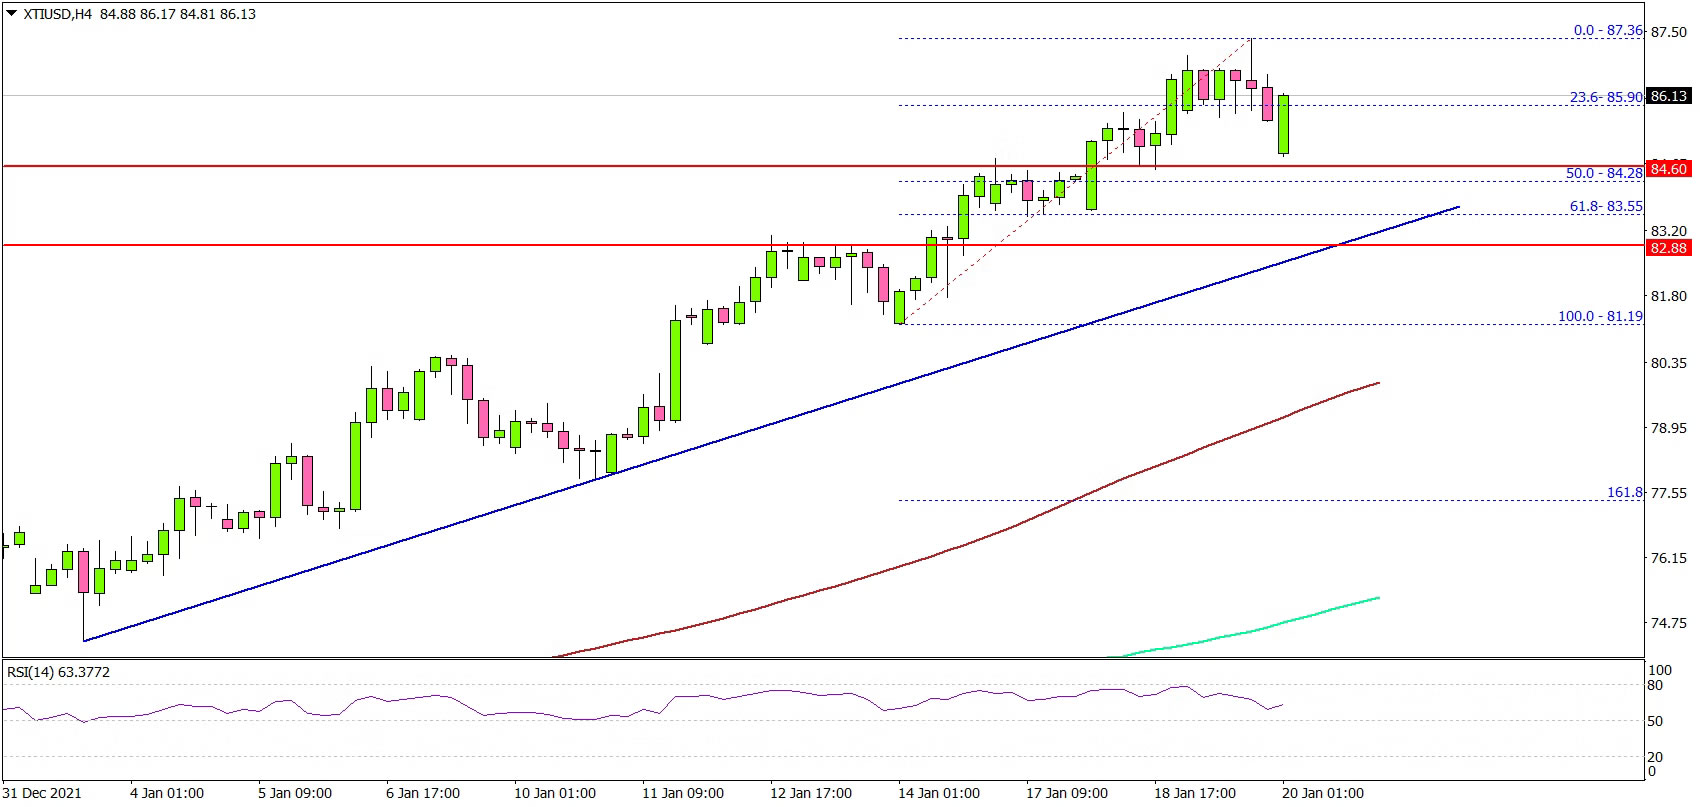
Looking at the 4-hours chart of XTI/USD, the price gained pace above the $85.00 level. The price settled well above the $85.00 level, the 100 simple moving average (4-hours, red) and the 200 simple moving average (4-hours, green).
The bulls pushed the price above the $86.50 level. If the bulls remain in action, the price could rise towards the $88.00 level. The next major resistance is near $90.00, where the bears might take a stand.
An immediate support on the downside is near the $85.50 level. The first major support is near $84.50. There is also a key bullish trend line forming with support near $83.50 on the same chart.
Any more losses could open the doors for a move towards the $82.20 support. In the stated case, there is also a risk of a move towards the $81.50 level.
Looking at EUR/USD, the pair declined heavily below the 1.1380 level, but the bulls were active above 1.1300. Besides, GBP/USD also started a fresh increase from the 1.3565 zone.
Economic Releases to Watch Today
- Euro Zone CPI for Dec 2021 (YoY) - Forecast +5%, versus +5% previous.
- Euro Zone CPI for Dec 2021 (MoM) - Forecast +0.4%, versus +0.4% previous.
- US Initial Jobless Claims - Forecast 220K, versus 230K previous.
- US Existing Home Sales for Dec 2021 (MoM) - Forecast +0.8%, versus +1.9% previous.
Gold Jumps on Inflation Worries
When gold rises, usually it is because of a weaker dollar. Although the Dollar Index did pull back a little today, it was still comfortably above the low of 94.60ish it hit earlier this month. Yet, gold not only surged to a fresh high on the year it also reached its best level since November. Since November, yields have been rising across the globe. Thus, gold has been able to ignore this as well.
So, what is going on and can gold hold its breakout?
Well, to me, it looks like gold investors are responding to two factors.
First, there is some level of haven flows supporting the metal as investors sell expensive technology stocks and seek refuge in the metal.
More to the point, gold is finally responding to high levels of inflation around the world. Eurozone CPI reached an all-time high of 5% in December and today we saw the UK consumer inflation surged to 5.4% in December, the fastest pace since 1992. Even hotter, US CPI has reached a 39-year high at 7%, no less. With crude oil climbing towards $90 and UK consumers facing a jump in utility bills that's due to hit in April, inflation is likely to rise even higher.
Rising levels of inflation are squeezing households and at the same time increase pressure on major central banks to raise interest rates more aggressively. The net result would be decreased economic activity, which is why we have seen certain sectors of the stock market perform so poorly this year.
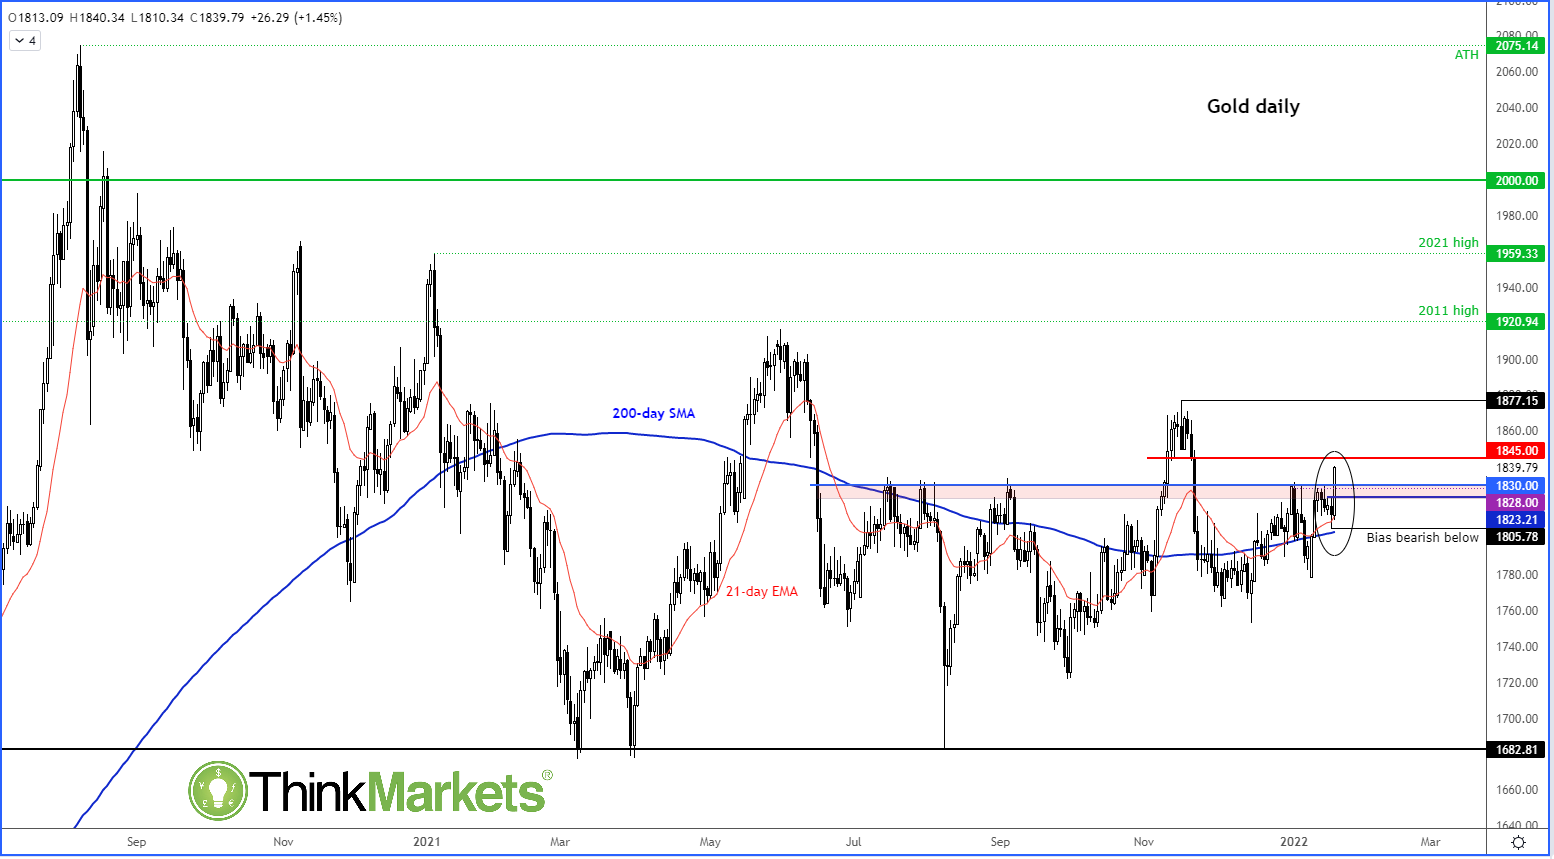
It remains to be seen whether the latest breakout attempt by gold can be held, but now there are more compelling reasons why the bulls might hold their ground. Key support is now the area between $1828 and $1830, which was previously acting as resistance. Short-term resistance is seen around $1845, but given the big breakout we may see that level break.
Gold Wave Analysis
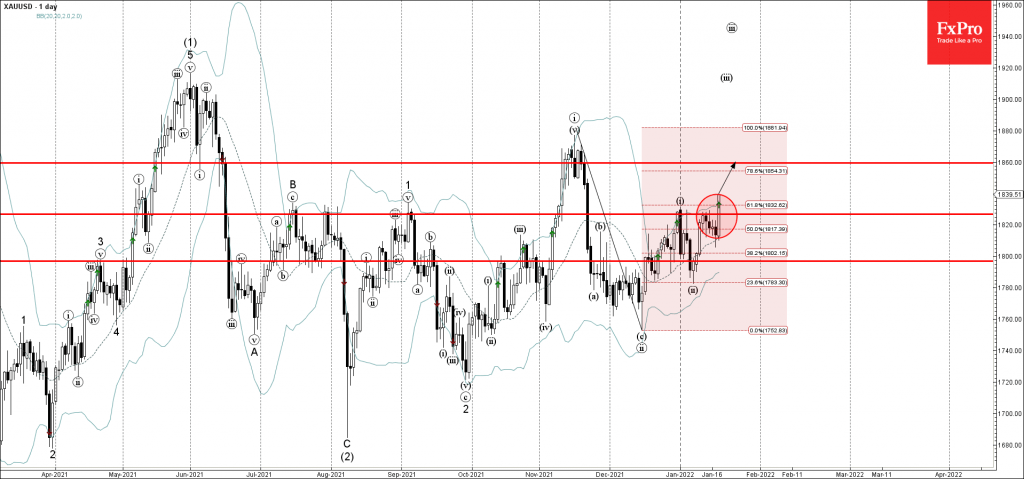
- Gold broke resistance level 1825.00
- Likely to rise to resistance level 1860.00
Gold continues to rise after the earlier breakout of the resistance level 1825.00 (top of the previous impulse wave (i)), intersecting with the 61.8% Fibonacci correction of the earlier downward correction from November.
The breakout of the resistance level 1825.00 continues the active impulse waves (iii) and iii.
Gold can be expected to rise further toward the next resistance level 1860.00 (which has been reversing the pair from the middle of December).
EURCAD Wave Analysis
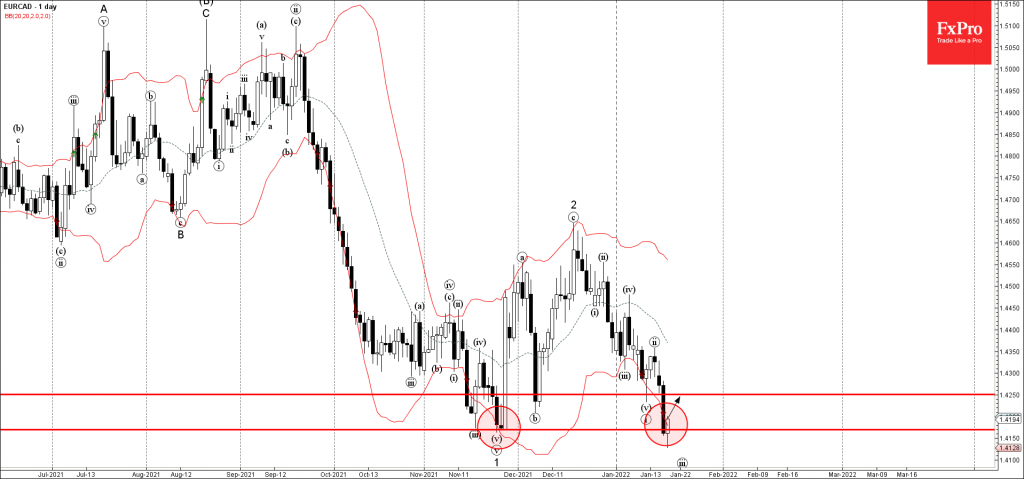
- EURCAD reversed from key support level 1.4170
- Likely to rise to resistance level 1.4250
EURCAD recently reversed up from the key support level 1.4170 (previous Double Bottom from November), – strengthened by the lower daily Bollinger Band.
The upward reversal from the support level 1.4170 stopped the previous sharp downward impulse waves (iii) and 3.
EURCAD can be expected to rise further toward the next resistance level 1.4250 (former support which stopped the previous impulse wave (i)).
Eco Data 1/20/22
[php_everywhere instance="1"]
Sterling Rises as UK Inflation Jumps
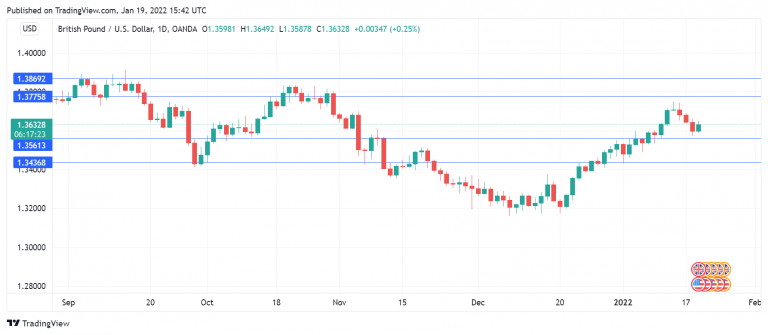
The British pound is in positive territory after falling for three straight days. GBP/USD has pushed above the 1.36 line and is trading at 1.3635 in the North American session, up 0.27% on the day.
UK inflation hits 30-year high
Anyone reading the news has seen plenty of headlines screaming “US inflation hits 30-year high!”. Well, now it’s the turn of the UK to share that unflattering stat, much to the chagrin of policymakers. December CPI rose to 5.4% y/y, up from 5.1% in the previous reading. This marked CPI’s highest level since 1992. Inflation continues to rise due to higher energy costs, strong consumer demand and supply chain disruptions.
Surging inflation forced the Fed to scramble into action and announce a tightening in policy, and the key question is whether the Bank of England respond with another interest rate increase, after a moderate hike of 15 bps to 0.25% in December. At that meeting, the BoE surprised the markets, which had expected the bank to stand pat until early in the New Year. The BoE defended the hike by saying that underlying inflationary pressures necessitated a move. Based on that logic, another hike in February would be a no-brainer, as UK inflation continues to rise. However, given that the BoE has pulled a fast one on the markets over the past two meetings, market participants would do well to display caution ahead of the BoE meeting and not assume that a rate hike is a done deal.
US Treasury rates continue to press upwards. After punching past 1.80% on Tuesday, a 2-year high, the 10-year rate has climbed to 1.90% earlier today before dipping to 1.85%. The 10-year rate hasn’t been above the symbolic 2% level since July 2019, but it looks poised to climb above that line shortly. The jump in US yields is reflective of market concerns that the Fed will accelerate its tightening. Most analysts are projecting three or four rate hikes in 2022, but Jamie Dimon, CEO of JP Morgan, made headlines last week when he projected the Fed would hike six or seven times this year.
GBP/USD Technical Analysis
- 1.3560 is under pressure in support. Below, there is support at 1.3438
- GBP/USD faces resistance at 1.3776 and 1.3870
Gold resumes rebound, targeting 1861 next
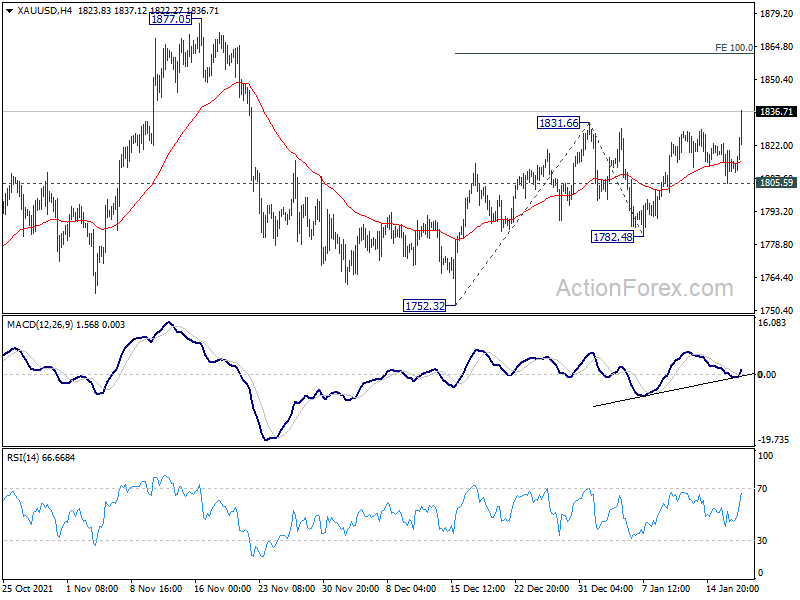
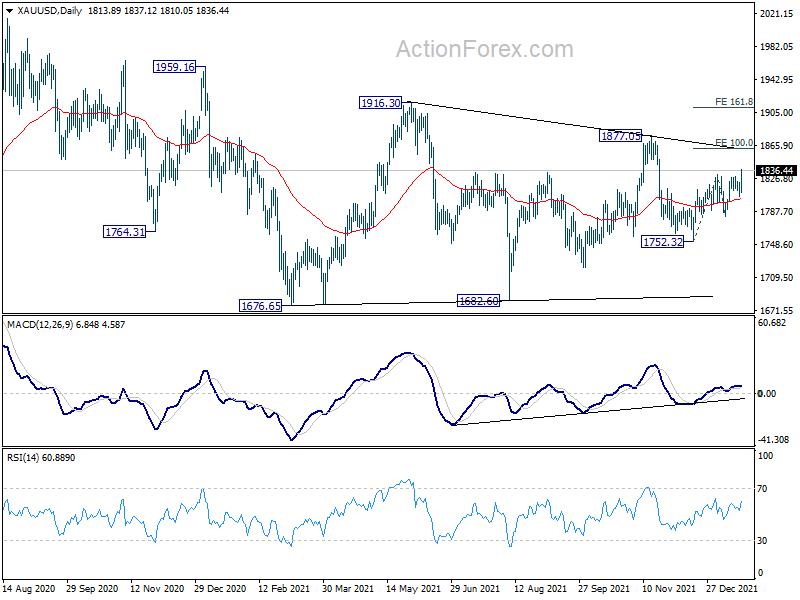
Lagging behind Silver a little bit, Gold also resumes rebound from 1752.32 by breaking through 1831.66 and hits as high as 1837.12 so far. Further rally should now be seen as long as 1805.59 support holds. Next target is 100% projection of 1752.32 to 1831.66 from 1782.48 at 1861.82.
But the main question is whether it's ready to break out from the medium term range set at 1676.65. We'll monitor the reaction to 1861.82. Sustained break there could trigger upside acceleration through 1877.05 to 161.8% projection at 1910.85, and set the stage for breakout. However, rejection by 1861.82, or failure to even hit it, will keep medium term outlook neutral for more sideway trading.
BoE Bailey: Higher inflation could restrain demand in the economy
BoE Governor Andrew Bailey told the parliament's Treasury Committee, that higher inflation could hit demand and employment, eventually bring prices down.
"This a hard thing to say ... but if you get pressure on cost of living, pressure on real earnings, that will tend to restrain demand in the economy... and that could lead to an output gap opening up, and it could eventually of course lead to higher unemployment and that would bring inflation down," he said.
"I don't want to suggest that ... were we to consider it necessary, we don't have to take any action in terms of the Bank of England's action on interest rates. We would obviously judge that ourselves. But there is another channel there which would weaken demand in the economy," he added.
It Finally Happened: German 10y Yield Turned Positive
Markets
It finally happened: the German 10y yield turned positive for the first time since April 2019. For six hours. The most important European benchmark rate gapped at the open to 0.004% in a catch-up move with a late-session US yield sprint. After hitting an intraday high of 0.02%, yield gains slowly evaporated as the European session evolved. It is currently trading at an, admittedly barely, negative 0.008%. Symbolic/technical breaks like these usually have to meet with swift follow-through price action in order to get confirmation but that’s not the case yet. Bunds nevertheless underperform USTs. The German curve bear steepens with changes ranging from +0.6 bps (2y) over +1.2 bps (10y) too +2.3 bps (30y). Peripheral spreads vs. the German 10 year widen slightly, with Greece (+2 bps) underperforming peers for a second day. US yields fall 1.4 bps (2y) to 0.8 bps (10y), bull flattening the curve after a hefty two-day selloff. With calm returning to the (US) bond market, equities caught a break as well. European stocks advance about 1%. In the US, the tech-heavy Nasdaq outperforms with gains of 0.9%. Oil prices extend gains for a fourth day. Brent ($88.04/barrel) is closing in on the $90 barrier. The International Energy Agency said the oil market looks tighter than earlier thought as omicron is having less impact on overall demand than initially feared. Adding to recent price increases, was Tuesday’s attack on oil-exporter UAE infrastructure as well as an explosion that day that temporarily knocked out an important crude pipeline running from Iraq to Turkey.
It’s relatively quiet on the major FX markets. The dollar is under marginal selling pressure, providing EUR/USD an opportunity to recover some of yesterday’s sharp losses. The pair is currently changing hands at 1.134, slightly up from 1.132. USD/JPY and the trade-weighted DXY hover near yesterday’s closing price around 114.50 and 95.62 respectively. The Norwegian krone is leading the major FX scoreboard thanks to oil. EUR/NOK eases to 9.93. Central European currencies were visibly relieved after a few tougher days on strong core bond increases and dollar strength. The forint takes the lead over regional peers, sending EUR/HUF down to 355.77. EUR/CZK declines (CZK strengthens) to 24.31, just shy of the previous 2020 lows around 24.25. The zloty is also returning to recent highs against the euro of EUR/PLN 4.52. Sterling is having a good day, not caring one single bit about UK prime minister Johnson’s uncertain political fate. Instead, inflation in December again turned out to be higher than expected and pushed money markets for the first time to fully price in a back-to-back rate hike on February 3 by the Bank of England. The headline figure rose from 5.1% y/y to 5.4%, the fastest pace since 1992. Core inflation unexpectedly quickened from 4% to a three-decade high of 4.2%. EUR/GBP is hitting a new 2-year low at 0.8318. 0.8277 serves as solid support.
News Headlines
Canadian headline expected fell by 0.1% on a monthly basis, but rose as expected from 4.7% Y/Y to 4.8% Y/Y in December, the highest reading since 1991. The Bank of Canada’s preferred core inflation gauge, the trimmed mean, unexpectedly accelerated from 3.4% Y/Y to 3.7% Y/Y. The Bank of Canada has a 2% inflation target surrounded by a 1% tolerance band. Over the past months, the BoC gradually reduced its net asset purchases to zero. Consensus expected the governor Macklem and his colleagues to start a tightening cycle in March/April, but an outside risk opened up that already conduct a first rate hike at next week’s policy meeting. Canadian money markets discount a total of 5 25 bps rate hikes this year. The loonie continues outperforming today. The oil price rally also delivered a significant push in the back of late. USD/CAD trades near the sell-off lows below 1.25. EUR/CAD set a minor new cycle low below 1.4164, the lowest level since early 2017.