

Sample Category Title
GBP/JPY Daily Outlook
Daily Pivots: (S1) 155.28; (P) 155.76; (R1) 156.11; More...
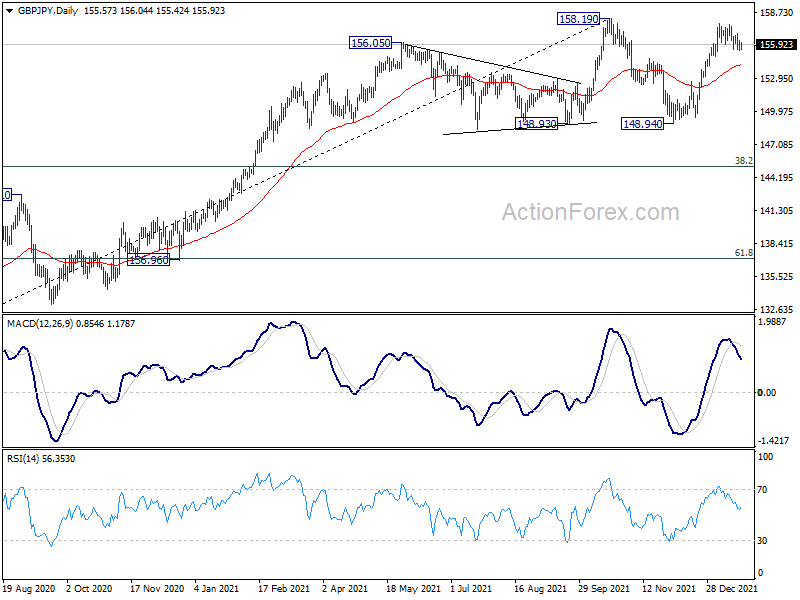
Intraday bias in GBP/JPY remains neutral and outlook is unchanged. Overall, further rise is still expected with 154.86 support intact. On the upside, decisive break of 158.19 high will resume larger up trend to 167.93 long term fibonacci level. On the downside, below 154.86 minor support will turn intraday bias back to the downside for deeper pull back.
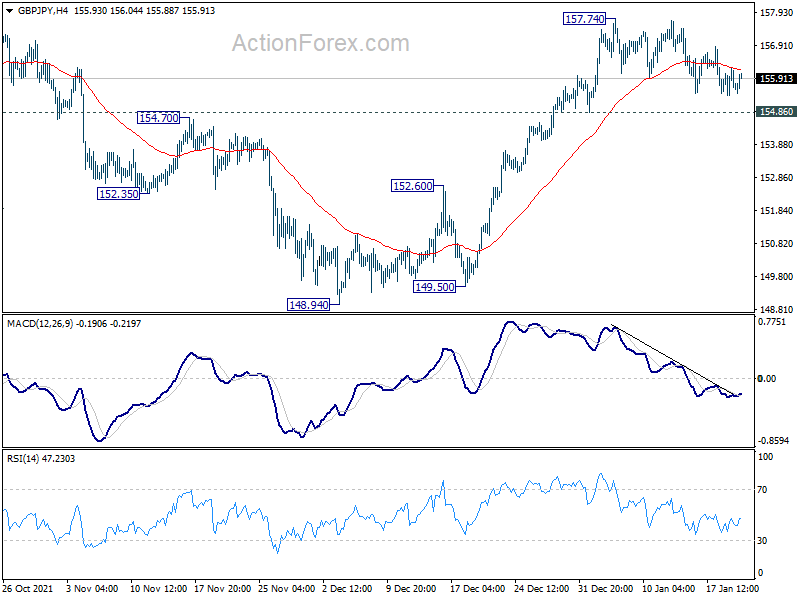
In the bigger picture, strong rebound from 148.93 key structural support retains medium term bullishness. Firm break of 158.19 high will resume whole up trend from 123.94 (2020 low), to 61.8% retracement of 195.86 to 122.75 at 167.93. Nevertheless, firm break of 148.93 will bring deeper correction to 38.2% retracement of 123.94 to 158.19 at 145.10, and possibly further lower, as a correction to up trend from 123.94 at least.
EUR/JPY Daily Outlook
Daily Pivots: (S1) 129.38; (P) 129.69; (R1) 129.97; More....
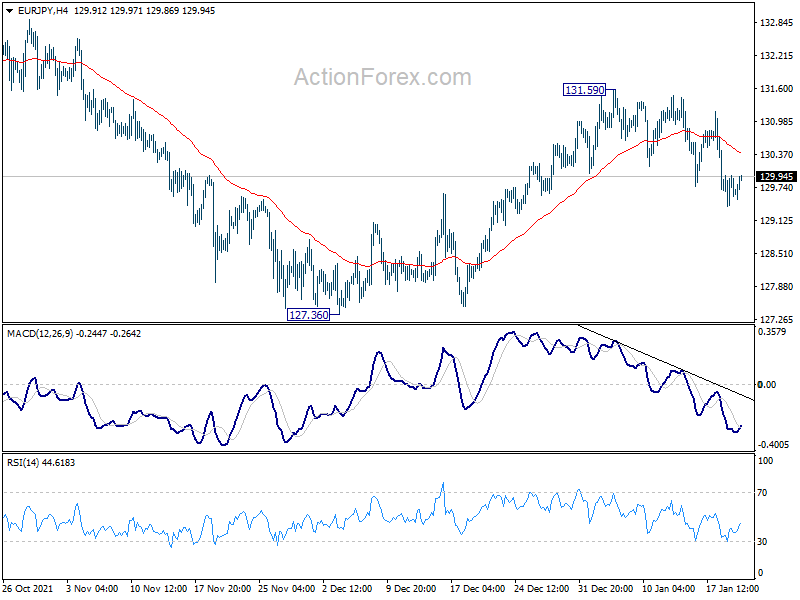
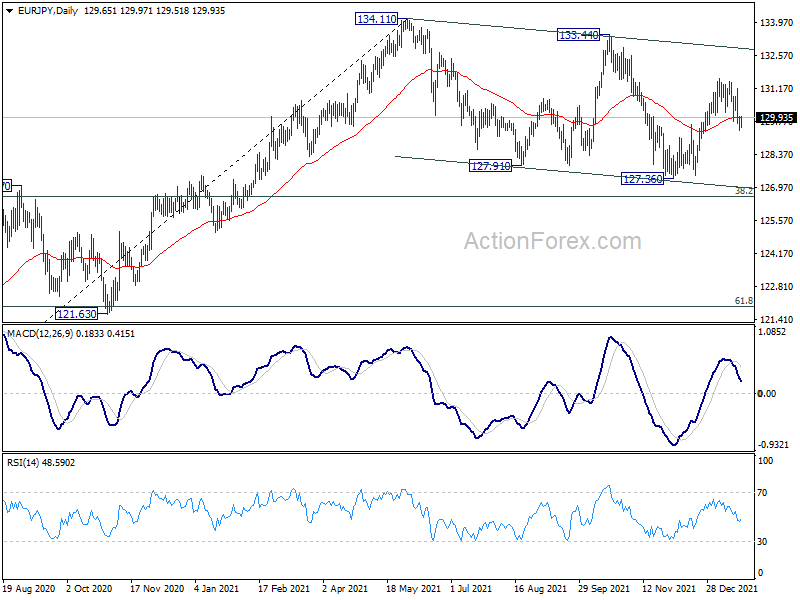
Intraday bias in EUR/JPY remains mildly on the downside at this point. Rebound from 127.36 could have completed at 131.59 already. Deeper fall would be seen back to 127.36 first. Break there will extend the corrective pattern from 134.11 to 126.58 fibonacci level. On the upside, though, break of 131.59 will resume the rebound to 133.44/134.11 resistance zone.
In the bigger picture, as long as 38.2% retracement of 114.42 (2020 low) to 134.11 at 126.58 holds, up trend from 114.42 is still in favor to continue. Break of 134.11 will target long term resistance at 137.49 (2018 high). However, sustained break of 126.58 will raise the chance of medium term bearish reversal. In this case, deeper decline would be seen to 61.8% retracement at 121.94, and possibly below.
EUR/GBP Daily Outlook
Daily Pivots: (S1) 0.8316; (P) 0.8329; (R1) 0.8345; More...
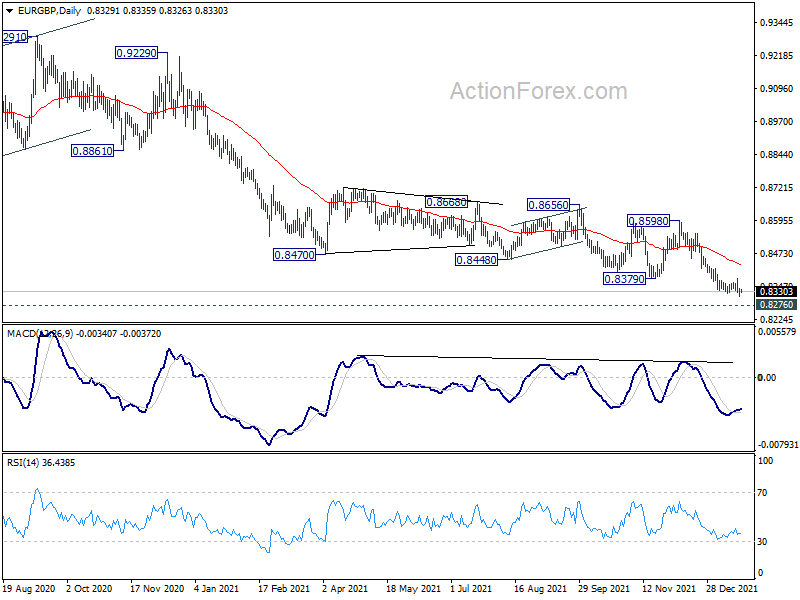
Intraday bias in EUR/GBP stays on the downside at this point. Current down trend would target 0.8276 key long term support. On the upside, however, break of 0.8377 resistance will now indicate short term bottoming, and bias back to the upside for stronger rebound.
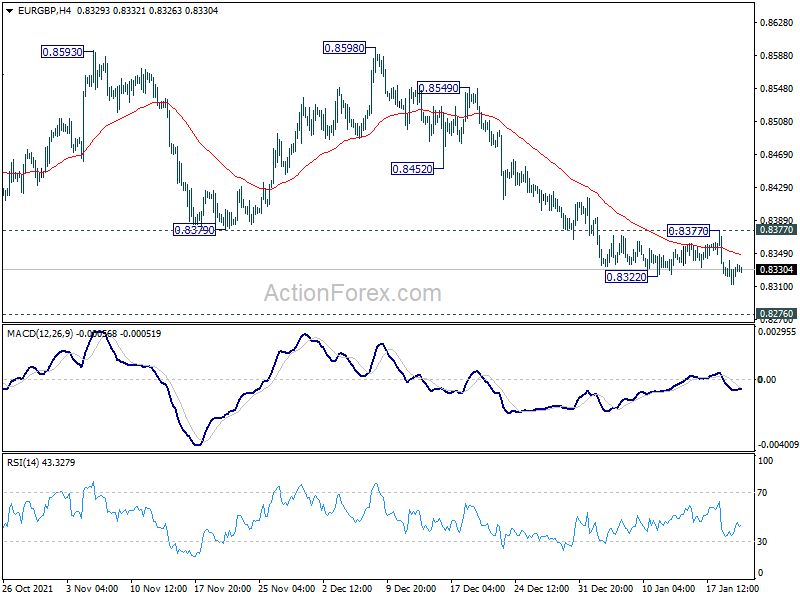
In the bigger picture, price actions from 0.9499 (2020 high) are still seen as developing into a corrective pattern. Deeper fall could be seen as long as 0.8598 resistance holds, towards long term support at 0.8276. We'd look for bottoming signal around there to bring reversal. Meanwhile, firm break of 0.8598 will now be an early sign of medium term bottoming and bring stronger rebound. However, sustained break of 0.8276 will argue that the long term trend has reversed.
EUR/AUD Daily Outlook
Daily Pivots: (S1) 1.5724; (P) 1.5799; (R1) 1.5839; More...
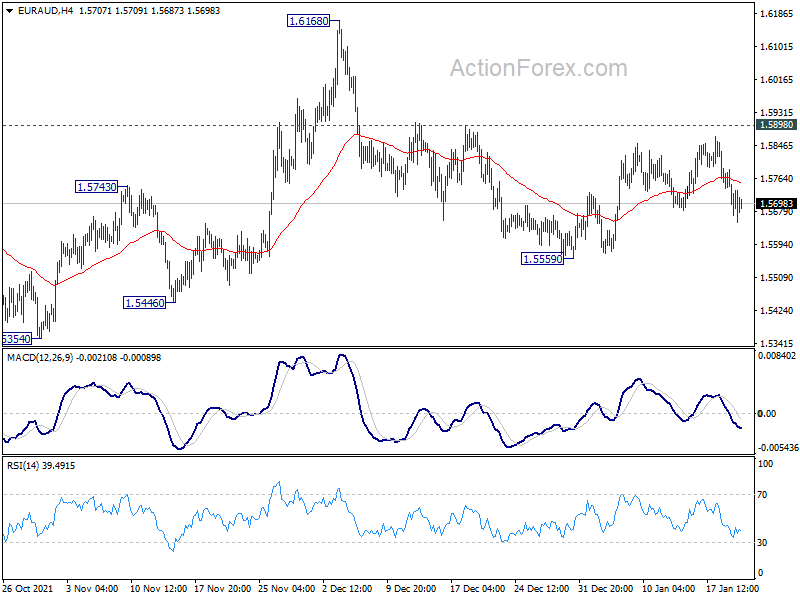
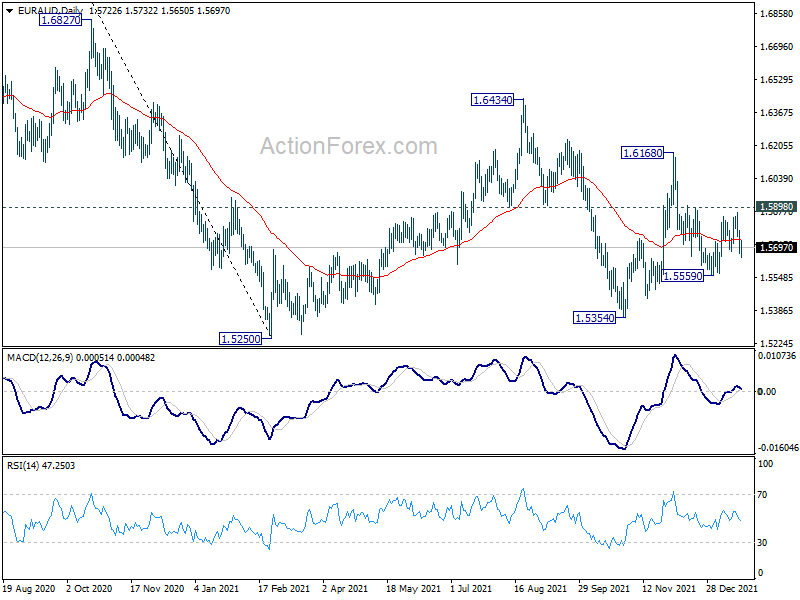
Range trading continues in EUR/AUD and intraday bias remains neutral at this point. On the downside, break of 1.5559 will resume the fall from 1.6168 to retest 1.5250/5354 support zone. On the upside, however, break of 1.5898 will argue that pull back from 1.6168 has completed. Intraday bias will be back to the upside for 1.6168 resistance.
In the bigger picture, rise from 1.5354 is seen as the third leg of the corrective pattern from 1.5250 low. Further rise cannot be ruled out, but even in that case, strong resistance should be seen at 38.2% retracement of 1.9799 to 1.5250 at 1.6988. Larger down trend from 1.9799 is in favor to extend through 1.5250 at a later stage.
EUR/USD Daily Outlook
Daily Pivots: (S1) 1.1323; (P) 1.1340; (R1) 1.1361; More...
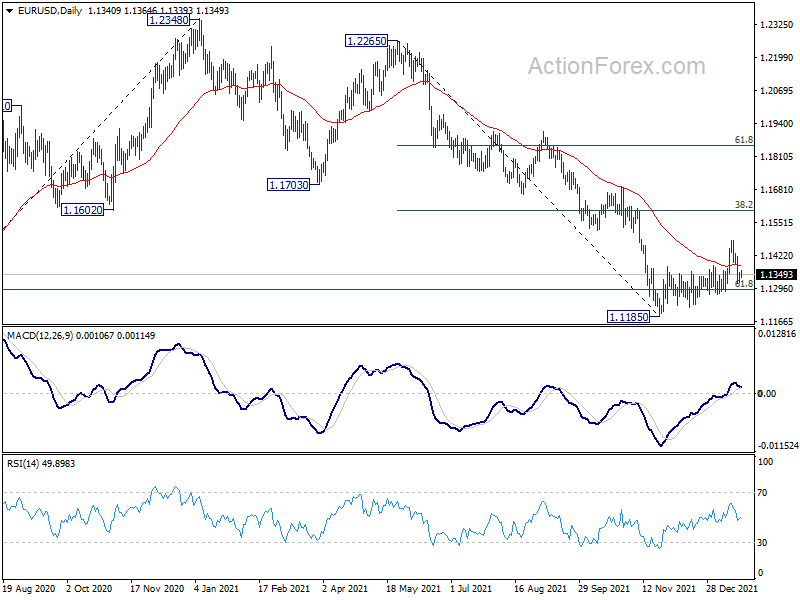
Outlook in EUR/USD is unchanged and intraday bias remains neutral first. Rebound from 1.1185 is seen as corrective move. Break of 1.1284 will argue that larger down trend from 1.2348 is ready to resume. Intraday bias will be back on the downside for retesting 1.1185 low first. Also, in case of another rise, upside should be limited by 38.2% retracement of 1.2265 to 1.1185 at 1.1598 eventually.
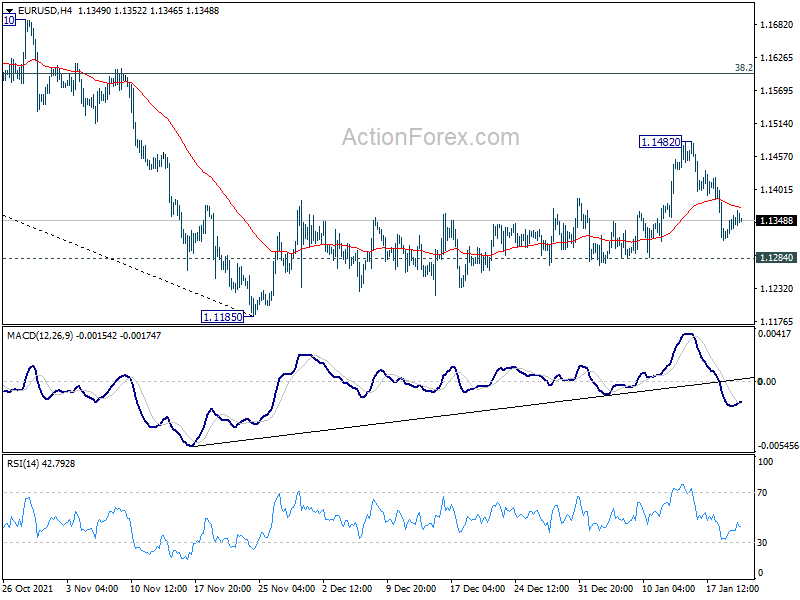
In the bigger picture, there are various ways of interpreting the fall from 1.2348 (2021 high). It could be a correction to rise from 1.0635 (2020 low), the fourth leg of a sideway pattern from 1.0339 (2017 low), or resuming long term down trend. In any case, outlook will now stay bearish as long as 1.1703 support turned resistance holds. Sustained break of 61.8% retracement of 1.0635 to 1.2348 at 1.1289 would pave the way back to 1.0635.
GBP/USD Daily Outlook
Daily Pivots: (S1) 1.3585; (P) 1.3617; (R1) 1.3646; More...
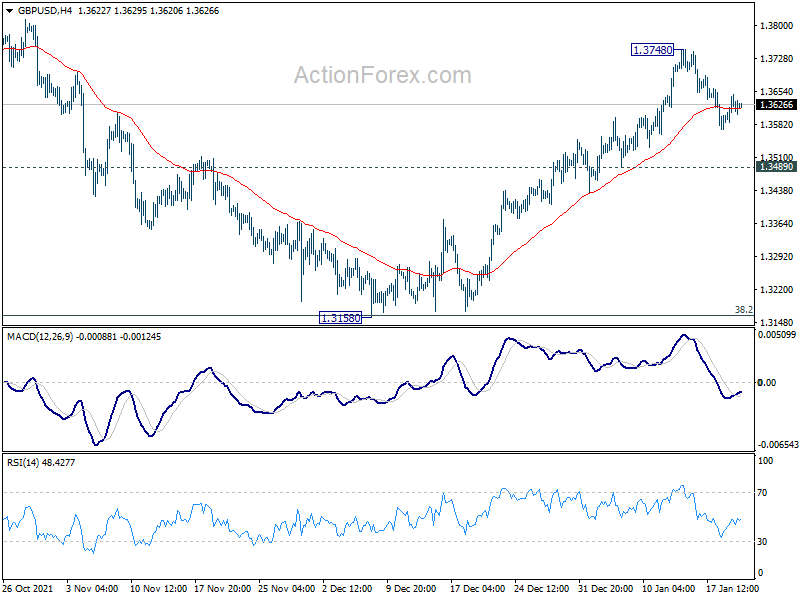
GBP/USD is staying in consolidation from 1.3748 and intraday bias remains neutral. While deeper fall cannot be ruled out, downside of retreat should be contained by 1.3489 support to bring another rally. As noted before, corrective fall from 1.4282 should have completed with three waves down to 1.3158, after hitting 1.3164 medium term fibonacci level. Above 1.3748 will target 1.3833 first. Sustained break of 1.3833 will pave the way back to retest 1.4248 high.
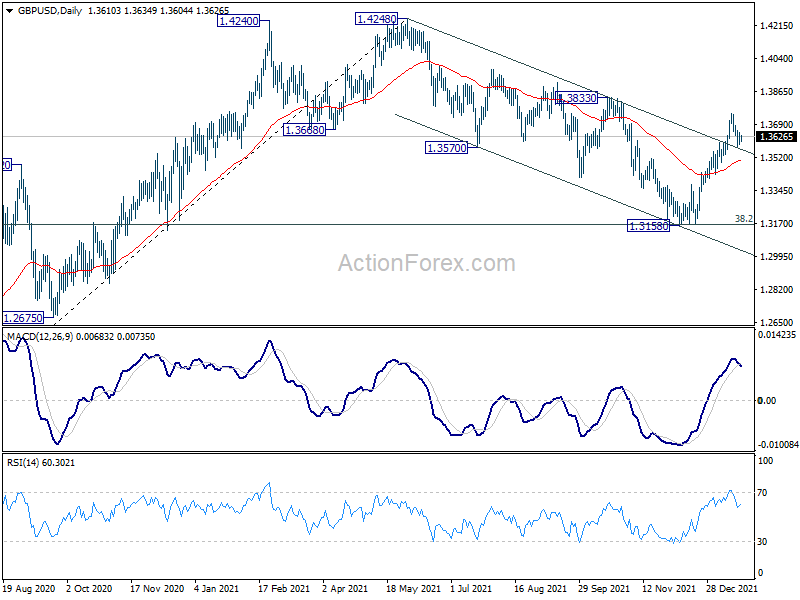
In the bigger picture, strong support was seen from 38.2% retracement of 1.1409 to 1.4248 at 1.3164. The development suggests that up trend from 1.1409 (2020 low) is still in progress. On resumption, next target will be 38.2% retracement of 2.1161 to 1.1409 at 1.5134. Nevertheless sustained break of 1.3164 will argue that whole rise from 1.1409 has completed and bring deeper fall to 61.8% retracement at 1.2493.
USD/CHF Daily Outlook
Daily Pivots: (S1) 0.9142; (P) 0.9160; (R1) 0.9175; More....
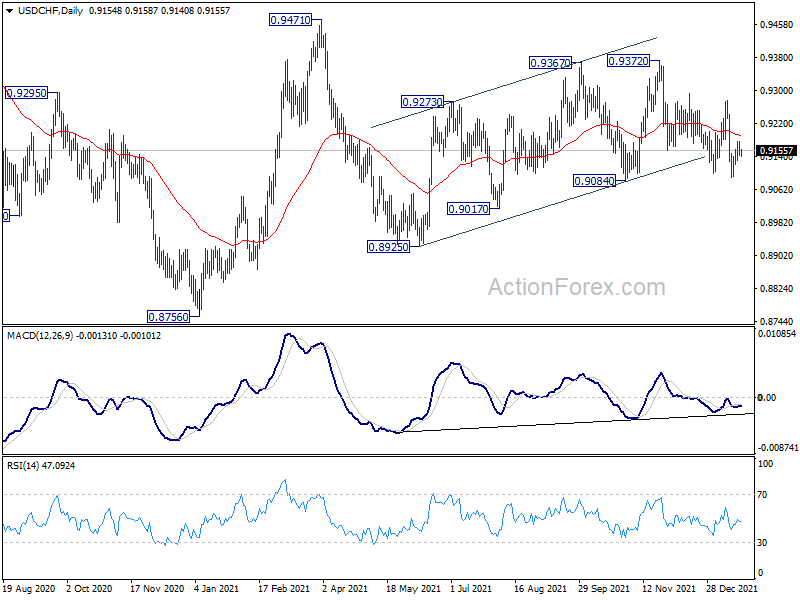
Intraday bias in USD/CHF remains neutral as consolidation from 0.9090 is extending. On the downside, firm break of 0.9084 support will argue that choppy rise from 0.8925 has completed. Fall from 0.9471 might be ready to resuming. Further decline would be seen back to 0.8925 support first. On the upside, above 0.9276 will target 0.9372 resistance instead.
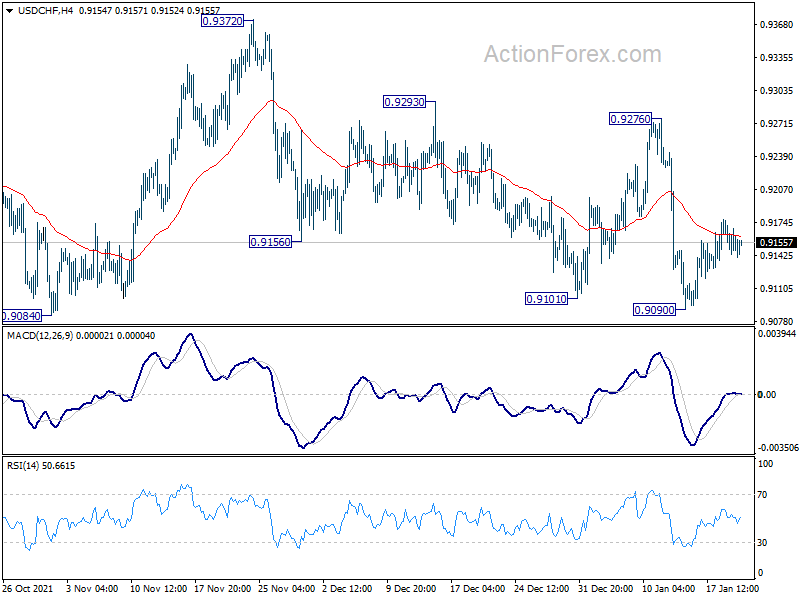
In the bigger picture, the corrective structure of the rebound from 0.8925 argues that fall from 0.9471 is not complete yet. It could either be the second leg of pattern from 0.8756 (2021 low), or resuming larger down trend from 1.0237 (2018 high). We'd pay attention to the downside momentum and assess the odds later. But for now, medium term outlook will be neutral at best as long as 0.9471 resistance holds.
USD/JPY Daily Outlook
Daily Pivots: (S1) 114.09; (P) 114.44; (R1) 114.67; More...
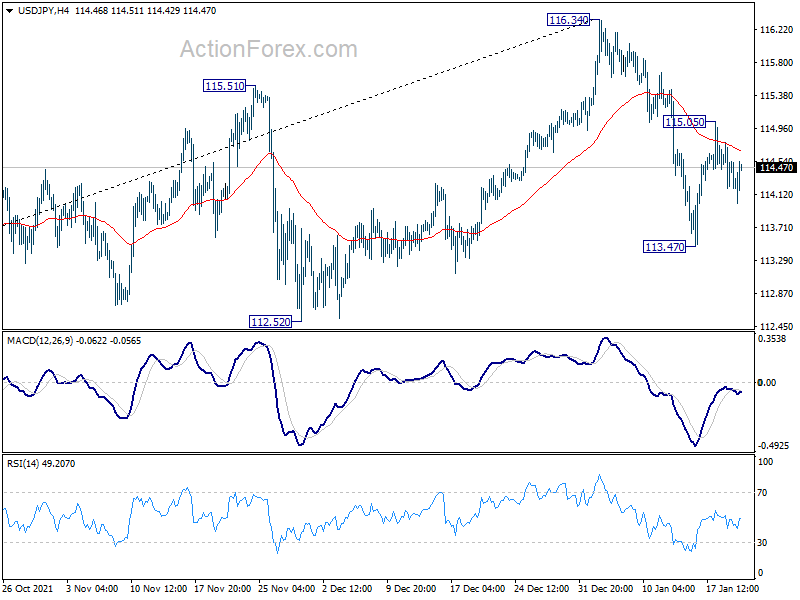
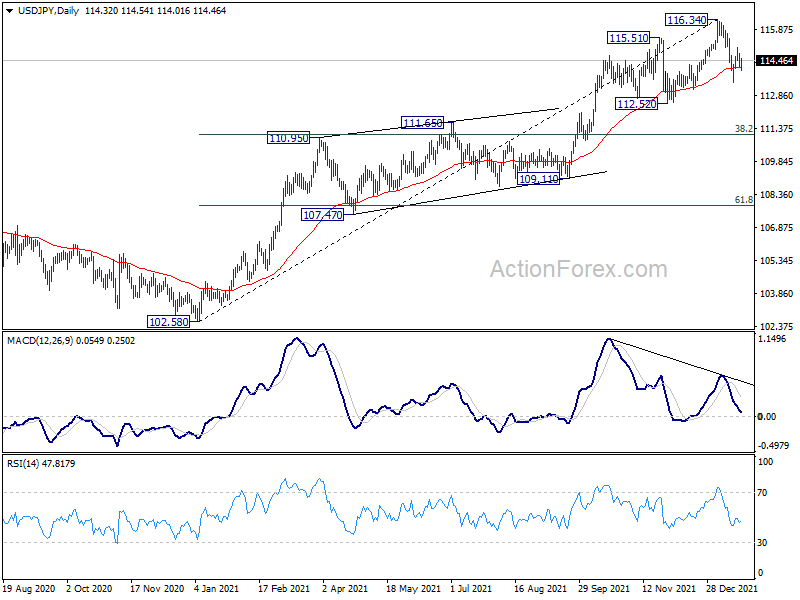
Intraday bias in USD/JPY is mildly on the downside for 113.47. Break there will resume the fall from 112.52 structural support. Considering bearish divergence condition in in daily MACD, further break of 112.52 will confirm that it's already in correction to the up trend from 102.58. Deeper decline would be seen to 38.2% retracement of 102.58 to 116.34 at 111.08. On the upside, break of 115.05 will resume the rebound from 113.47. But a break of 116.34 high is not expected even in this case.
In the bigger picture, no change in the view that rise from 102.58 is the third leg of the up trend from 101.18 (2020 low). Such rally should target a test on 118.65 (2016 high). Sustained break there will pave the way to 120.85 (2015 high) and raise the chance of long term up trend resumption. However, firm break of 112.52 support will dampen this bullish case and we'll assess the outlook based on subsequent price actions later.
USD/CAD Daily Outlook
Daily Pivots: (S1) 1.2478; (P) 1.2521; (R1) 1.2556; More...
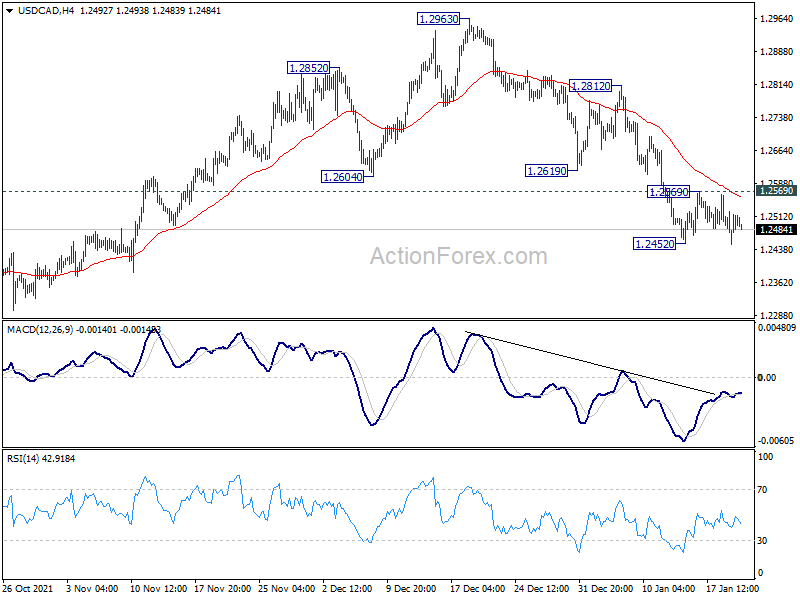
Intraday bias in USD/CAD stays on the downside at this point. As noted before, the whole pattern from 1.2005 might be finished three waves to 1.2963. Further fall would be seen to 1.2286 support, possibly further to retest 1.2005 low. Nevertheless, on the upside, break of 1.2569 minor resistance will indicate short term bottoming and turn bias back to the upside for stronger rebound.
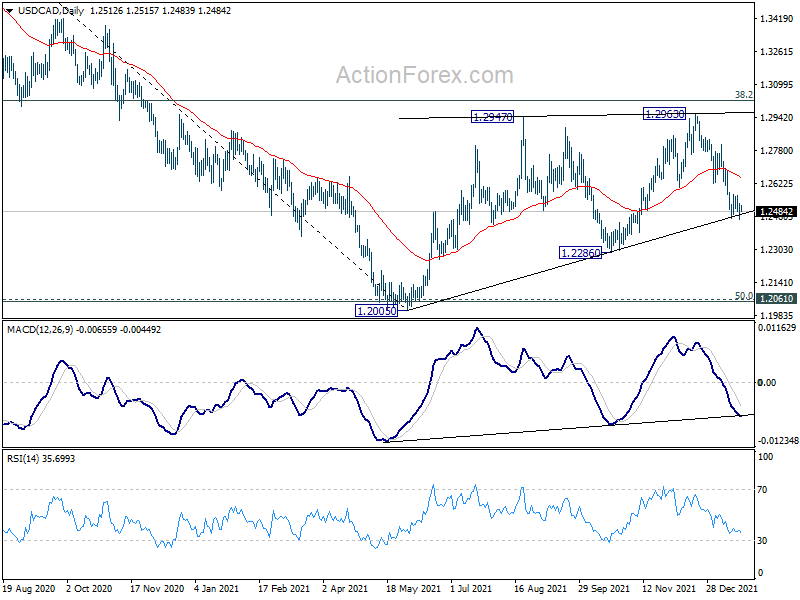
In the bigger picture, focus will be on 38.2% retracement of 1.4667 (2020 high) to 1.2005 (2021 low) at 1.3022. Sustained break there should confirm that the down trend from 1.4667 has completed after defending 1.2061 long term cluster support. Further rise would then be seen towards 61.8% retracement at 1.3650. However, rejection by 1.3022 will maintain medium term bearishness. Break of 1.2005 will resume the down trend form 1.4667 and that carries larger bearish implications too.
Hawkish Fed Pricing Outweighs Urge of Dip-Buying
Market sentiment is mixed. There is a certain will to buy a dip in US indices, yet the aggressive hawkish Federal Reserve (Fed) pricing doesn’t allow the appetite to get restored. It results in hectic pricing as the US yields go up.
The US 2-year yield advanced past the 1%, while the US 10-year yield slightly retreated from the 1.90% mark.
The actual market pricing factors in the possibility of a 50bp rate hike in the US in March. The idea of 50bp-hike opens the door for more aggressive pricing on the yields, and that could continue weighing on the investor mood, if the focus remains heavily on the rates.
The sharp rise in US yields is the number one reason pushing the stock indices lower since the start of this year, and the major indices are much more vulnerable to interest rate hikes now than they were before, because the Big Tech has an increased weight in the indices, and they are vulnerable to rate hikes.
Nasdaq is set to test its 200-DMA, near the 15000 mark, and the S&P500 stepped into the bearish consolidation zone, having cleared the 100-DMA support at yesterday’s slide.
Limited risk appetite and mounting tensions between Ukraine and Russia support a rise in gold prices despite the rising US yields. The price of an ounce rallied almost $40 in two sessions, but the gold bulls could well bump into a solid resistance within the $1850/1860 band.
Ukraine-Russia tensions, combined with OPEC+ struggle to revive output are also giving an extra push to the oil bulls. In fact, the low oil output decreases the cushion of spare supply, which is now expected to dive to a 4-year low by July. And the periods of lower cushion tend to have a positive impact on oil prices. Yesterday, US crude flirted with the $88pb mark. It is no longer a matter of if, but a matter of when the price will reach the $100pb mark. That’s good news for energy stocks, but bad news for inflation, and the Fed hawks, and the US yields and the overall market sentiment.
Strong earnings are the only hope for the equity bulls in the short run. The bank earnings have been strong, but not perfect. Big banks have diverging forecasts regarding the future. Some expect that the rising interest rates will increase their profitability while others see inflation as a threat to profits.
Netflix will be the first FAANG stock to reveal its Q4 results. The expectations are soft amid reports of slowing download trends in December across all regions, which could hit the subscription growth, a key metric of performance for Netflix. The tech stocks don’t have the luxury of deceiving their investors at an environment of rising Fed expectations, so a softer-than-expected set of results could further hammer the investor appetite.