

Sample Category Title
S&P 500 closed higher after Fed Powell, staying in up trend
US stocks closed generally higher overnight after upbeat comments from Fed Chair Jerome Powell. In the nomination hearing before Senate Banking committee, he said that the current surge in Omicron infections will only have "short-lived" impacts. The economy is ready for some monetary stimulus withdrawal.
"Inflation is running very far above target. The economy no longer needs or wants the very accommodative policies we have had in place," Powell said. And, "you need to focus on getting inflation under control because you're not going to have maximum employment without price stability." Though, he didn't drop any hint on the timing of the first rate hike.
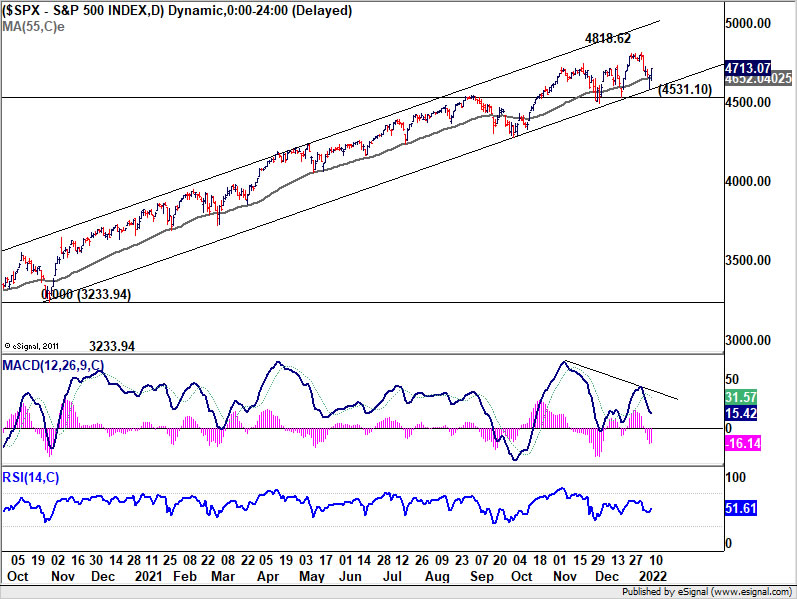
S&P 500 closed up 0.92% at 4713.07. SPX is so far still holding well inside medium term rising channel. 55 day EMA is also providing adequate support to maintain bullishness. Overall, it's still on track to resume the long term up trend through 4818.62 high at a later stage, towards 5000 handle.
Technical Outlook and Review
DXY:
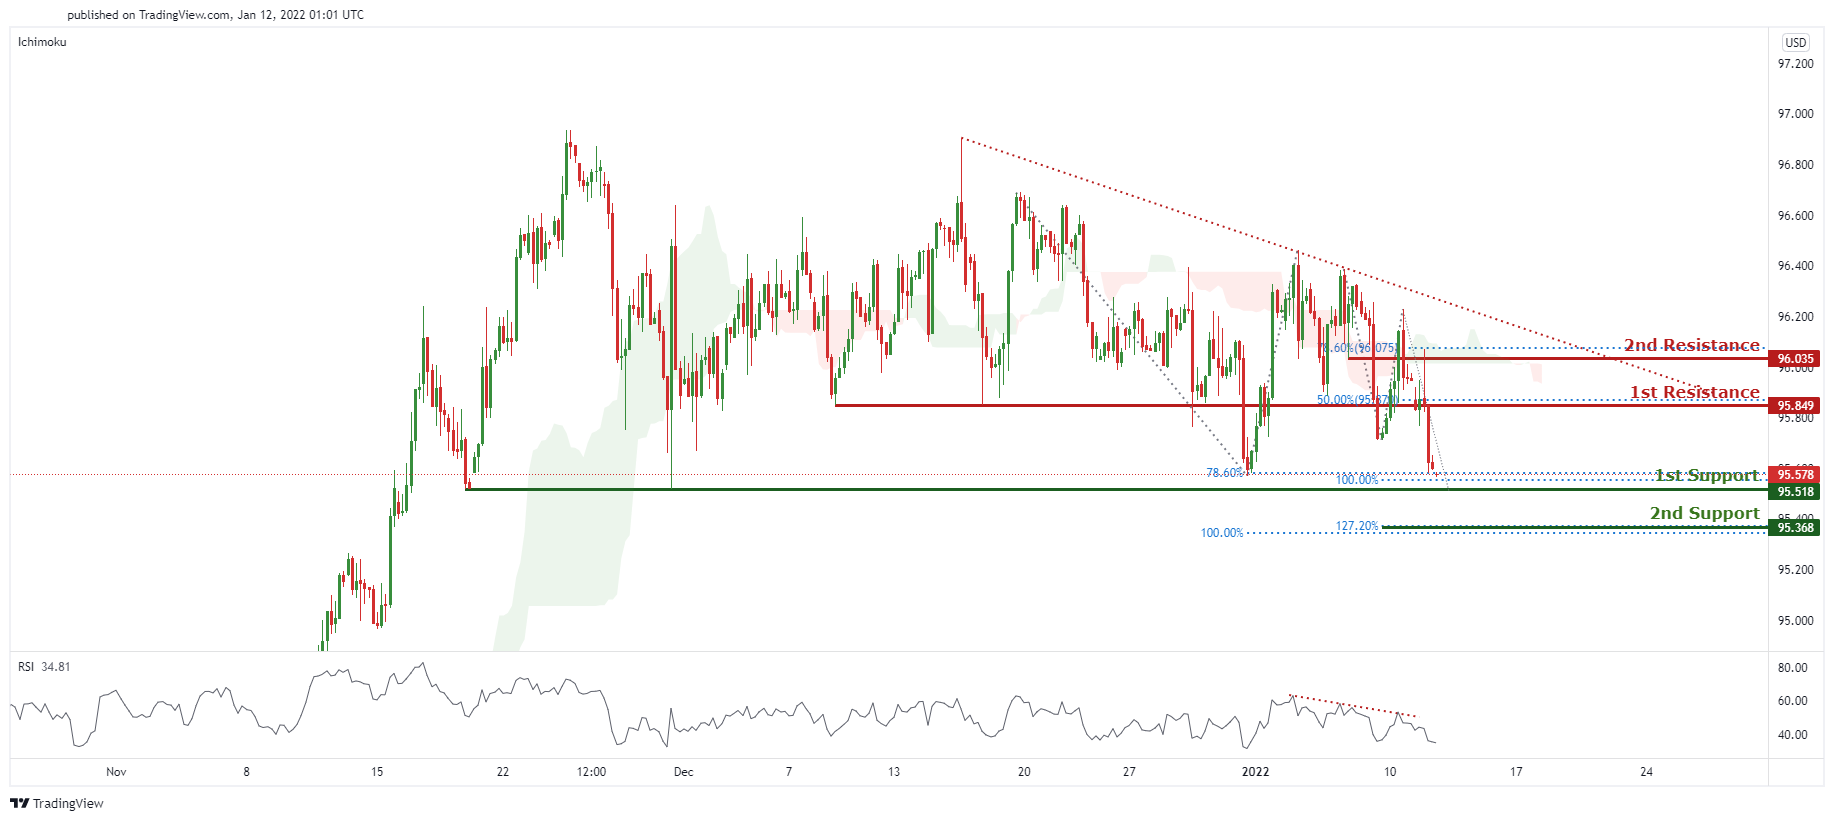
On the H4 timeframe, prices are on bearish momentum and abiding to our bearish trendline. We would expect further bearish continuation to test our 1st support at 95.518 in line with 100% Fibonacci extension and 78.6% Fibonacci retracement. Breaking our 1st support may find prices dipping further towards our 2nd support at 95.368 in line with 127.2% Fibonacci extension and 100% Fibonacci extension. Our bearish bias is further supported by prices trading below ichimoku clouds and RSI forecasting bearish momentum. Alternatively, prices may bounce towards our 1st resistance at 95.849 in line with 50% Fibonacci extension.
Areas of consideration:
- H4 time frame, 1st resistance at 95.849
- H4 time frame, 1st support at 95.518
XAU/USD (GOLD):
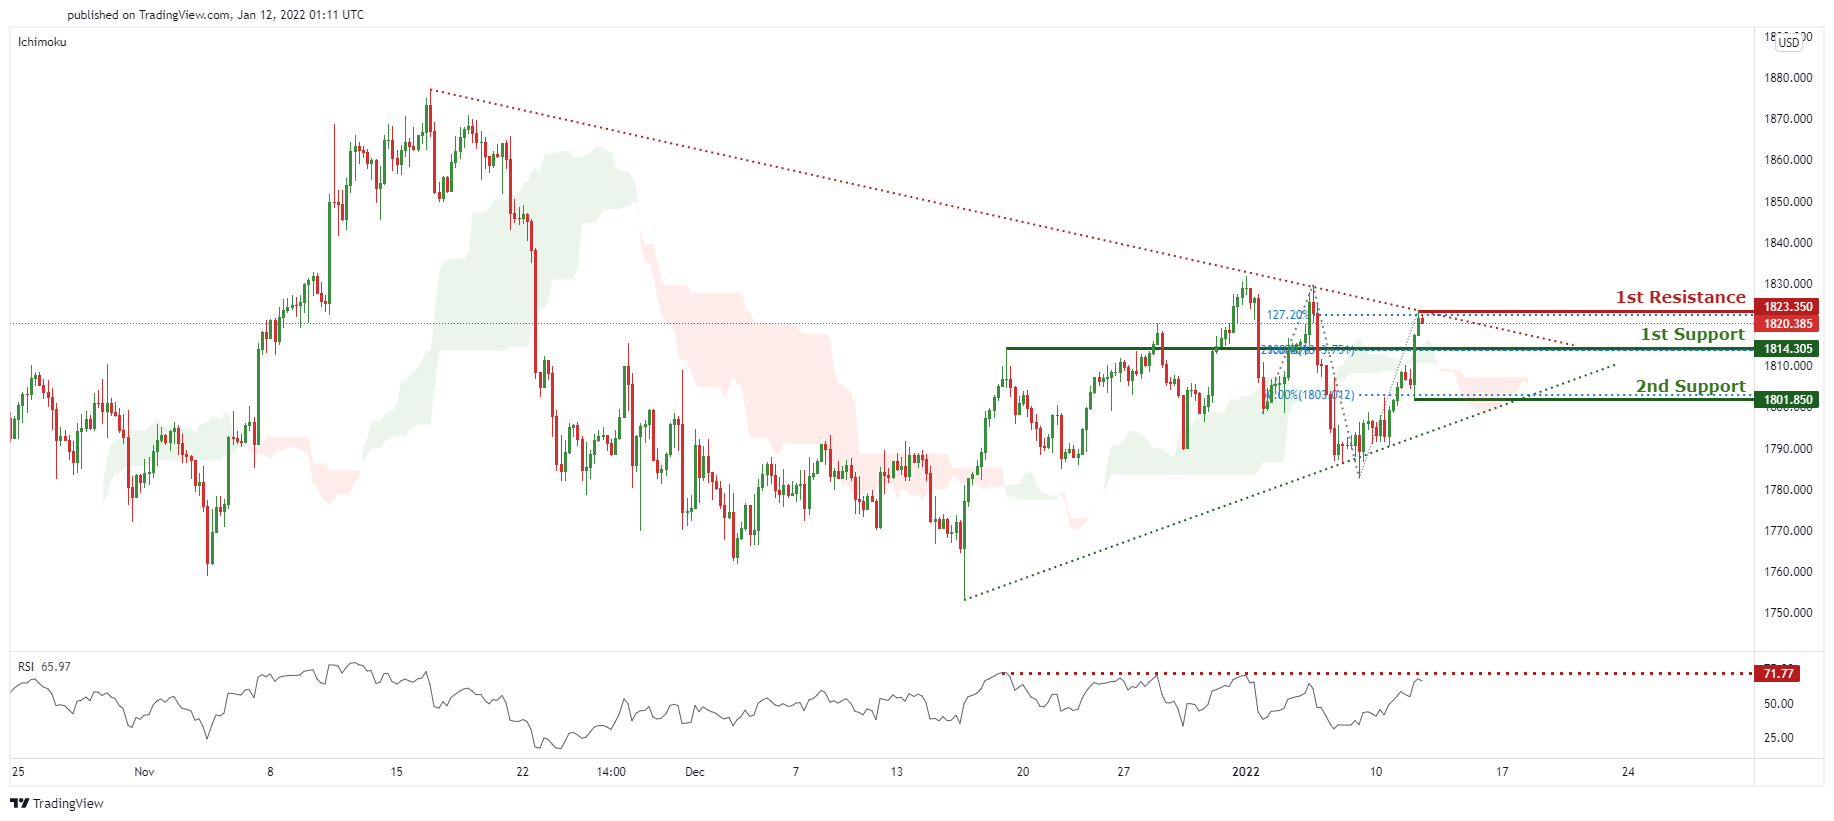
On the H4 chart, prices are consolidating in a triangle. We see the potential for a dip from our 1st resistance at 1823.350 in line with 127.2% Fibonacci extension towards our 1st support at 1814.305 in line with 100% Fibonacci extension and 50% Fibonacci retracement. RSI is at levels where dips occurred previously and ichimoku is turning red, further supporting our bearish bias.
Areas of consideration:
- H4 1st support at 1814.305
- H4 1st resistance at 1823.350
GBP/USD
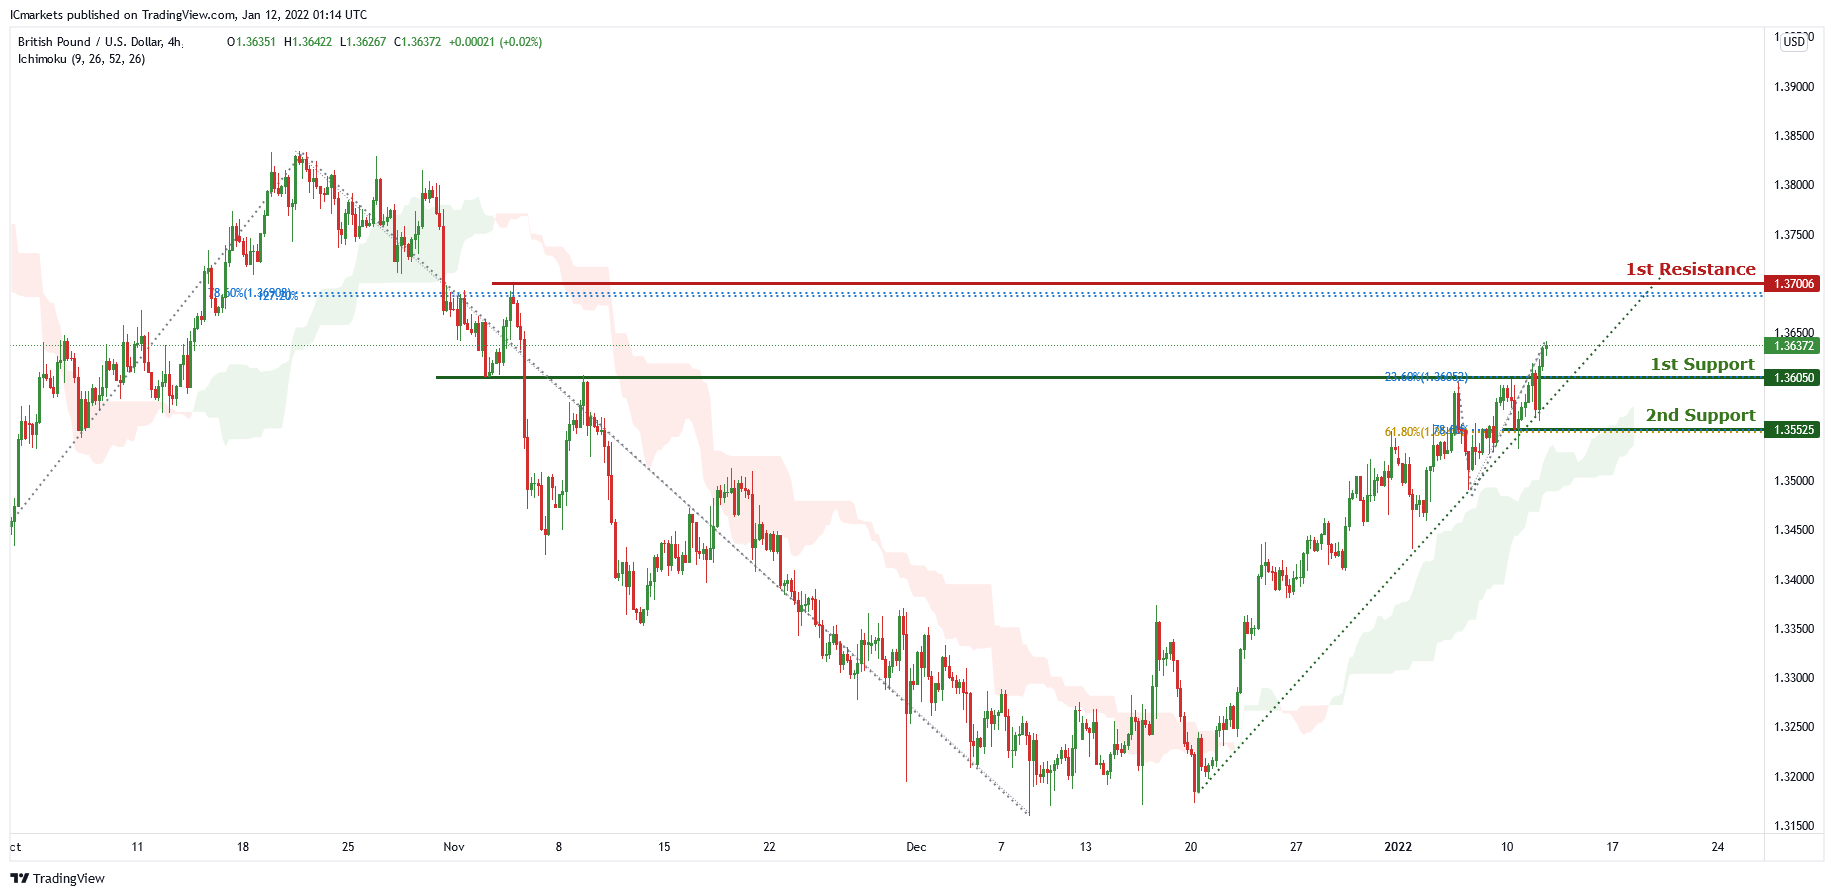
On the H4 chart price is abiding by an ascending trendline and near the first support level of 1.36050 which is also 23.6% Fibonacci retracement. Price can potentially go to the 1st resistance level of 1.37006 which is also 78.6% Fibonacci retracement and 127.2% Fibonacci projection. Our bullish bias is supported by the ichimoku cloud indicator as price is trading above the cloud.
Areas of consideration:
- H4 1st resistance at 1.37006
- H4 1st support 1.36050
USD/CHF:
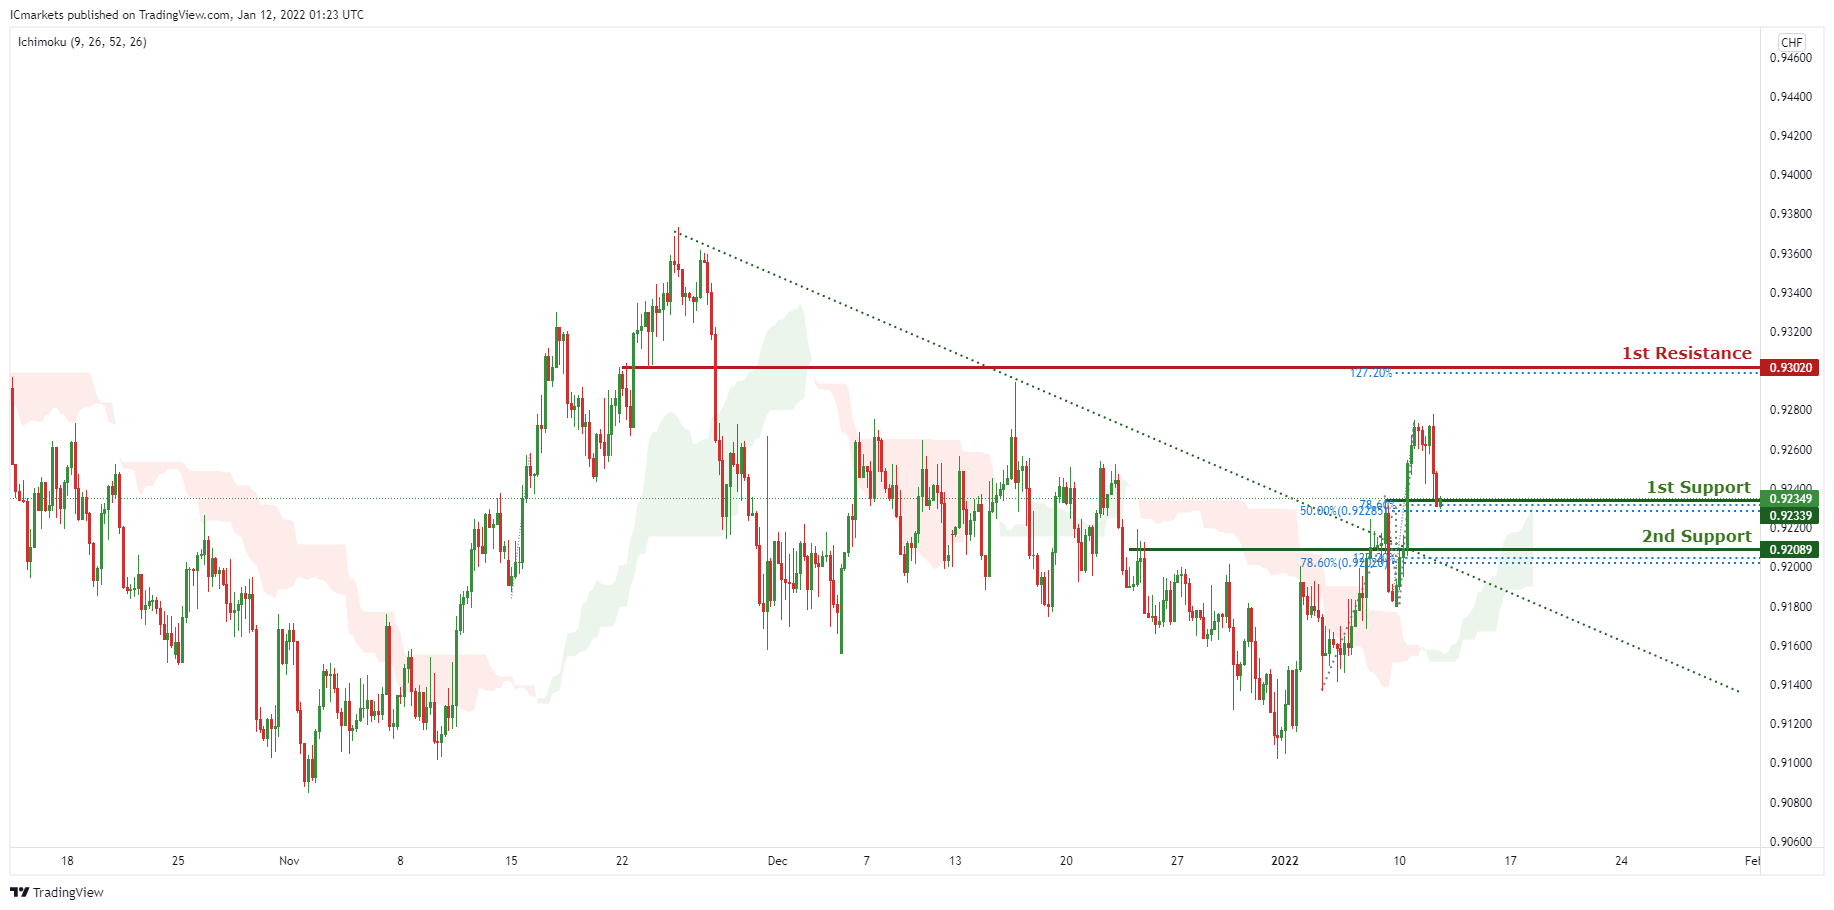
On the H4 timeframe, price recently broke out of the descending trendline resistance, signifying an overall bullish momentum. We can expect price to bounce from the 1st Support level in line with 50% Fibonacci retracement and 78.6% Fibonacci projection towards the 1st Resistance in line with 127.2% Fibonacci projection. Our bullish bias is further supported by the Ichimoku cloud indicator where the price is holding above it.
Areas of consideration:
- Watch 1st Support at 0.92339
- Watch 1st Resistance at 0.93020
EUR/USD :
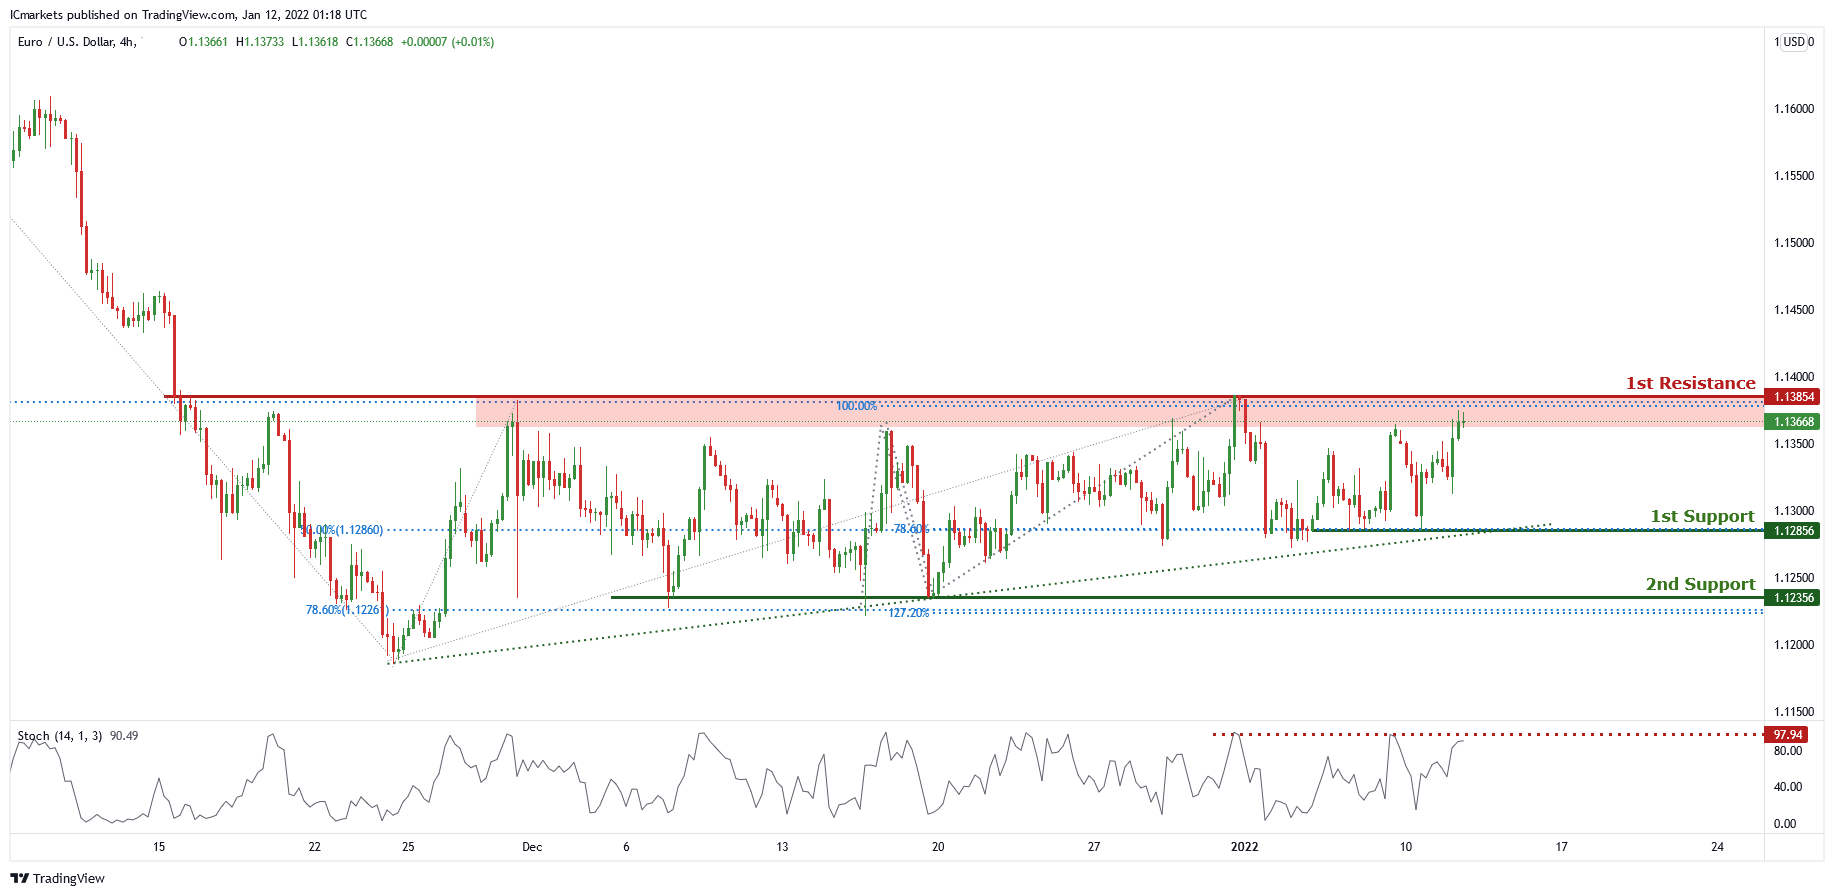
On the H4 chart, price is abiding by an ascending trendline and is heading to the 1st resistance level of 1.13854 which is also 100% Fibonacci projection and 38.2% Fibonacci retracement. Price can potentially dip to the 1st support level of 1.12783 which is also 50% Fibonacci retracement and 78.6% Fibonacci projection. Our bearish bias is supported by the stochastic indicator.
Areas of consideration :
- H4 1st support at 1.12783
- H4 1st resistance at 1.13854
USD/JPY:
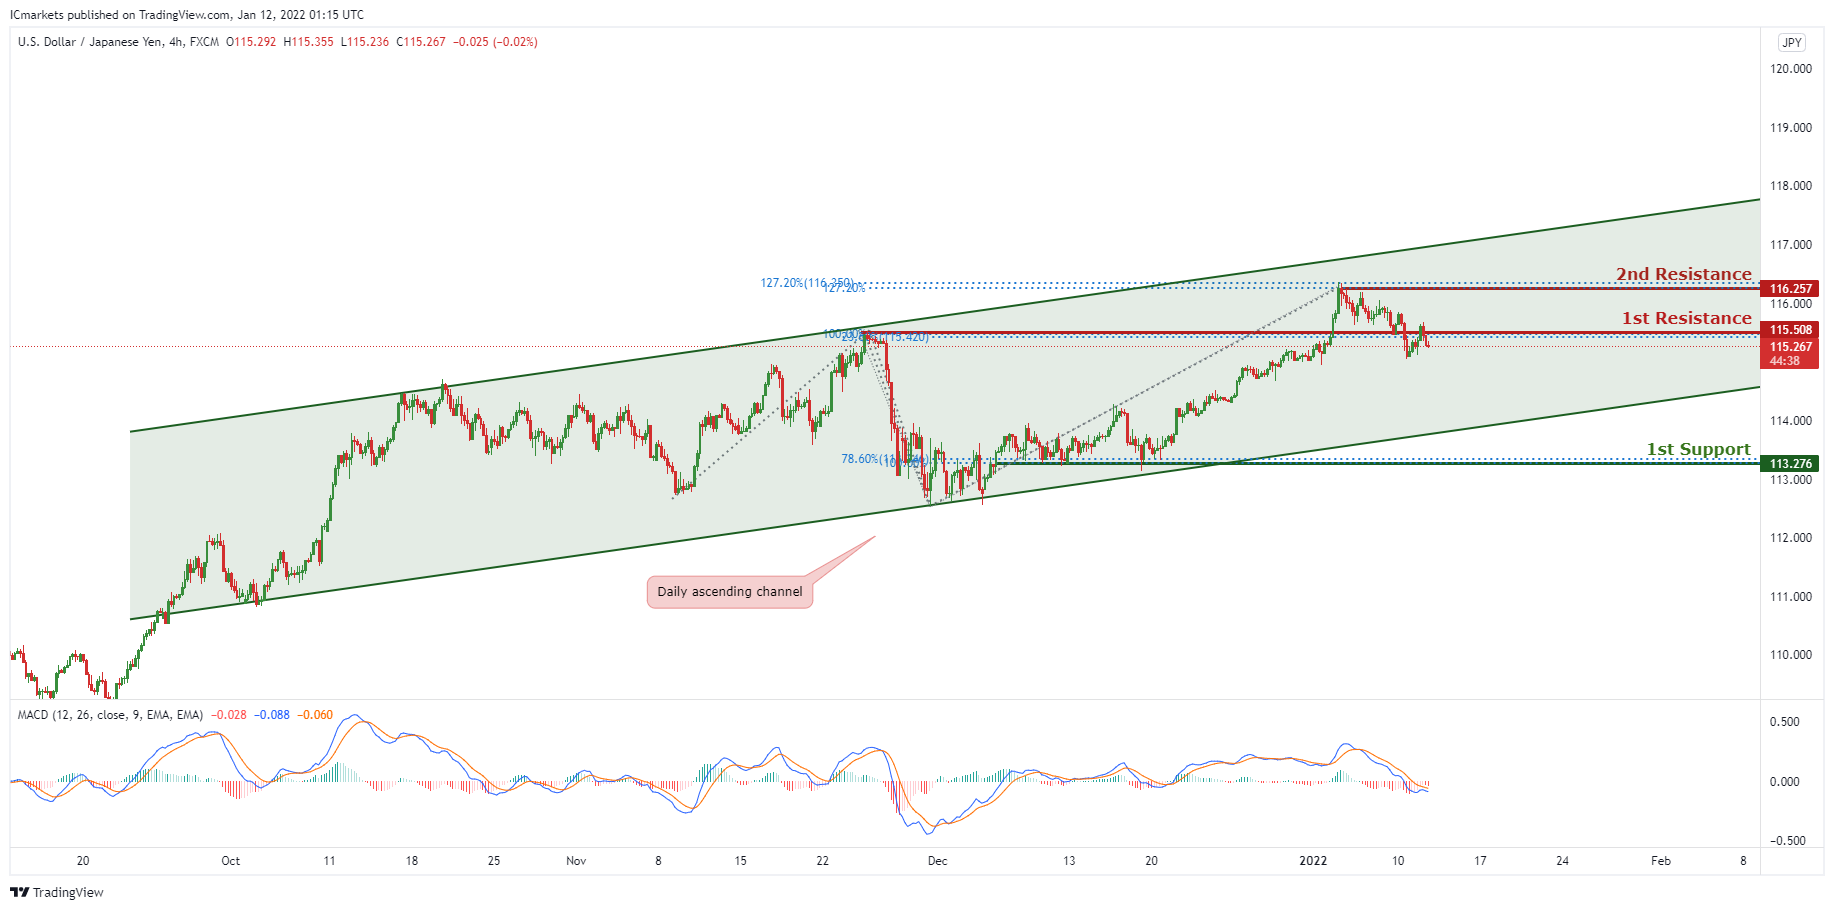
In reference to yesterday’s analysis, price is moving down nicely towards the 1st Support. On the H4 timeframe, is abiding to the ascending channel on the daily, signifying an overall bullish momentum. However, we can expect price to make a short-term bearish drop from 1st Resistance in line with 100% Fibonacci projection and 23.6% Fibonacci Retracement towards 1st Support in line with 78.6% Fibonacci retracement. Our short-term bearish bias is further supported by the MACD indicator where the signal line is above the MACD line.
Areas of consideration:
- H4 1st resistance level 115.508
- H4 1st support level 113.276
AUD/USD:
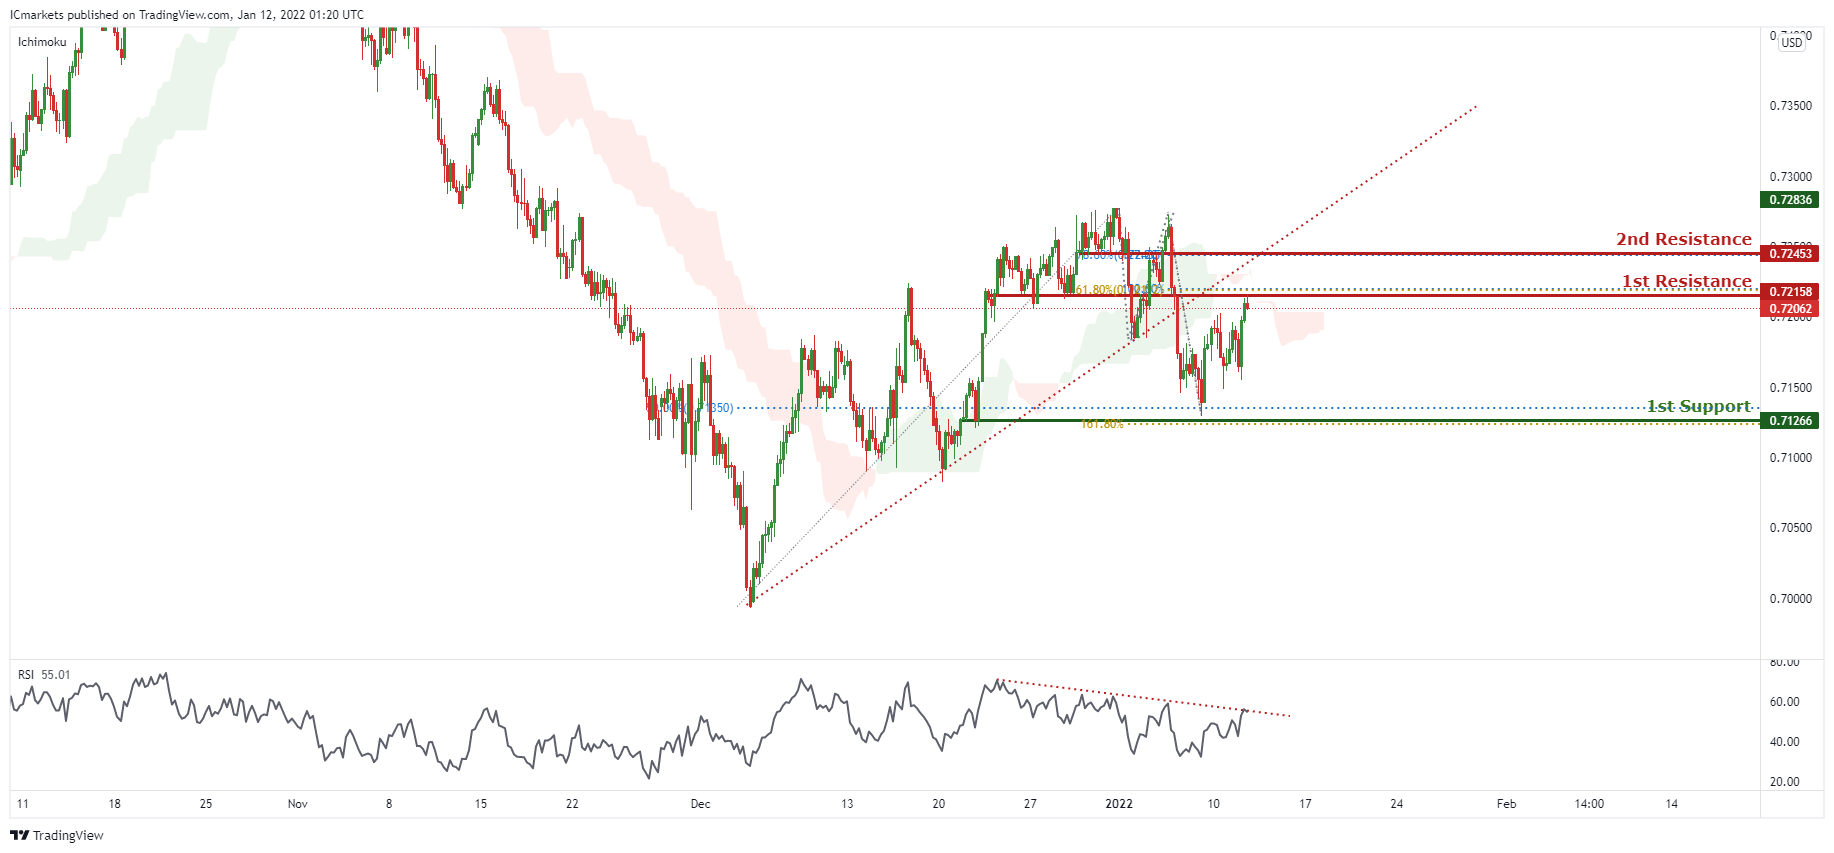
On the H4, price broke out of the ascending trendline support, signifying a bearish momentum. We can expect the price to drop from 1st Resistance in line with 61.8% Fibonacci retracement and 100% Fibonacci projection towards 1st Support in line with 50 % Fibonacci retracement and 161.8% Fibonacci projection. Our bearish bias is further supported by the price holding below the Ichimoku cloud and RSI indicator where it is abiding to the descending trendline resistance. Areas of consideration:
- H4 1st Support level 0.71266
- H4 1st resistance level 0.72158
NZD/USD:
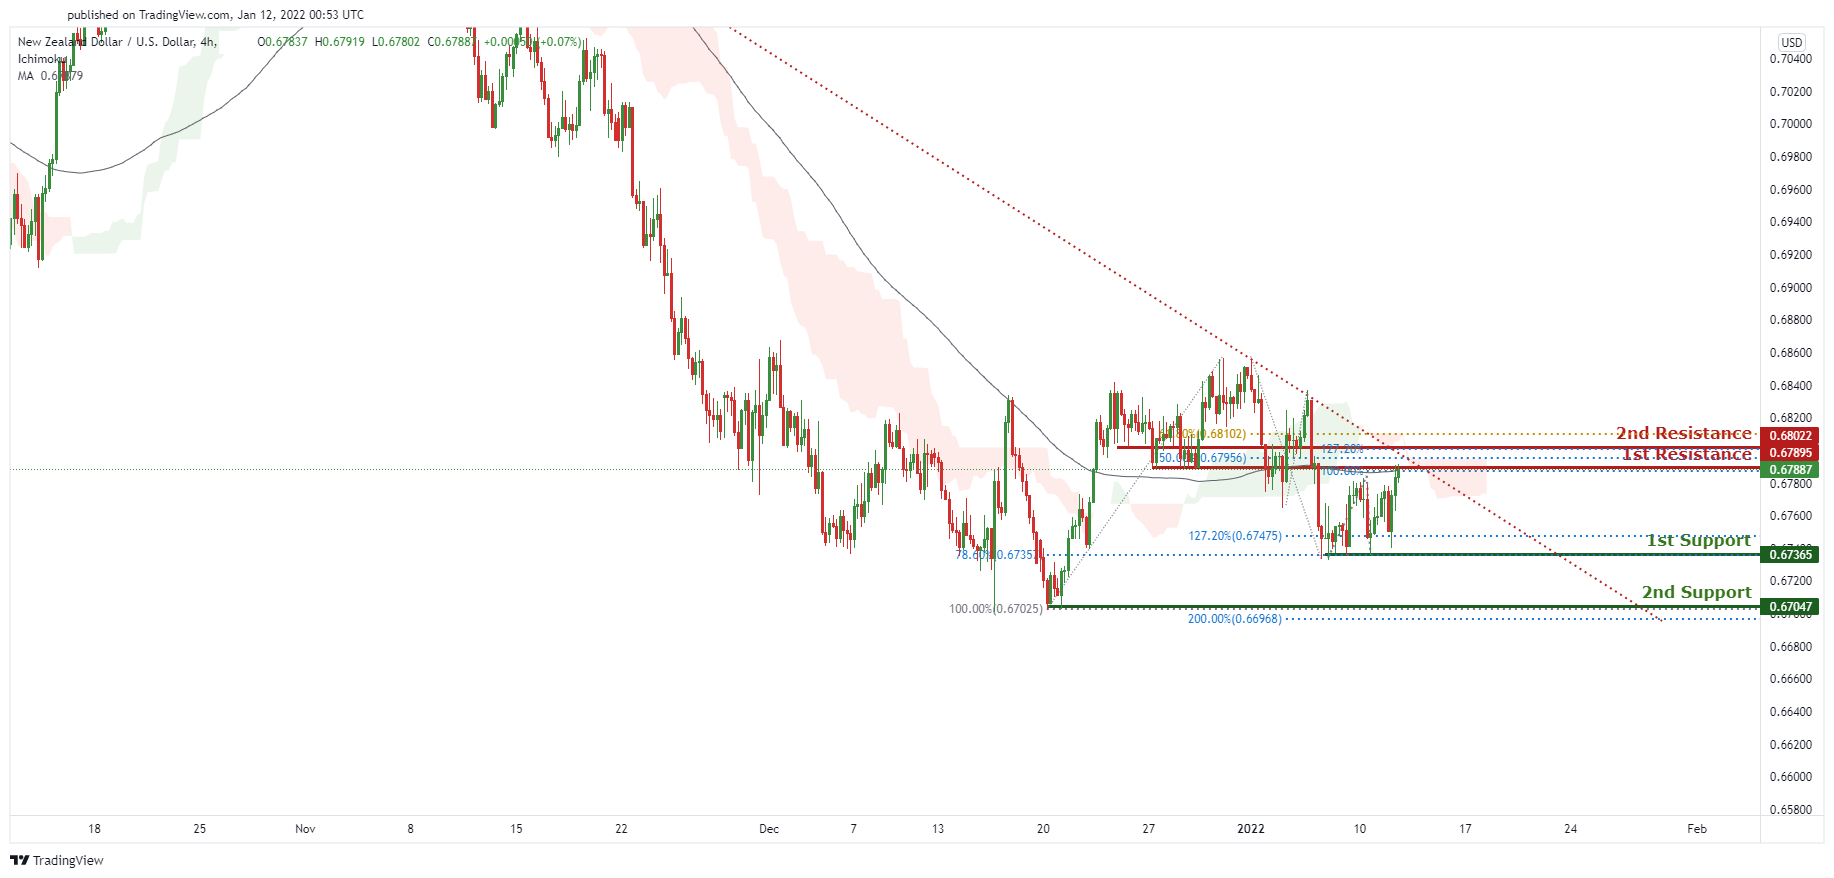
On the H4 timeframe, prices are on bearish momentum and abiding to our bearish trendline. We see potential for prices to dip further from our 1st resistance at 0.67895 in line with 100% Fibonacci extension and 50% Fibonacci retracement towards our 1st support at 0.67365 in line with 78.6% Fibonacci retracements and 127.2% Fibonacci extension. Our bias is further supported by ichimoku clouds forecasting the dip and also prices trading below our MA. If prices break our 1st support, prices can potentially dip towards our 2nd support at 0.67047 in line with 200% Fibonacci projection and 100% Fibonacci retracement.
Areas of consideration:
- H4 time frame, 1st resistance at 0.67895
- H4 time frame, 1st support at 0.67365
USD/CAD:
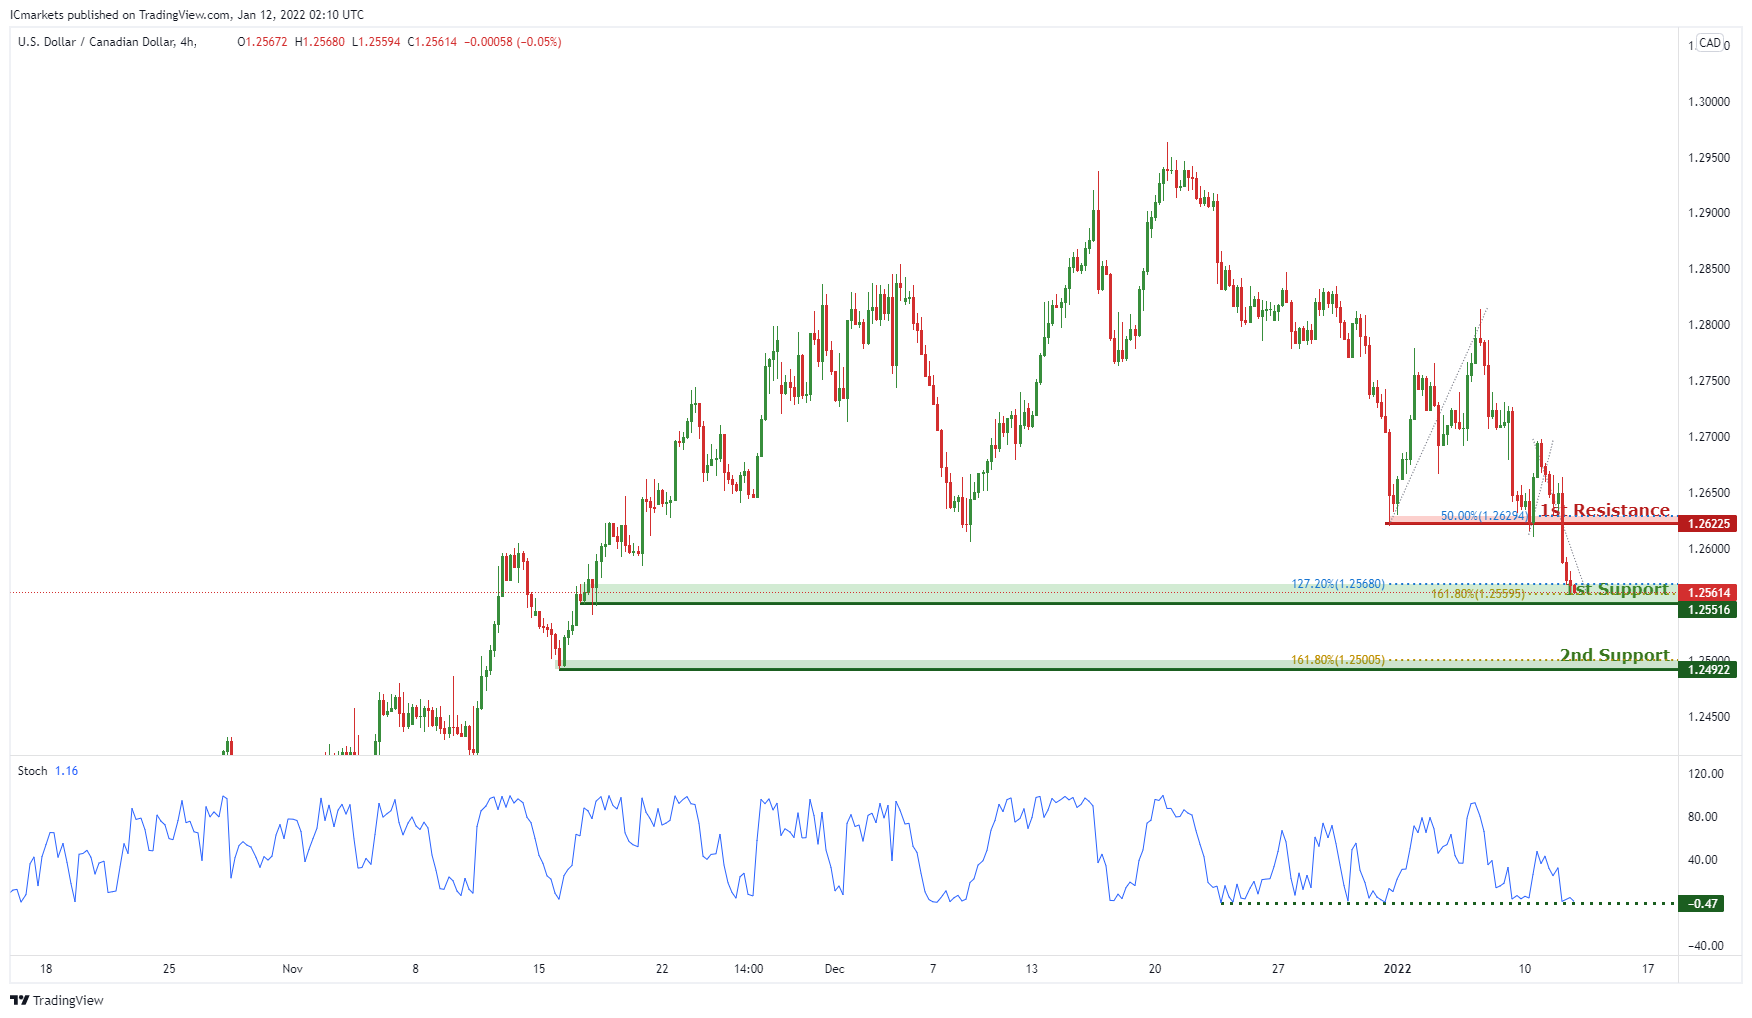
On the H4, with price moving above the ichimoku cloud, we have a bullish bias that price will rise to our 1st resistance at 1.26225 which is in line with horizontal swing high resistance and 50% Fibonacci retracement from 1st support at 1.25516, which is in line with horizontal overlap support and 127.2% and 161.8% Fibonacci extension level. Alternatively, price may break 1st support structure and head for 2nd support at 1.24922, which coincides with horizontal swing low support and 161.8% Fibonacci extension level .
Areas of consideration:
- H4 time frame, 1st support at 1.25516
- H4 time frame, 1st resistance at 1.26225
OIL:
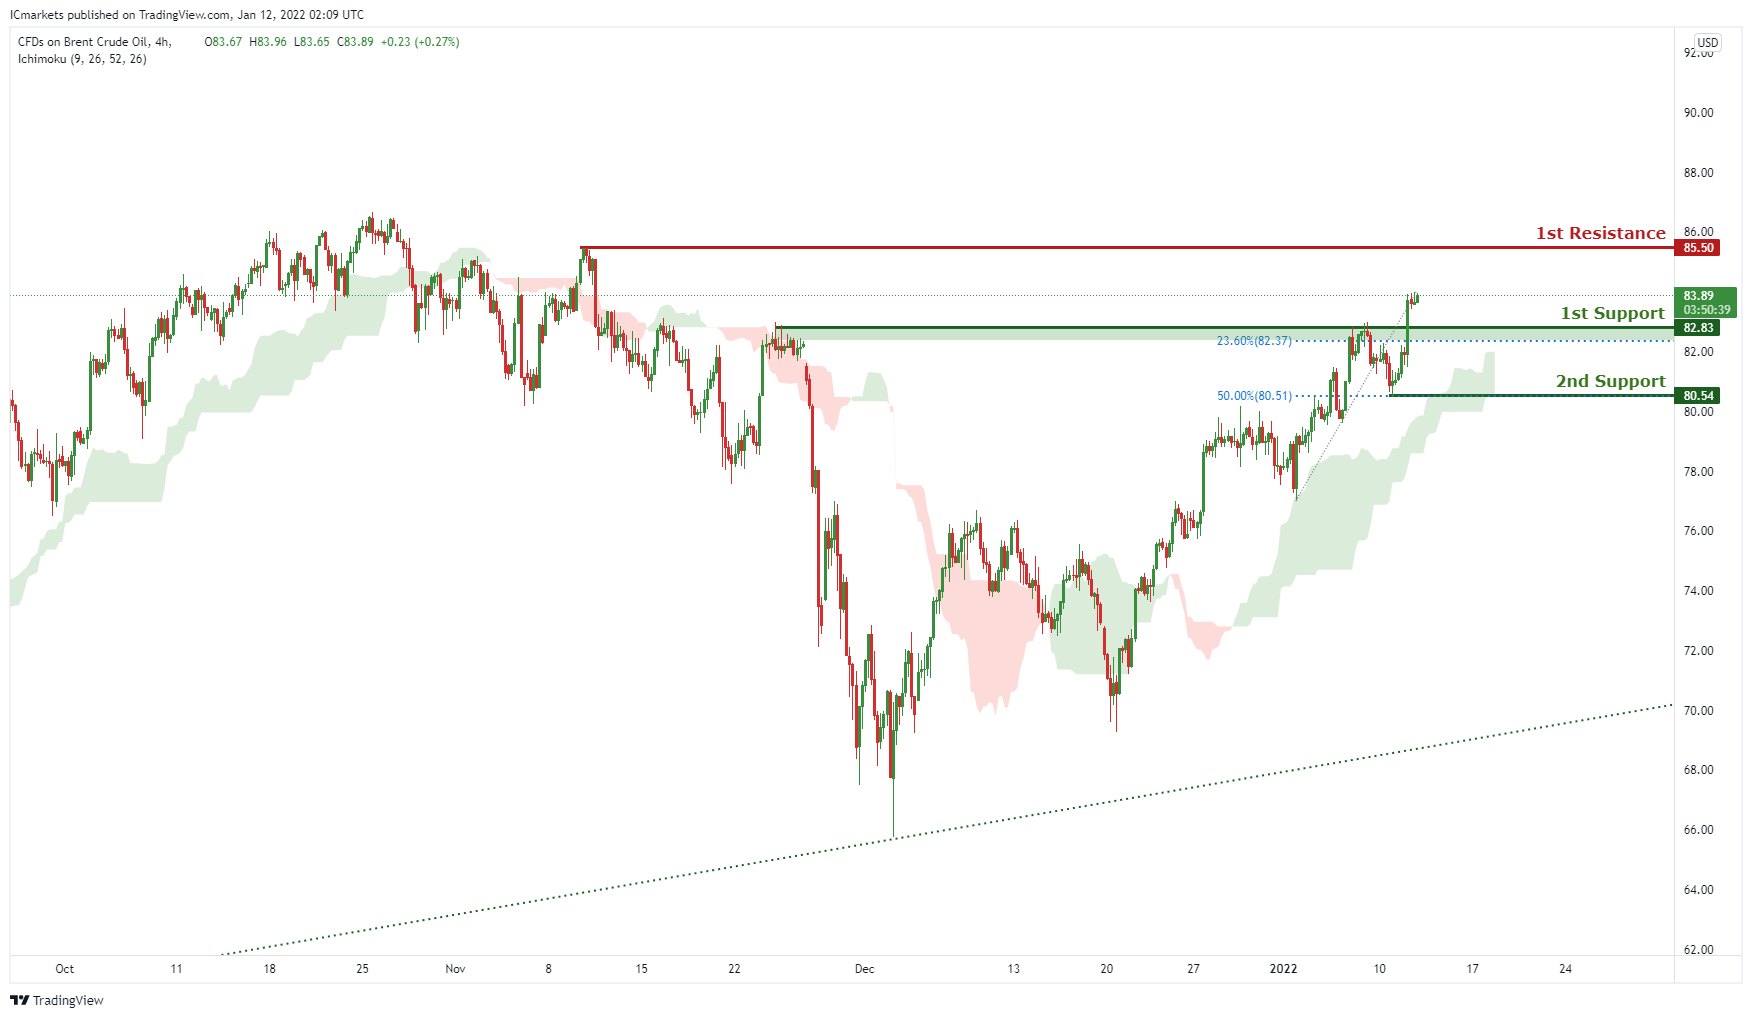
On the H4, with price moving above the ichimoku cloud, we have a bullish bias that price will rise to our 1st resistance at 85.5 which is in line with horizontal swing high resistance from 1st support at 82.83, which is in line with horizontal overlap support and 23.6% Fibonacci retracement level. Alternatively, price may break 1st support structure and head for 2nd support at 80.54, which coincides with horizontal swing low support and 50% Fibonacci retracement level .
Areas of consideration:
- H4 time frame, 1st resistance of 85.5
- H4 time frame, 1st support of 82.83
Dow Jones Industrial Average:
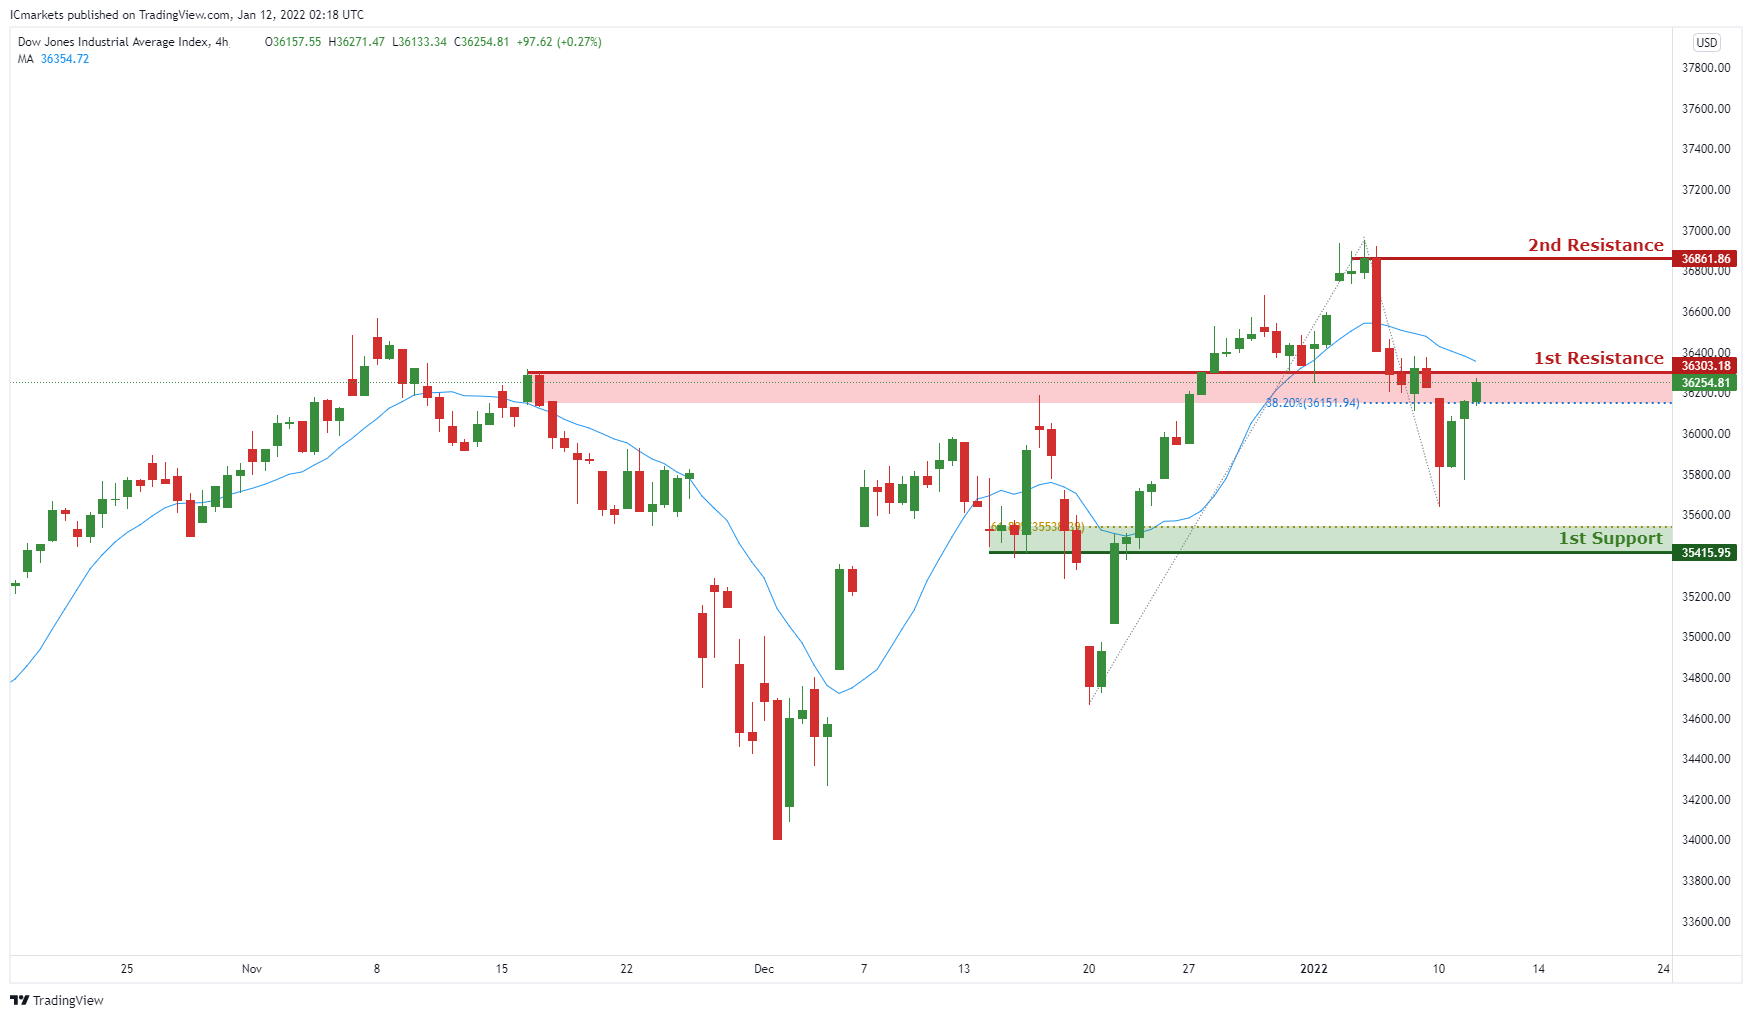
On the H4, with price moving below our moving average, we have a bearish bias that price will drop from our 1st resistance at 36303 which is in line with horizontal swing overlap resistance to 1st support at 35415, which is in line with horizontal overlap support and 61.8% fibonacci retracement. Alternatively, price may break 1st resistance structure and head for 2nd resistance at 36861, which coincides with horizontal swing high resistance.
Areas of consideration:
- H4 time frame, 1st resistance of 36303
- H4 time frame, 1st support of 35415
Jerome and the Three Bears
Federal Reserve Chairman Jerome Powell, testifying at his confirmation hearing on the Hill, soothed markets overnight in a performance worthy of Goldilocks and the Three Bears. Mr Powell noted that the Fed could hike rates to rein in inflation, intended to start the balance sheet run-off sooner rather than later, but also said inflationary pressures would peak mid-year. What he didn’t say was also important. He didn’t back four rate hikes in 2022, nor a March start to hikes, nor did he give any details on when the Fed balance sheet run-off would start.
It was a masterful performance really, leaving the bowls neither too full nor too shallow; but just right from the financial market’s perspective. Ignoring recent comments from hawkish FOMC members while reinforcing that the Fed has likely accomplished its employment objective and was well aware of the inflation one. Certainly, if Mr Powell believes inflation will peak in H2 2022, there seems no need for a panicked start to hikes in March, let alone four of them. If anything, that the Fed has shown over the past two years, it is an abundance of caution and patience.
That was enough to unleash the buy-the-dip gnomes, who had been straining at the leash these past few sessions. Equities rallied, oil rallied, US yields fell, the US Dollar fell, and even gold rallied. As goldilocks as it gets. Even if the Fed hikes to 1.0%-1.25% this year, real US yields will still be very negative. Hardly corporate finance Armageddon. The music can still play in equity markets in 2022, it's just that we’ve likely seen the best of the technology gains, and markets will see a lot more two-way price action to keep them honest. Nor am I ruling out a 10-15% drop in US markets and other Caligula’s of Valuations, they would still be comfortably in a longer-term bullish uptrend.
Today has seen a few data releases from Asian heavyweights China, South Korea, and Japan. All of which sounded cautious notes for varying reasons. China’s YoY Inflation Dec came in at 1.50% vs 1.80% exp. South Korean Unemployment crept higher unexpectedly to 3.80%. In both circumstances, the blame can be laid on omicron restrictions crimping domestic economic activity. Cases are quietly climbing in Mainland China and Hong Kong, along with widening restrictions, and with Covid-zero policies in place, omicron presents a serious growth risk to China if it fully jumps the fence.
Conversely, Japan’s Reuter’s Tankan Index fell to 17.0 for January from 22.0 in December as Japanese businesses grappled with rising prices. That’s correct, your eyes are not deceiving you. Japanese businesses are grappling with rising prices and may have to raise prices. That will be a 30-year shock to the system but don’t expect any action from the Bank of Japan. The pandemic may have finally done the job that the Ministry of Finance and bank of Japan spent decades failing at.
India releases inflation later this evening and there are definite upside risks to the expected 5.80% print. Throw in rising omicron cases into a low vaccination population, and new social restrictions in cities such as New Delhi, and the ingredients are there for a stagflationary surprise. A high inflation print tonight will do the INR and Sensex no favours tomorrow.
We also get German Wholesales Prices and Eurozone Industrial Production this afternoon, but the main event will be the US Headline and Core Inflation YoY for December, expected at 7.0% and 5.40% respectively. Although Mr Powell managed to goldilocks the market overnight, keeping his three bears at bay, if US inflation tops 7.0% this evening, all his good work could be undone.
Asian equities jump on Wall Street rally.
The soothing words of Jerome Powell overnight unleashed anxiously waiting, but side-lined buyers, resulting in a strong overnight recovery by Wall Street. The S&P 500 rallied 0.92%, the Nasdaq leapt higher by 1.41%, and the Dow Jones rose 0.52%. In Asia, futures on all three have held steady.
Asian markets have coat tailed the New York rally and moved higher today. Notably, those that have struggled as the Nasdaq fell over the past few seasons. The Nikkei 225 has jumped 1.75% higher in response, with the South Korean Kospi rallying 1.15%, and Hong Kong also leaping 1.75% higher.
Mainland China’s Shanghai Composite has drifted 0.15% higher, with the more growth-centric CSI 300 climbing by 0.45%. Singapore and Taipei have drifted 0.15% higher, while Jakarta has gained 0.45%, and Kuala Lumpa and Manilla are unchanged. Australia’s ASX 200 and All Ordinaries have added 0.45% today.
The broader rally has favoured more value-centric markets with a heavier correlation to the Nasdaq today. As such, I am not expecting fireworks from Europe when it opens, having enjoyed a good season with the US overnight. The US inflation data will be the next hurdle for the equity rally continuance. Above 7.0% likely brings the inflation trade back, limiting gains, while a sub 6.50% headline should keep the party going as Fed hiking timetables get reset back to mid-year.
Risk sentiment recovery pushes US Dollar lower.
The Powell-inspired risk sentiment rally overnight saw US yields edge lower and weighed heavily on the US Dollar, which staged a broad retreat. The dollar index fell 0.36% to 95.60, just above support at 95.50. The US inflation data tonight will either confirm a period of US Dollar weakness or result in a nasty whipsaw price action. In the meantime, I wait patiently for a daily close above or below 95.50 or 96.50 to signal the US Dollar’s next directional move.
EUR/USD and GBP/USD gained around 0.40% to 1.1370 and 1.3640, where they remain unchanged in Asia. EUR/USD’ needs to close above 1.1400 to lessen the bearish outlook. However, GBP/USD has closed above 1.3600 and should now target 1.3800 in the days ahead, partying like some private drinks at 10 Downing Street. USD/JPY is steady at 115.25 but remains a bid on dips into 115.00 as long as US yields remain at these levels.
AUD/USD and NZD/USD are unmoved in Asia after edging higher to 0.7210 and 0.6790. Both continue to be bounced around on RORO (risk-on, risk-off) sentiment swings, but ultimately, are range-trading right now. The moves higher overnight weren’t overly convincing suggesting nerves ahead of US inflation data tonight. Key levels for AUD/USD are 0.7150 and 0.7300, and 0.6700 and 0.6850 for NZD/USD.
USD/CAD tumbled 0.85% to 1.2570 overnight and has activated a hand-and-shoulders formation after closing below the neckline at 1.2630. The reasons for the Canadian Dollar rally still elude me but I will respect the technical picture. That now suggest USD/CAD can fall to between 1.2300 and 1.2360 in the days ahead.
USD/Asia softened overnight, with regional currencies strengthening slightly as Jerome Powell took the wind out of the Fed tightening trade. USD/KRW has fallen to 1190.00, USD/PHP to 51.00, while USD/MYR has eased to 4.1790, and USD/THB to 33.369. USD/CNY and USD/CNH remain just below the key pivot level at 6.3800, trading at 6.3650 and 6.3700 respectively today. which is becoming a key pivot point now. Activity is muted in Asia with the region clearly waiting for US inflation data tonight before deciding its next moves.
Oil prices leap higher after Powell testimony.
Oil prices rocketed higher overnight as the Powell testimony removed the threat of early rate hikes, for now, allowing the fundamentals of constrained OEPC+ production, and an omi-gone variant recovery, to reassert themselves with a vengeance. Brent crude rocketed 3.25% higher to $83.60 a barrel, while WTI leapt 3.65% higher to $81.25 a barrel. Both contracts have firmed slightly in Asia to $83.80 and $81.45 a barrel respectively.
This sets the scene for more gains in the week ahead, having traded sideways the past few sessions as equity markets have corrected lower. It seems that even the threat of faster tightening by the Fed over the past few days couldn’t undermine oil prices, and if US inflation is lower than 6.50% tonight, after the Powell comments overnight, then oil prices should continue rising. Assuming China doesn’t suffer a sharp slowdown, that omicron actually becomes omi-gone, and with OPEC+’s ability to raise production clearly limited, I see no reason why Brent crude cannot move towards $100.00 in Q1, possibly sooner. Having said that, I acknowledge there are plenty of variable outcomes in the previous sentence, the biggest threat being omicron in China, India, and Indonesia.
In the nearer term, Brent crude has support at $83.00 and $81.00 a barrel, with resistance at $86.00 a barrel. WTI has support at $80.50 and $78.50 a barrel, with resistance at $82.00 and 85.00 a barrel. One note of caution is that both Relative Strength Indexes (RSIs) are moving towards overbought. That could limit oil’s gains for the rest of the week and could signal a short-term correction but won’t change the underlying bullish outlook.
Gold rallies in Asia.
Gold saw the fast-money buyers return overnight as the Fed tightening trade was stopped in its tracks by Jerome Powell’s testimony. That pushed gold 1.10% higher to $1821.50 an ounce. As ever, I believe the rally should be taken with a huge grain of salt, as past price action suggests gold will fall just as quickly at the first sign of stalling momentum. A higher US inflation print could create that situation tonight.
Gold has edged lower to $1819.00 an ounce in Asia and has resistance just above at $1823.50, and $1830.00 an ounce. Support lies at $1800.00, followed by $1785.00 and $1780.00 an ounce.
US Inflation in Focus as Traders Price Faster Fed Hikes
The latest US inflation data will be published on Wednesday at 13:30 GMT, ahead of the retail sales report on Friday. Consumer prices are expected to have risen at the fastest clip in 40 years, which could seal the deal for a Fed rate hike in March. That said, there is scope for disappointment in the spending numbers, so it could be a rollercoaster ride for the dollar.
Fed gets rolling
The US economy is firing on all cylinders. Consumption has been incredibly strong, economic growth in the last quarter is seen at 6.8% according to the Atlanta Fed’s GDPNow model, and the labor market is approaching full employment with impressive speed.
Most importantly, wage growth has fired up. When the Fed sees a tight labor market and accelerating wages, the conclusion is that this could lead to a wage-price spiral that feeds inflationary pressures. Since inflation is extremely hot already, Fed officials want to avoid that outcome. The solution is to tighten monetary policy.
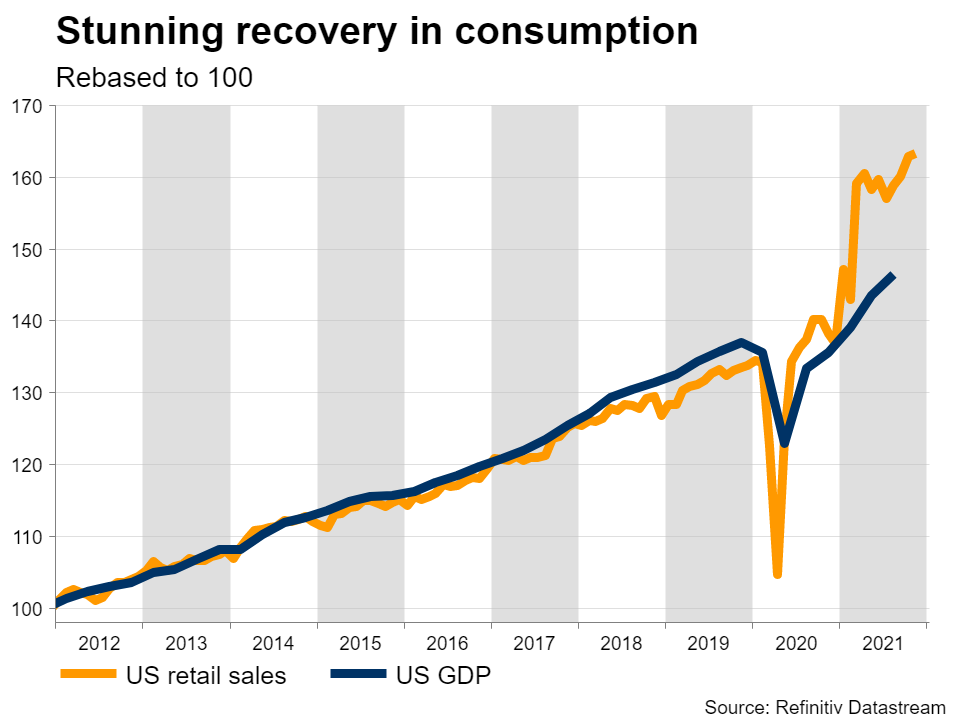
As such, traders have brought forward the expected timing of Fed rate increases lately. The implied probability for a rate hike in March currently stands at 90%. In total, markets are pricing in three rate increases this year and equal odds for a fourth one.
Inflation to heat up
On the data front, forecasts suggest the annual CPI inflation rate hit 7% in December, up from 6.8% in November. The core rate that strips out volatile items like energy and food is expected to have risen to 5.4%, from 4.9% previously.
These projections are supported by the Markit PMI surveys, which showed that selling prices by companies “rose steeply”, although at the slowest pace in three months. That’s in line with the forecasts for the monthly CPI print.
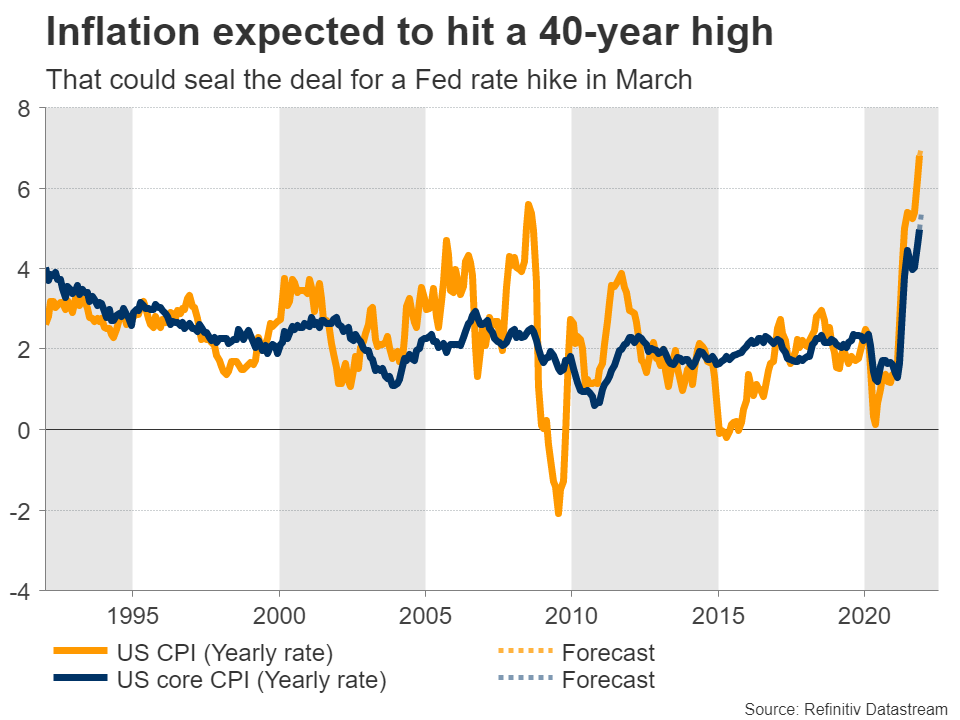
Turning to retail sales, the tea leaves point to disappointment. The retail control group - which is used in GDP calculations - is expected to have risen by 0.1% on a monthly basis. However, credit card spending data from Bank of America and JP Morgan suggest a far weaker number, possibly negative, as worries around Omicron dampened consumption.
Dollar rollercoaster ahead
As for the dollar, it could be a volatile week. A strong inflation report may seal the deal for a rate hike in March and boost the reserve currency, before a potential disappointment in retail sales wipes out some of the gains.
In the bigger picture, the outlook remains bright over the next few months. The economy is booming and there’s still room for markets to price in a fourth rate increase for this year. Beyond rate hikes, the Fed’s plans about shrinking its balance sheet could be an additional force that supports the dollar against low-yielding currencies like the yen.
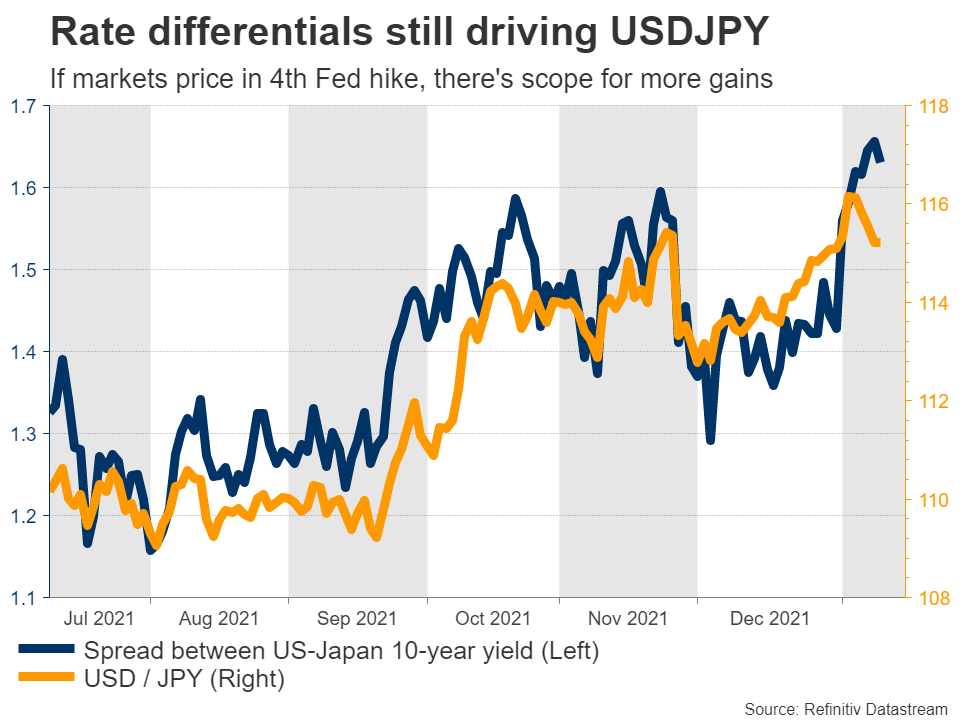
The main risk to this view would be any signs that inflation has peaked moving forward. If investors sense the heydays of inflation are behind us now that energy prices are stabilizing and government spending is fading, they could dial back bets for Fed tightening. But that’s probably a story for April or later, as that’s when the year-over-year comparisons in inflation become much tougher.
Taking a technical look at dollar/yen, if the bulls manage to pierce above the 5-year high of 116.30, the next barrier to provide resistance may be 117.80, which was the inside swing high of December 2016.
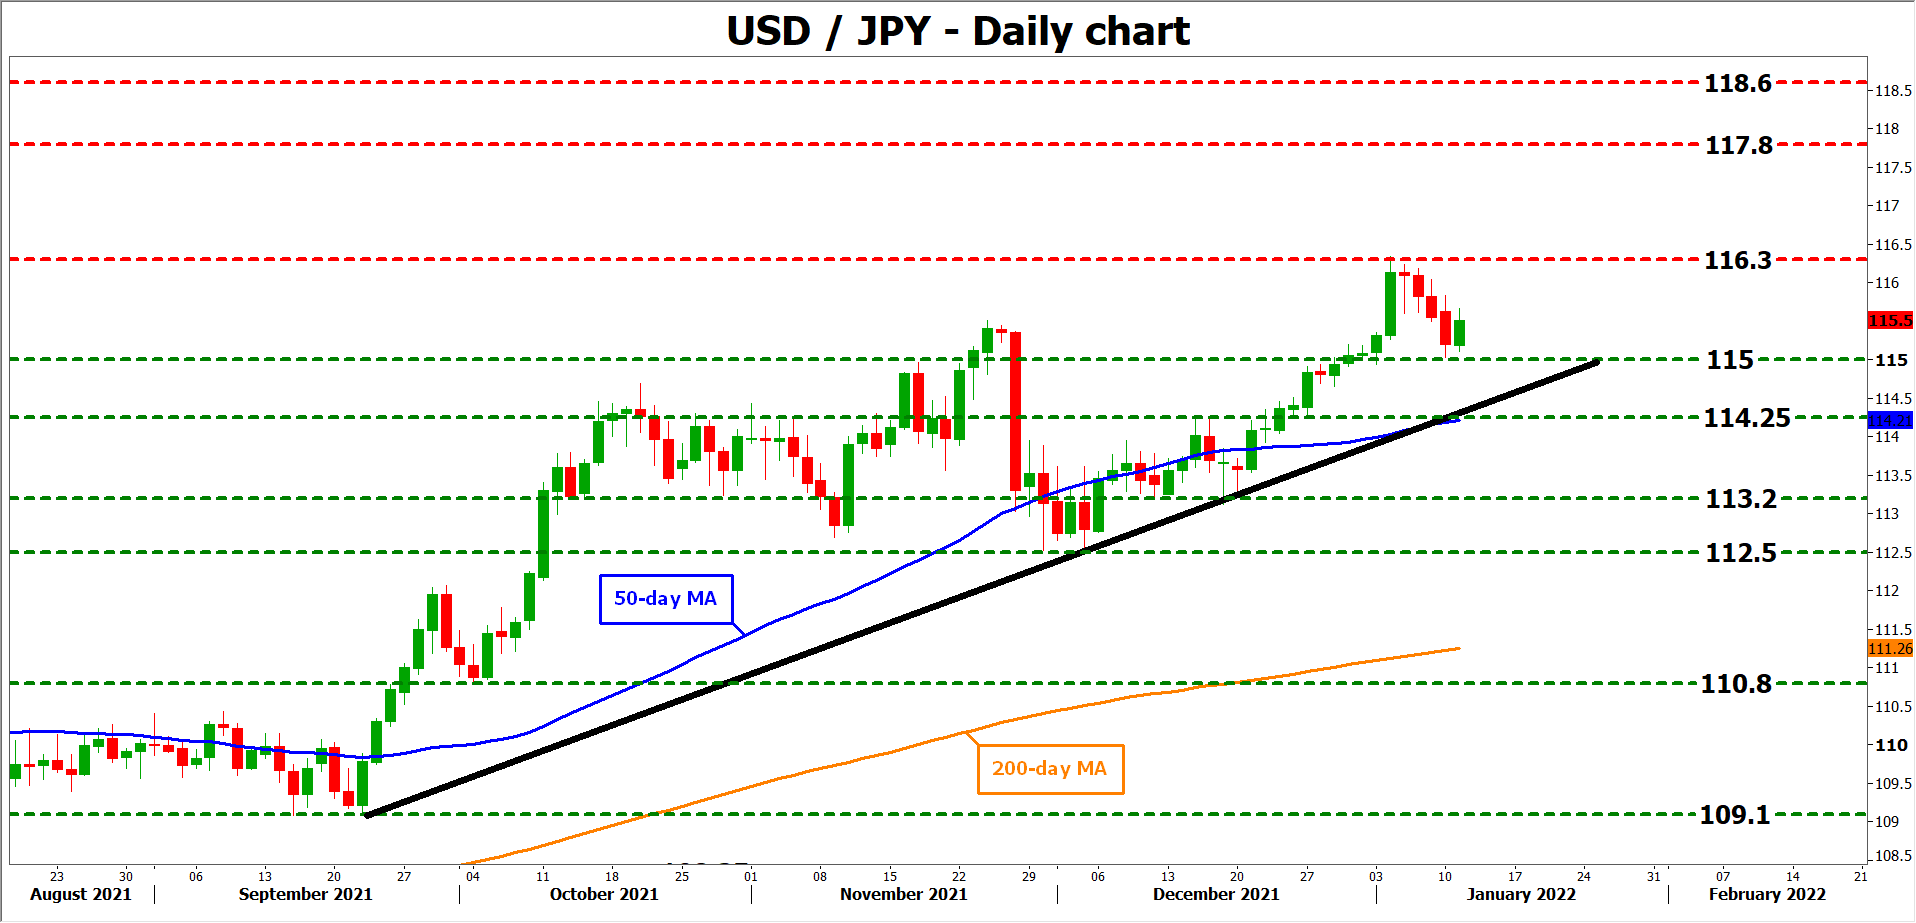
On the downside, initial support to declines may be found at 115.00. A potential violation would turn the focus to 114.25, a region that overlaps with the 50-day moving average and the uptrend line drawn from the September lows.
AUD/USD Faces Key Resistance at 0.7200, US CPI Next
Key Highlights
- AUD/USD started a downside correction from 0.7270.
- It traded below a key bullish trend line with support near 0.7200 on the 4-hours chart.
- EUR/USD is still struggling below 1.1380, and GBP/USD is trading well above 1.3500.
- The US CPI could increase 7% in Dec 2021 (YoY), up from 6.8%.
AUD/USD Technical Analysis
This past week, the Aussie Dollar attempted an upside break above 0.7250 against the US Dollar. However, AUD/USD struggled near 0.7270 and recently corrected lower.
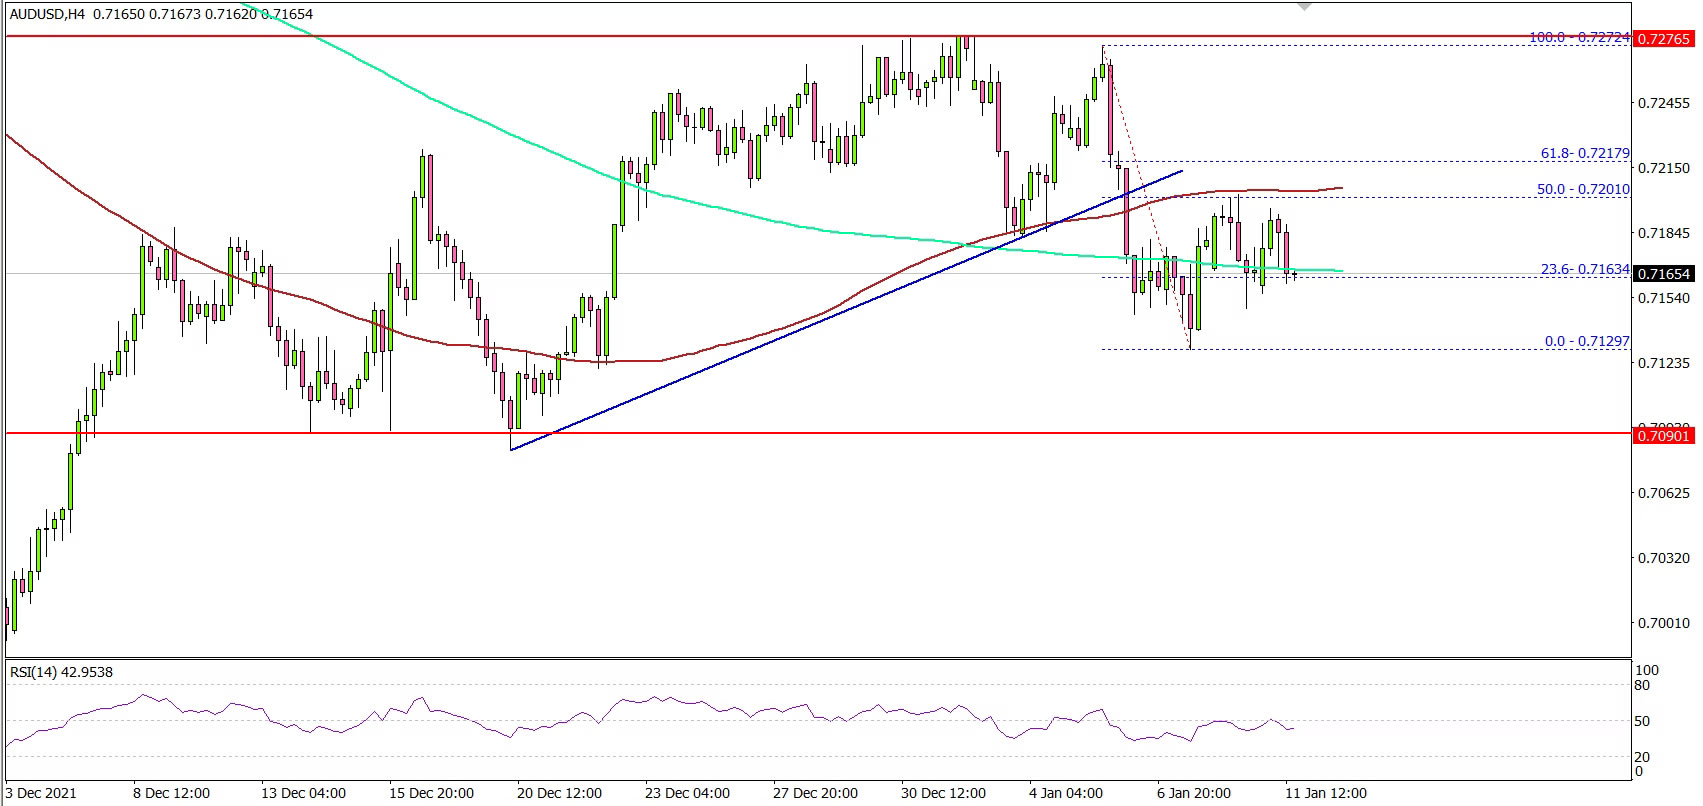
Looking at the 4-hours chart, the pair traded as high as 0.7272 before correcting lower. There was a break below the 0.7220 and 0.7200 support levels. Besides, there was a break below a key bullish trend line with support near 0.7200 on the same chart.
The pair even spiked below the 100 simple moving average (red, 4-hours) and the 200 simple moving average (green, 4-hours). A low was formed near 0.7129 and the pair is now consolidating.
On the downside, there is a decent support forming near 0.7125. The main support is forming near the 0.7090 level, below which the pair could drop to 0.7000.
On the upside, the pair is facing resistance near 0.7200 level and the 100 simple moving average (red, 4-hours). The next major resistance is near the 0.7220 level, above which the pair could revisit 0.7270.
Looking at EUR/USD, the pair is still struggling to gain pace above the 1.1380 zone. Besides, GBP/USD is trading in a positive zone above 1.3500.
Economic Releases
- US Consumer Price Index for Dec 2021 (MoM) – Forecast +0.4%, versus +0.8% previous.
- US Consumer Price Index for Dec 2021 (YoY) – Forecast +7.0%, versus +6.8% previous.
- US Consumer Price Index Ex Food & Energy for Dec 2021 (YoY) – Forecast +5.4%, versus +4.9% previous.
NZDCHF Wave Analysis
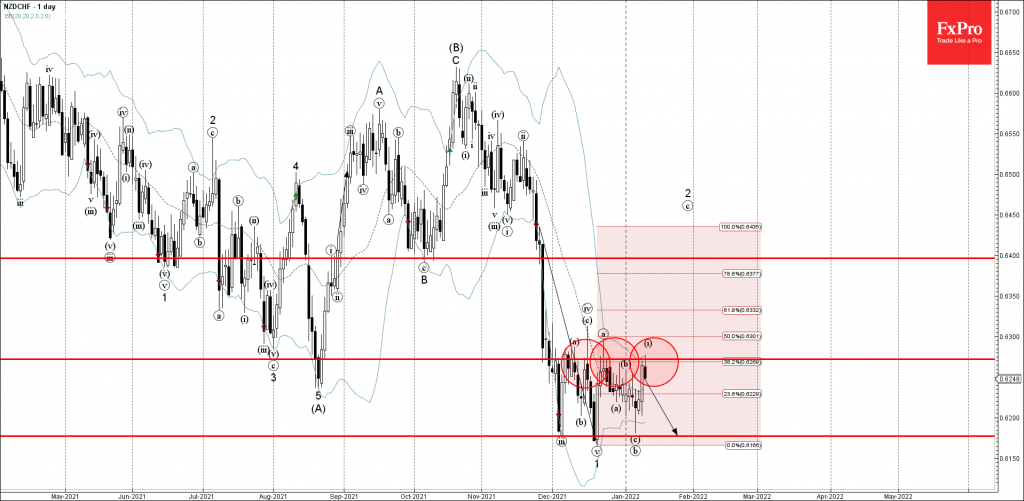
- NZDCHF reversed key resistance level 0.6275
- Likely to fall to support level 0.6177
NZDCHF recently reversed down from the powerful resistance level 0.6275 (which has been reversing the price from the start of December), intersecting with the upper daily Bollinger Band and the 38.2% Fibonacci correction of the downward impulse from November.
The downward reversal from the resistance level 0.6275 stopped the earlier short-term impulse waves (i).
Given the strength of the resistance level 0.6275 – NZDCHF currency pair can be expected to fall further toward the next support level 0.6177 (low of the previous waves (iii), 1 and (b)).
Rally Is Not Over For Risk Assets
What is happening?
In December 2021, the main question on global markets was: “When will the FED increase the key rate?” Traders and investors were transferring their capitals into USDs, waiting for the great dump worldwide. Today, many of the “growth stocks” lost more than 50% from their highs. Since November, Bitcoin has plunged by 40%. The US indices are once again trading around the bottom border of the rising global channel.
Will this bearish trend continue, or have we already found the bottom for the next couple of months?
FBS analysts’ opinion
We believe that market members have overestimated tapering risks, and right now is the perfect moment to look for long traders in risk assets.
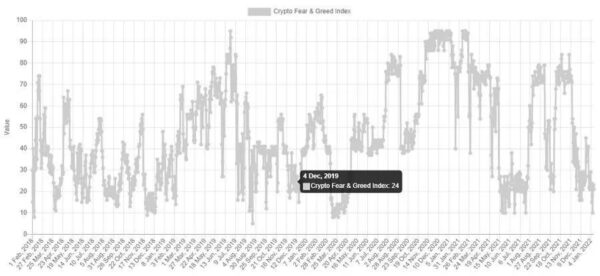
For example, according to the Fear & Greed index, Bitcoin has already found its global support. If you look at the picture below, you will realize Bitcoin reverses every time the crypto market’s F&G index hits 10.
BTC/USD daily chart
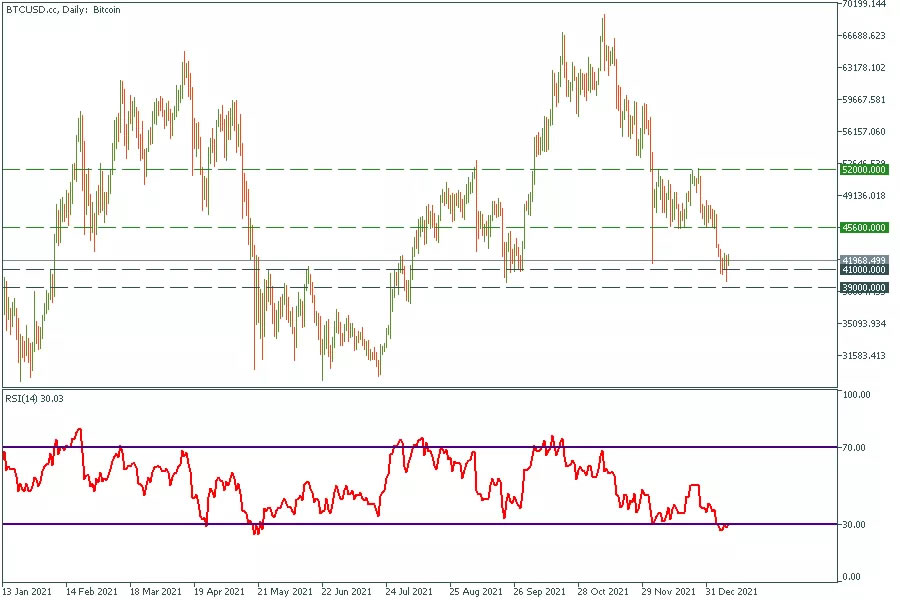
The price has reached a powerful range between $39 000 and $41 000. We can notice that the price has always reacted to these levels, so there is no doubt that the pullback will happen this time. The target for this movement is $45 600. Unfortunately, if bears can drag Bitcoin under $39000, the price will head towards $30 000.
US500 daily chart
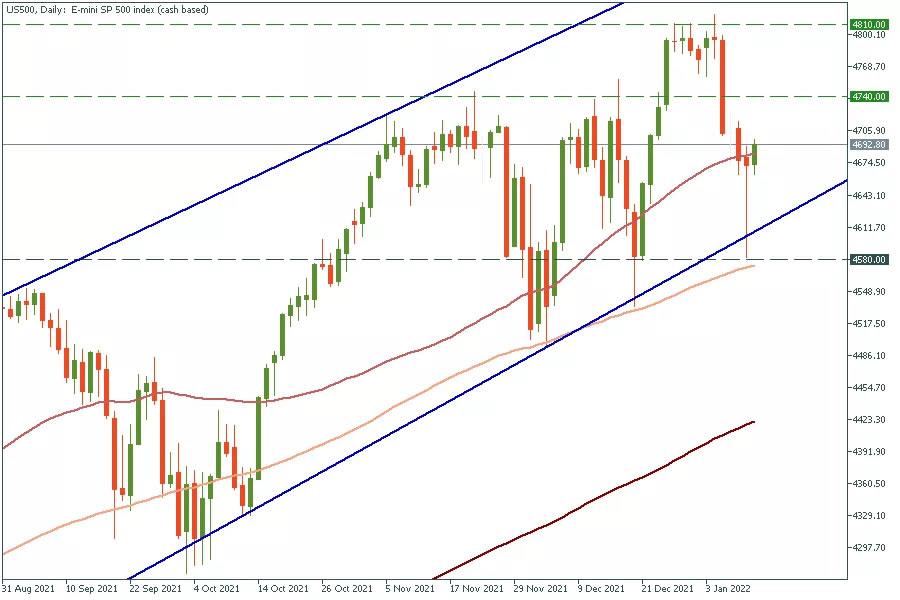
The US500 bounced off the bottom line of the global ascending channel again. The 100-day moving average is still an insurmountable barrier for sellers. We expect the US500 to renew its all-time high by mid-February. As soon as the price breaks through 4810, it will head towards 4870.
US100 daily chart
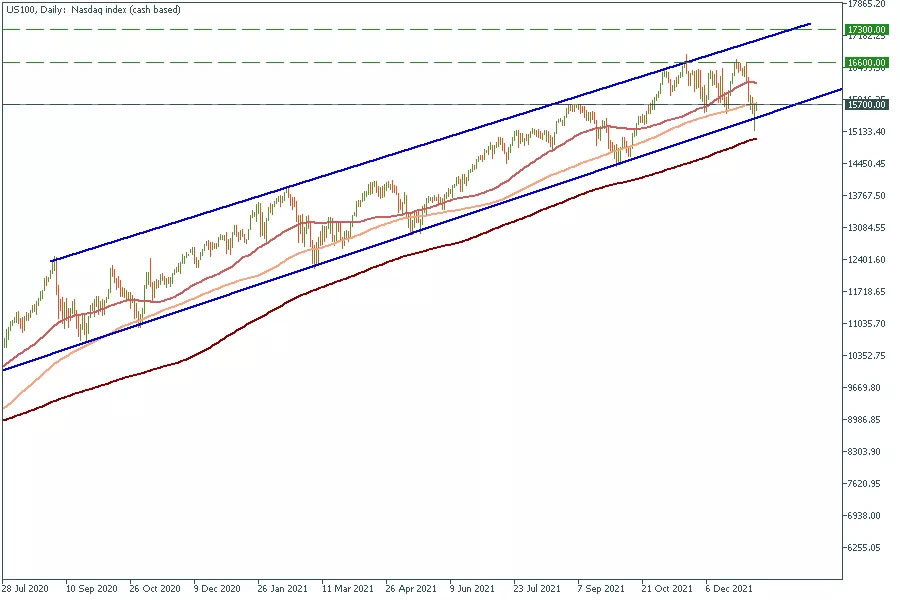
The US100 index has also bounced off the global trend line. The triple bottom pattern has appeared on the chart. As soon the price breaks through 16 600, it will reach 17 300.
NAS100 – Correction Complete?
Or further to go?
It’s been a shaky start to the new year, with interest rate anxieties dragging on sentiment and hitting the NAS100 particularly hard.
The index fell more than 8% over the last week, breaking through key support in the process which could have led to a much deeper correction. Instead, the index bounced strongly in the final hours of trading on Monday and failed to close below the rising channel.
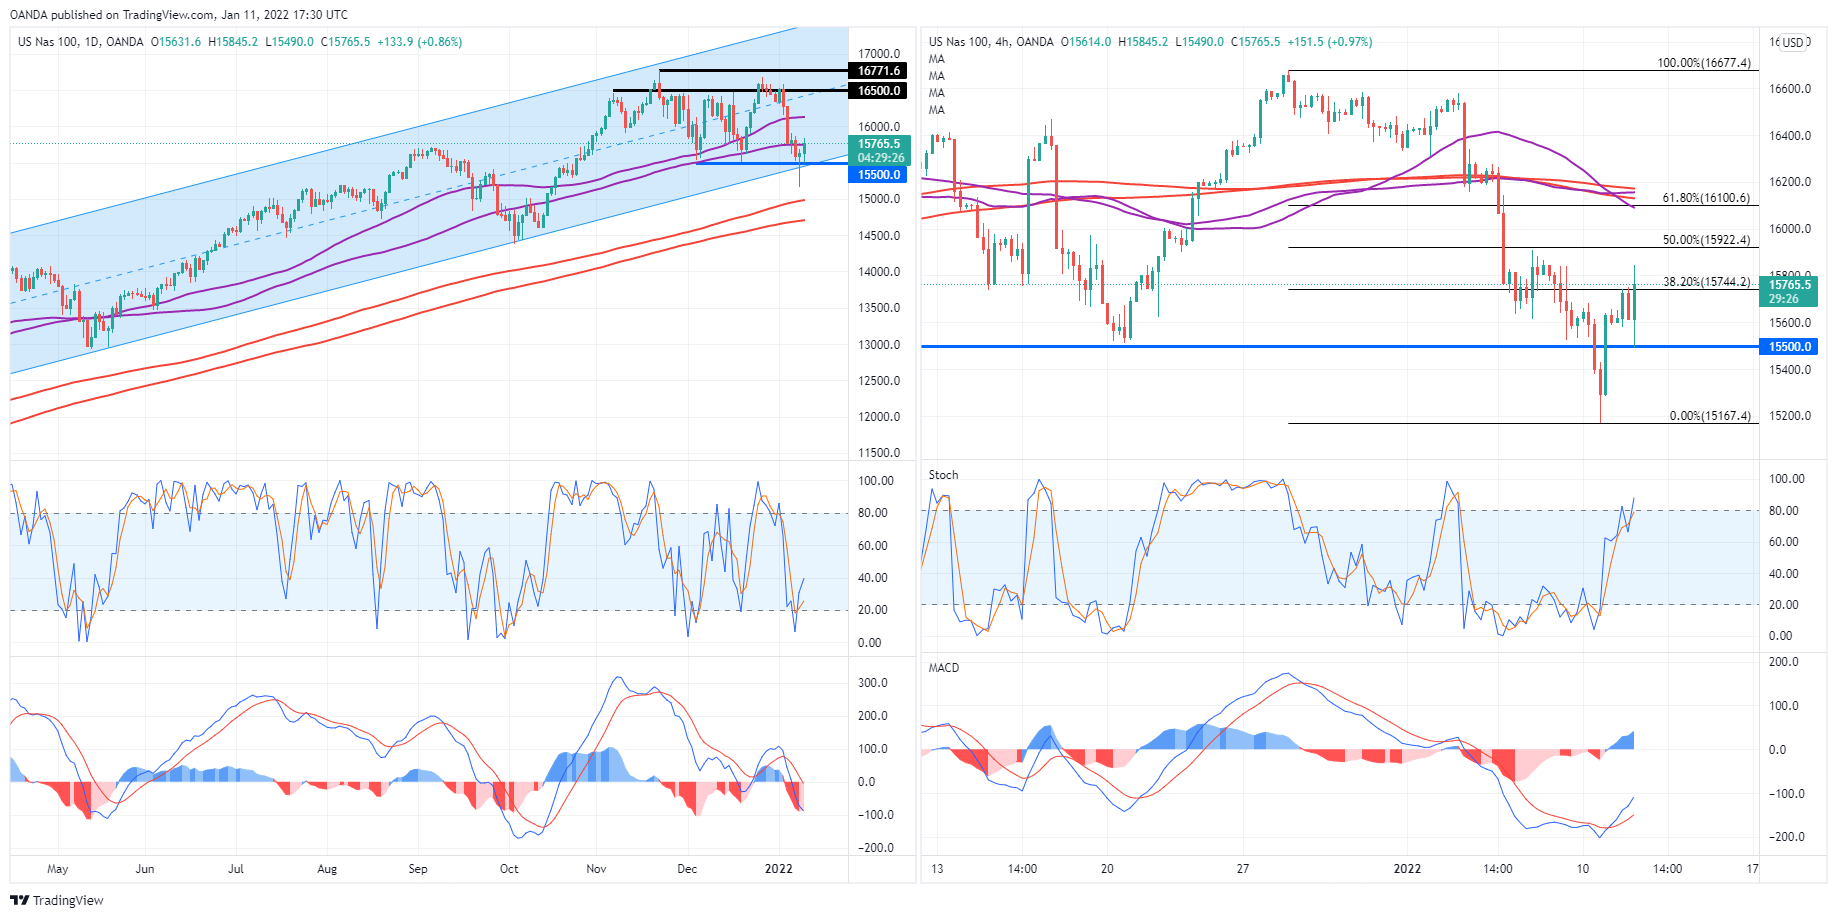
While a deeper correction could still be on the cards, the false breakout – as it now appears to have been – could signal the end of the panic in tech stocks.
If the index can overcome a few key tests above – potentially aided by earnings season which is about to get underway – it could continue the trend we’ve seen since the lows of March 2020.
The first test is around 15,900-15,922, where prior resistance combines with the 50% Fibonacci retracement level. Above here, around 16,100-16,150 will be interesting, combining the 50/89-day SMA band, with the 61.8 fib and the 55/89 and 200/233-period SMA bands on the 4-hour chart.
A move above here could see the NAS100 gather pace to the upside.
Eco Data 1/12/22
[php_everywhere instance="1"]
Fed Powell renomination hearing live stream
https://www.youtube.com/watch?v=0a8j1Tgdg2k