

Sample Category Title
Oil Slides On Covid, Gold Edges Up
Oil in full retreat in Asia
Oil prices have gapped lower in Asia as the South African variant sparks growth fears, sending a wave of selling through Asian energy markets. Although gas and coal prices are holding steady, oil prices have tumbled. Brent crude has fallen 1.85% to USD 80.70 a barrel, and WTI has tumbled 2.0% lower to USD 76.40 a barrel. Oil is likely to find sellers on any intraday rally today and is in danger of extending losses once Europe and North American markets resume.
Brent crude has resistance at USD 83.00 which looks unlikely to be retested over the next few sessions. Brent could potentially retest the USD 78.00 area this afternoon, although I expect the 100-day moving average at USD 77.00 to hold for now. WTI’s triple top at USD 81.30 is now formidable resistance and a fall to USD 75.00 a barrel area cannot be ruled out. The 100-DMA is critical support, today at USD 74.40.
Depending on how this virus-led sell-off evolves, and how concerned the WHO is of it, the calculations surrounding the OPEC+ meeting next week could change. OPEC+ has stated repeatedly that one area of caution was the resurgence of Covid-19 eroding oil demand as the grouping raises production. One takeout for sure is that OPEC+ will not increase production above its previously agreed 400,000 bpd target next week, despite the noise from its major customers. At this stage, I do not believe they will look to reign in production unless the market situation really deteriorates next week, and oil prices experience a much deeper slump.
Gold edges higher
Gold was quiet overnight due to a US holiday and has been surprisingly muted today as risk aversion waves of selling sweep other asset classes in Asia. Gold has risen just 0.50% to USD 1797.20 an ounce. Part of the reason is likely because traders going long gold in recent times have been so badly whipsawed. The twice burnt mentality means gold maintains its range between USD 1780.00 and USD 1810.00 with a bias to the upside.
If US yields tumble today on haven buying, gold could potentially retest USD 1800.00 and USD 1810.00 an ounce. It has moved clear of the 50-day, 100-day, and 200-day moving averages are clumped together between USD 1789.50 and USD 1793.50 an ounce which form initial support, followed by USD 1880.00 an ounce.
Haven Currencies Boosted By Virus Fears
Covid fears boost safe-haven currencies
With Covid-19 variant fears washing across financial markets today, haven currencies have outperformed at the expense of emerging and commodity/risk sentiment currencies. Trading was muted overnight due to a US holiday with the dollar index easing slightly by 0.08% to 96.71, driven mostly by gains in the yen.
EUR/USD and GBP/USD are holding steady at 1.1220 and 1.3300 this morning. Their technical picture remains bearish and neither of them is likely to receive any haven inflows. With Europe already capped by its 4th virus wave situation, both will remain sells on any sort of rally.
Elsewhere, USD/JPY has fallen by 0.55% to 114.70 as Japanese investors repatriate into yen in a defensive move. USD/JPY could fall to 114.00 in the next 24 hours. Likewise, the Swiss Franc is outperforming, USD/CHF falling 0.30% to 93.35. The Canadian, Australian and New Zealand dollars, bellwethers of commodity and risk sentiment, have unsurprisingly suffered today. USD/CAD has risen 0.53% to 1.2713, AUD/USD has fallen 0.65% to 0.7140 and NZD/USD is 0.60% lower at 0.6820. Both AUD and NZD are approaching their 2020 lows and a weekly close below 0.7100 or 0.6800 respectively, would be another bearish technical signal.
USD/ZAR and USD/MXN have risen by 1.0% today and Asian regional currencies are under some selling pressure as well. USD/IDR and USD/THB have risen by 0.40% with USD/KRW and USD/MYR rising by 0.30%. With a high beta to the global recovery, Asian FX will remain under pressure into the weekend thanks to the virus nerves sweeping markets, as with EM in general. USD/CNY is stubbornly clinging to 6.3900 today, providing some shield to regional currencies. China is unlikely to use today’s developments to weaken the yuan sharply, but it is another reason to reel back the one-way bullish bets on the yuan of the past few months.
Asia Equity Markets Suffer Virus Backlash
Asian markets slide on Covid variant jitters
The emergence of a heavily mutated new strain of Covid-19 in South Africa, labeled B.1.1.529, has sent Asian investors scurrying for the exit door. The UK has paused flights from South Africa and five other neighbouring countries. We can expect more of the same elsewhere, the complacency seen with the emergence of delta in India being a lesson harshly learned. Two cases with the new variant have already been detected in Hong Kong today. There are also media reports this morning about tightening virus restrictions in parts of China.
Equity markets are being heavily sold including US futures, with OTC markets being closed overnight for the Thanksgiving holiday. S&P 500 futures are 0.85% lower, with Nasdaq futures down 0.70% and growth-centric Dow Jones futures tumbling by 1.25%.
In Asia, the Nikkei has collapsed by 2.75% while South Korea’s Kospi is 1.10% lower. Mainland China is faring slightly better with the Shanghai Composite down 0.45%, and there CSI 300 down 0.35%. Hong Kong is suffering a double whammy today, as China property sector fears also resurface and has sent the Hang Seng into a full-on 2.15% retreat.
Regional markets are faring no better, with Singapore 1.30% lower, and Taipei falling by 0.75%. Kuala Lumpur is down 0.45% with Jakarta 0.50% lower. Manila has fallen 0.80% with Bangkok tumbling by 1.0%. The resource-heavy Australian markets are in full retreat today, as both the ASX 200 and All Ordinaries fall by over 1.30%. This despite a sparkling performance by Australia Retail Sales, which jumped 4.90% m/m for October, due to the reopenings in Melbourne and Sydney.
European markets, already under pressure from the 4th Covid-19 wave sweeping the Eurozone, are likely to feel the stress even more as the timing of a new variant of Covid-19 could not arrive at a worse time for the bloc. US markets may see some resilience in the technology/working from home sectors, but the buy-the-dippers are likely to sit today’s session out.
Silver Finds Support At 50-SMA, Bearish Bias Holds
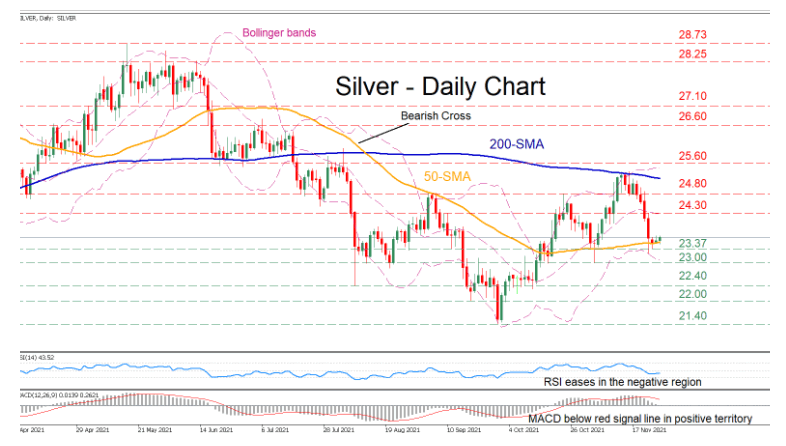
Silver has staged a notable rebound after its long-term downtrend halted at the 21.40 region in September. However, in the short term, the precious metal seems to be losing traction, with the bears battling to push the price beneath the 50-day simple moving average (SMA) in the last few sessions.
The short-term oscillators further confirm that bearish forces have gained the upper hand. The MACD histogram has crossed below its red signal line in the positive area, while the RSI is flatlining below its 50-neutral mark.
Should the selling pressure intensify and the price moves below the 50-day SMA, the next hurdle for the bears might be met at the 23.37 region. Breaching this obstacle, the price might then encounter strong support at 23.00 or even lower at the 22.40 level. A further decline would send the price to test the 22.00 psychological mark before moving towards the September key support point of 21.40.
Alternatively, if buyers retake control, immediate resistance could emerge near the 24.30 region. Overcoming this level, the price ascent may next stop at 24.80 or higher up at the 25.60 barrier. Should the precious metal cross above these barricades, the bulls could then target the 26.60 region.
Overall, silver’s medium-term rebound seems to be running out of steam. Only, a clear break above 25.60 would turn the short-term picture back to positive and revive the bulls' hopes.
GBPJPY Plunges To 7-Week Low Near 151.00
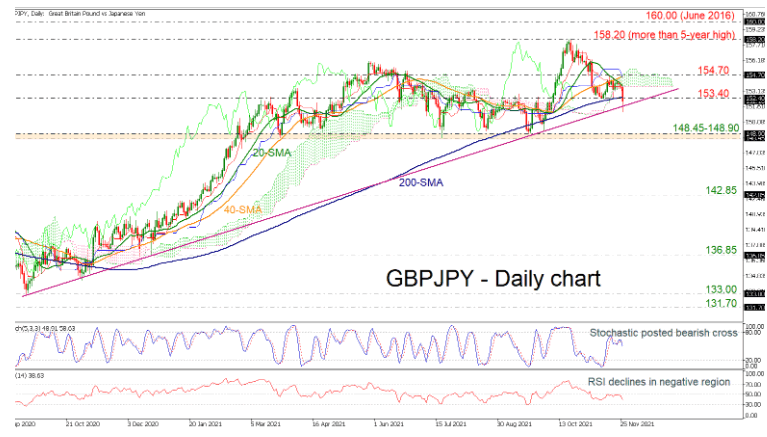
GBPJPY is marking an aggressive declining move, with the price currently trading near a seven-week low and around the 151.00 psychological level.
The pair has dived beneath the 200-day simple moving average (SMA), and the technical indicators are confirming the latest descending move. The stochastic is falling towards the 20 level after posting a bearish crossover within the %K and %D lines, while the RSI is strengthening its negative momentum in the bearish area.
More losses could take the market towards the 148.45-148.90 support region, while any moves lower could meet the 142.85 support, shifting the long-term bullish structure to bearish.
On the flip side, a successful climb beyond the 200-day SMA could drive the price until the lower surface of the Ichimoku cloud around 153.52. The 20-day SMA could add some downside pressure in the same region ahead of the 40-day SMA around the 154.70 resistance. Moving higher, the next stop could be near the more-than-five-year high of 158.20.
Briefly, GBPJPY has been in a downtrend since October 20, and the broader picture is expected to remain positive unless the price breaks below 148.45-148.90.
Swiss GDP grew 1.7% qoq in Q3, more than 1% above pre-crisis level
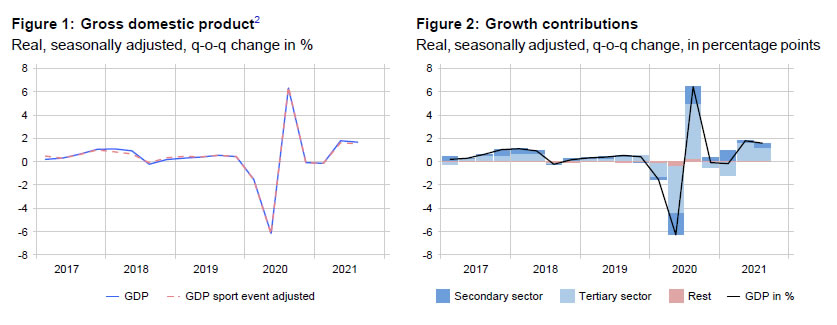
Swiss GDP grew 1.7% qoq in Q3, following 1.8% qoq rise in Q2. Looking at some details, private consumption rose 2.7%. Government consumption dropped -1.5%. Equipment and software investment dropped 1.3%. Construction investment rose 0.1%. Exports of goods excluding valuables rose 2.3%. Exports of services dropped -2.2%. Import of goods rose 3.2%. Imports of services rose 2.9%.
The FSO said, "Value added grew markedly in the affected service sectors as a result of the further relaxation GDP was more than 1% higher in the third quarter than the pre-crisis level seen in the fourth quarter of 2019.
ETHUSD Breaks Above Key Resistance As Demand Bounces Back
The EURUSD pair was little changed in the overnight session since the American markets were closed for Thanksgiving. Still, investors took the minutes of the European Central Bank (ECB) into consideration. The minutes reflected the overall cautiousness that the bank has about higher interest rates. Analysts believe that the bank will be among the last ones to tighten because of the uneven recovery of the region. The market will get more clarity from Christine Lagarde who will deliver a speech today. Still, volumes will be low since most Americans will be in a thanksgiving mood.
The price of crude oil has held steady even after the US started releasing the Strategic Petroleum Reserves. The country is coordinating with other countries like the UK, China, and India. For now, the strategy seems like it has backfired. According to Bloomberg, the reason is that Saudi Arabia’s Crown Prince has leverage over Biden. Unlike during the Trump administration, the prince has not had access to the White House. Therefore, there is a likelihood that the OPEC+ cartel will respond by lowering production.
The economic calendar will be relatively muted today. In addition to the speech by Christine Lagarde, the most important data will be the Swiss GDP numbers. Analysts expect the data to show that the country’s economy expanded by 1.3% on a quarter-on-quarter basis. This translated to a year-on-year expansion of about 3.2%. The Swiss economy has done well helped by both local and external demand. The other important numbers will be the German import and export price index and Canada’s budget balance.
EURUSD
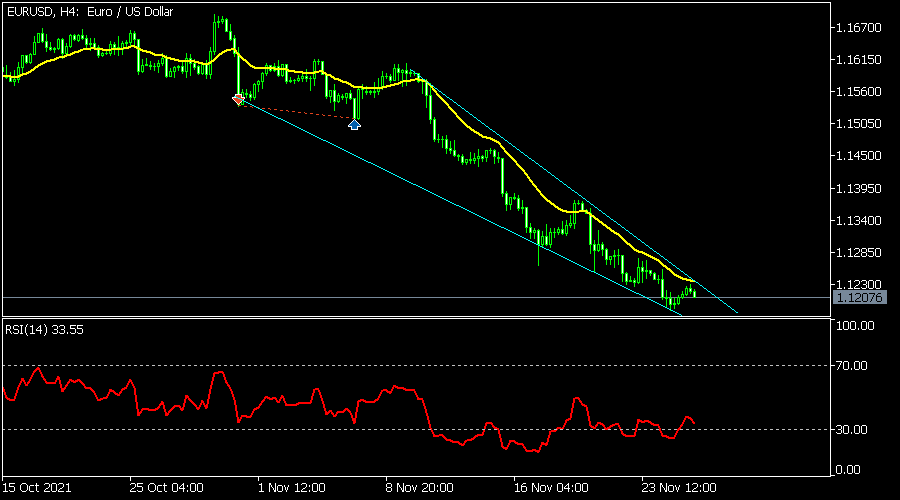
The four-hour chart shows that the EURUSD pair has been relatively unchanged in the past few days. The pair is trading at 1.1208, which is a few points above the lowest level this week. As a result, the pair is still below the 25-day moving average while oscillators have cooled down a bit. The pair has also formed a falling wedge pattern, meaning that it will likely rebound in the coming weeks. For today, the pair will likely remain in the current range.
USDCHF
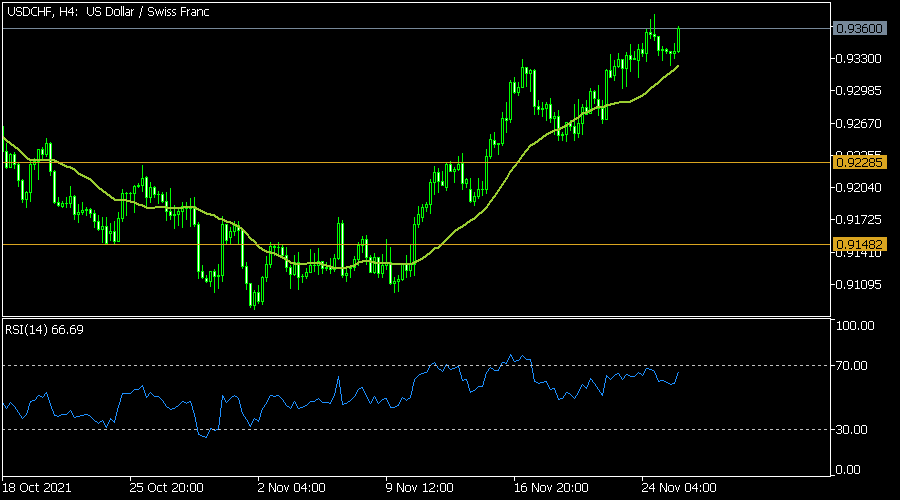
The USDCHF pair jumped sharply ahead of the latest Swiss GDP data. It is trading at 0.9358, which is a few points below the year-to-date high of 0.9372. The price is also close to its highest level on September 28. It has also moved above the 25-day and 50-day moving average. Also, it has formed a V-shaped recovery. Therefore, while the overall trend is bullish, there is a possibility that it will have a pullback today after the GDP data.
ETHUSD
The ETHUSD pair made a bullish breakout as demand for cryptocurrencies bounced back. The pair is trading at 4,520, which was the highest level since November 18. It managed to move above the important resistance level at 4,432. This was the neckline of the inverted head and shoulders pattern. It has also moved above the 25-day moving average while the MACD has moved above the neutral level. Therefore, the pair will likely keep rising during the Thanksgiving weekend.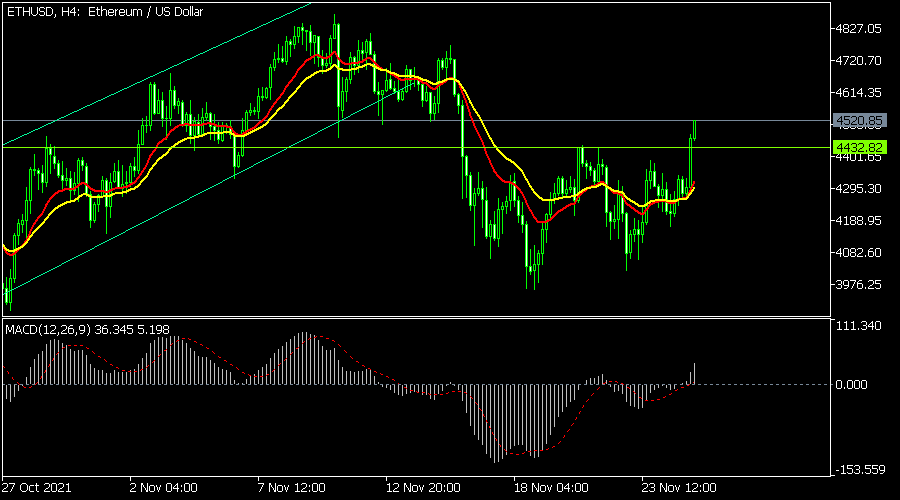
USDCAD Accelerates To Fresh 3-Month High
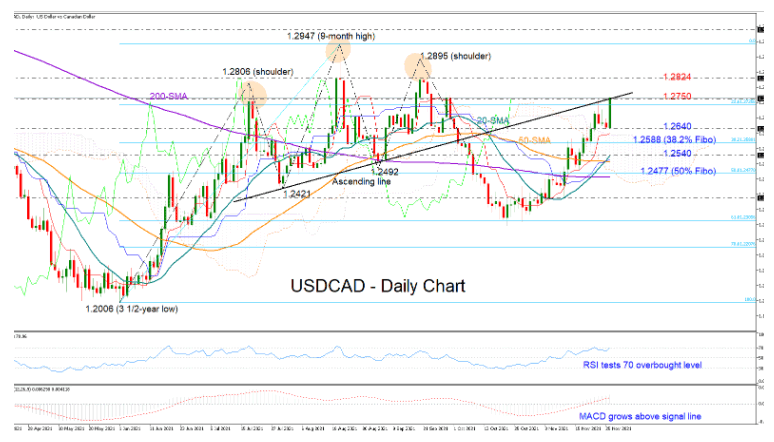
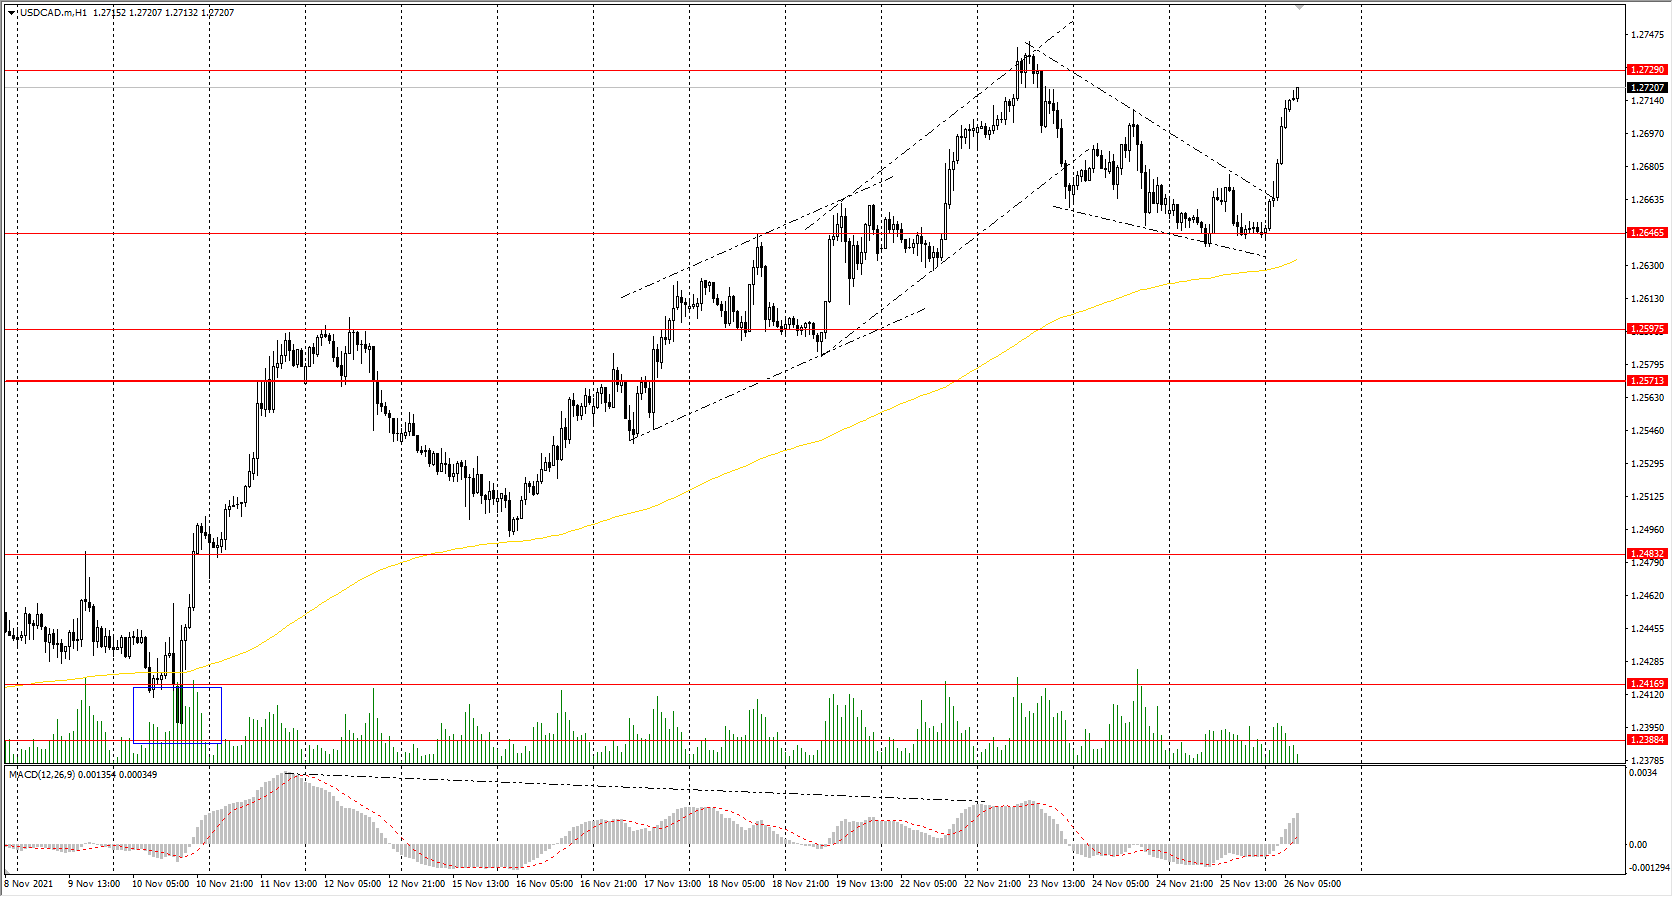
USDCAD gained significant buying traction early on Friday – the largest daily increase since September 7 –, with the price quickly recouping earlier losses to peak above Tuesday’s high of 1.2743.
The positive slope in the RSI and the growing MACD are endorsing the current bullish momentum in the price, though with the former nearing its 70 overbought level and the key ascending line capping the market action, the bears could be around the corner.
A decisive close above the ascending line and the 1.2750 level would reduce negative risks, likely producing another bullish extension towards the key 1.2824 resistance. Beyond that, traders will target the nine-month high of 1.2947, a break of which would re-activate the 2021 uptrend, shifting the medium-term outlook from neutral to positive. Still, any steps higher could be limited if a new barrier pops up near the 1.3000 psychological mark.
Otherwise, if sellers take the lead, the pair may pull back to test the nearby support of 1.2640. Falling lower, the 38.2% Fibonacci retracement of the 1.2006 – 1.2947 upleg may attempt to add some footing around 1.2588, while not far below, the 20-day simple moving average (SMA) could block the way towards the 50% Fibonacci at 1.2477 and the 200-day SMA.
In brief, USDCAD is strengthening its bullish trend in the short-term picture, but the rapid bounce warrants some caution as the price is challenging the crucial boundary set around 1.2750.
The Analytical Overview Of The Main Currency Pairs
The EUR/USD currency pair
Technical indicators of the currency pair:
Prev Open: 1.1196
Prev Close: 1.1205
% chg. over the last day: +0.08%
Germany's GDP growth estimate for Q3 worsened to 1.7% from 1.8%. Analysts believe the economic performance across Europe will worsen in Q4 due to the introduction of new restrictions to combat the Covid-19 wave.
Trading recommendations
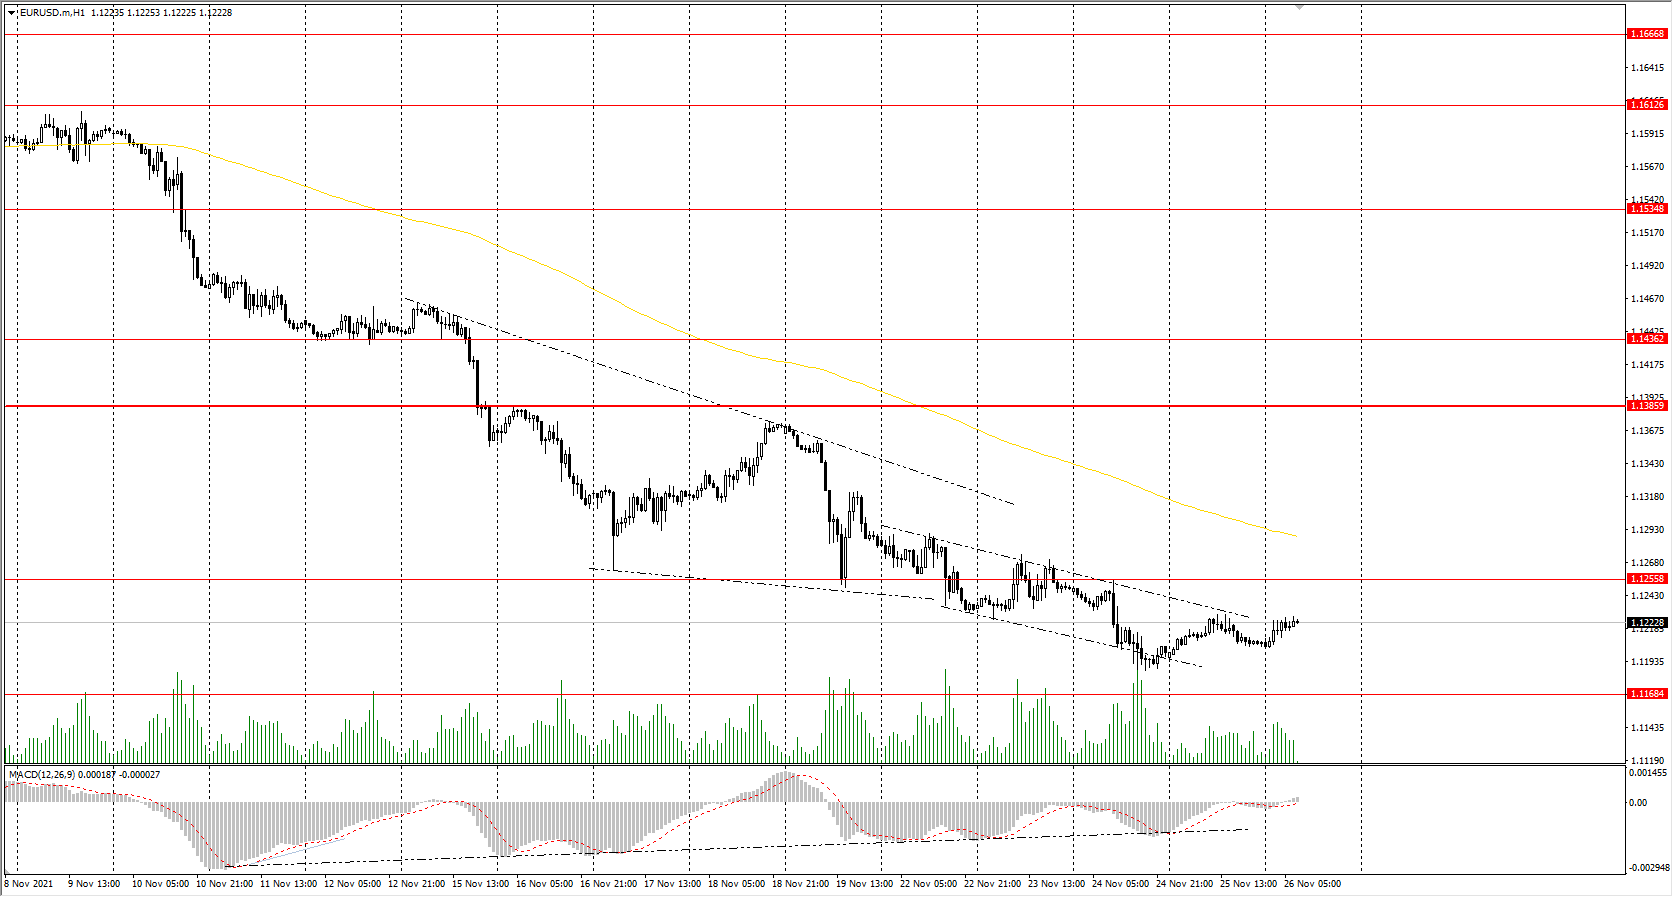
Support levels: 1.1168
Resistance levels: 1.1256, 1.1386, 1.1436, 1.1535, 1.1613, 1.1667, 1.1717
From a technical point of view, the EUR/USD pair is bearish on the hour time frame. The Euro continues to show weakness, the price is slowly declining, and buyers' attempts to buy back the movement give only a small intraday bounce. The MACD indicator has become inactive, but there are signs of divergence at several time frames, so traders should expect a technical rebound. Under such market conditions, traders should consider sell positions from the resistance levels near the moving average since the price has strongly deviated from the averages. Buy trades should be considered only from the support levels of the higher time frame, given the buyers’ initiative, but only with short targets.
Alternative scenario: if the price breaks out through the 1.1386 resistance level and fixes above, the mid-term uptrend will likely resume.
News feed for 2021.11.26:
- Eurozone ECB President Lagarde’s Speech at 10:00 (GMT+2).
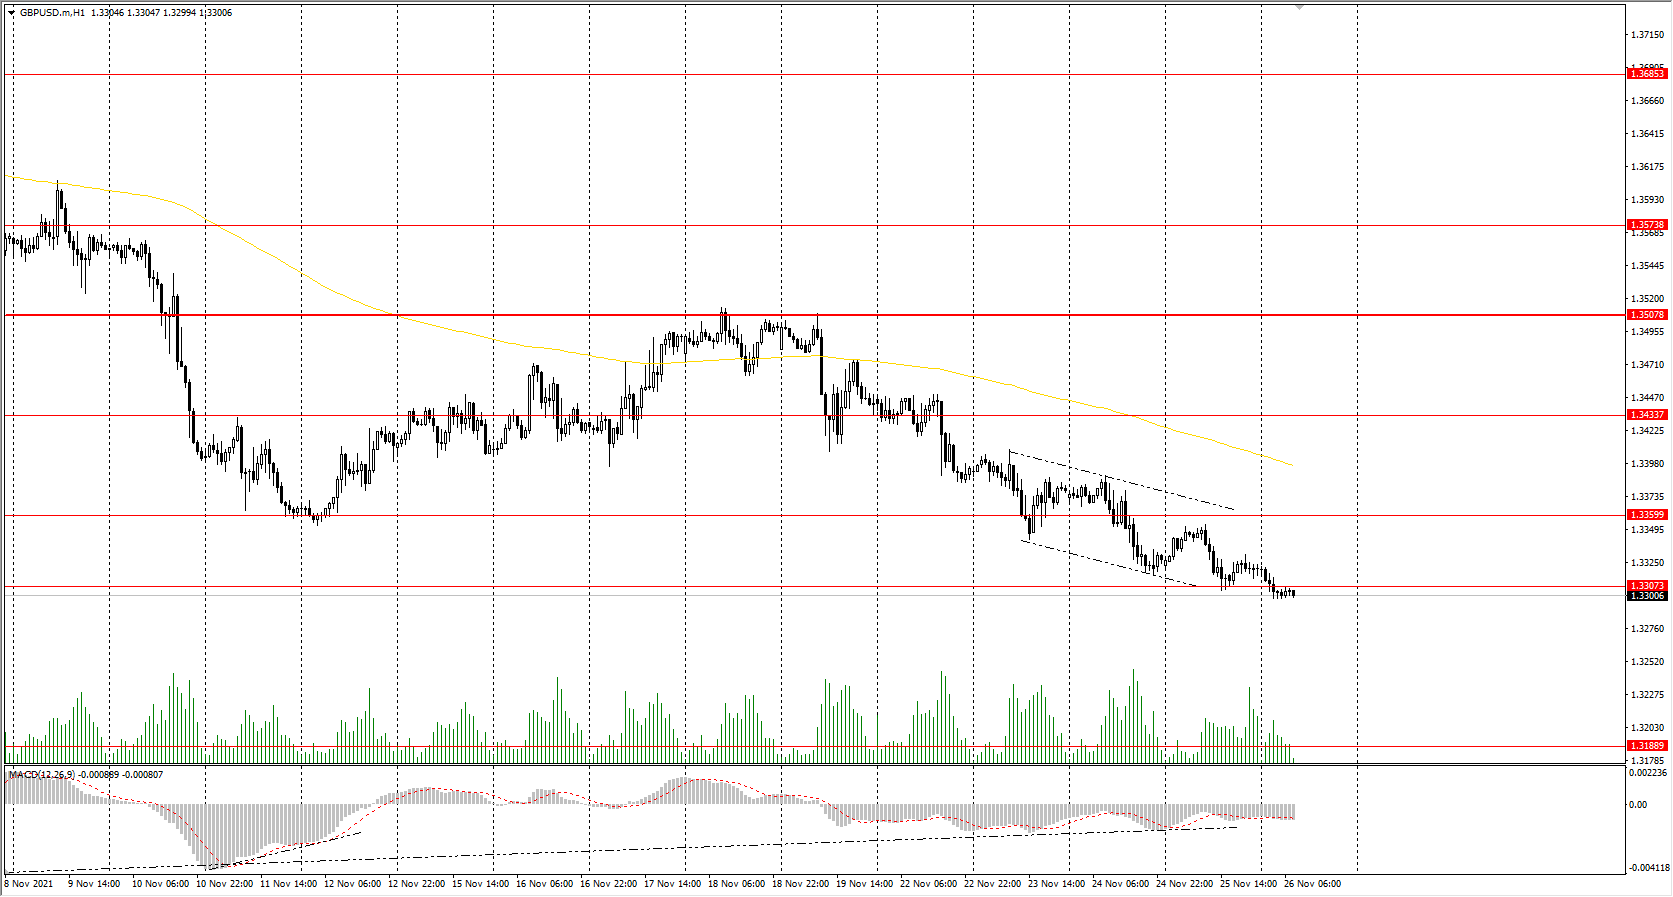
The GBP/USD currency pair
Technical indicators of the currency pair:
Prev Open: 1.3323
Prev Close: 1.3320
% chg. over the last day: -0.02%
The UK health secretary said that vaccines may be less effective against the new variant of Covid-19. According to an official government report, the UK failed to prepare properly for a coronavirus pandemic because resources were focused on Brexit. The UK not only recorded the highest number of deaths in Europe - more than 140,000 so far - but it also suffered the sharpest economic hit among the developed countries.
Trading recommendations
Support levels: 1.3307
Resistance levels: 1.3360, 1.3434, 1.3507, 1.3575, 1.3685, 1.3748
On the hourly time frame, the trend on GBP/USD is bearish. The MACD indicator has become inactive but is signaling divergence on several time frames. Under such market conditions, traders should consider sell positions from the support levels around the moving average. The buyers need to get the price back above the 1.3360 level, so buy trades should be considered only if the price returns to the 1.3360-1.3507 corridor, given the buyers’ initiative.
Alternative scenario: if the price breaks out through the 1.3507 resistance level and consolidates above, the bullish scenario will likely resume.
The USD/JPY currency pair
Technical indicators of the currency pair:
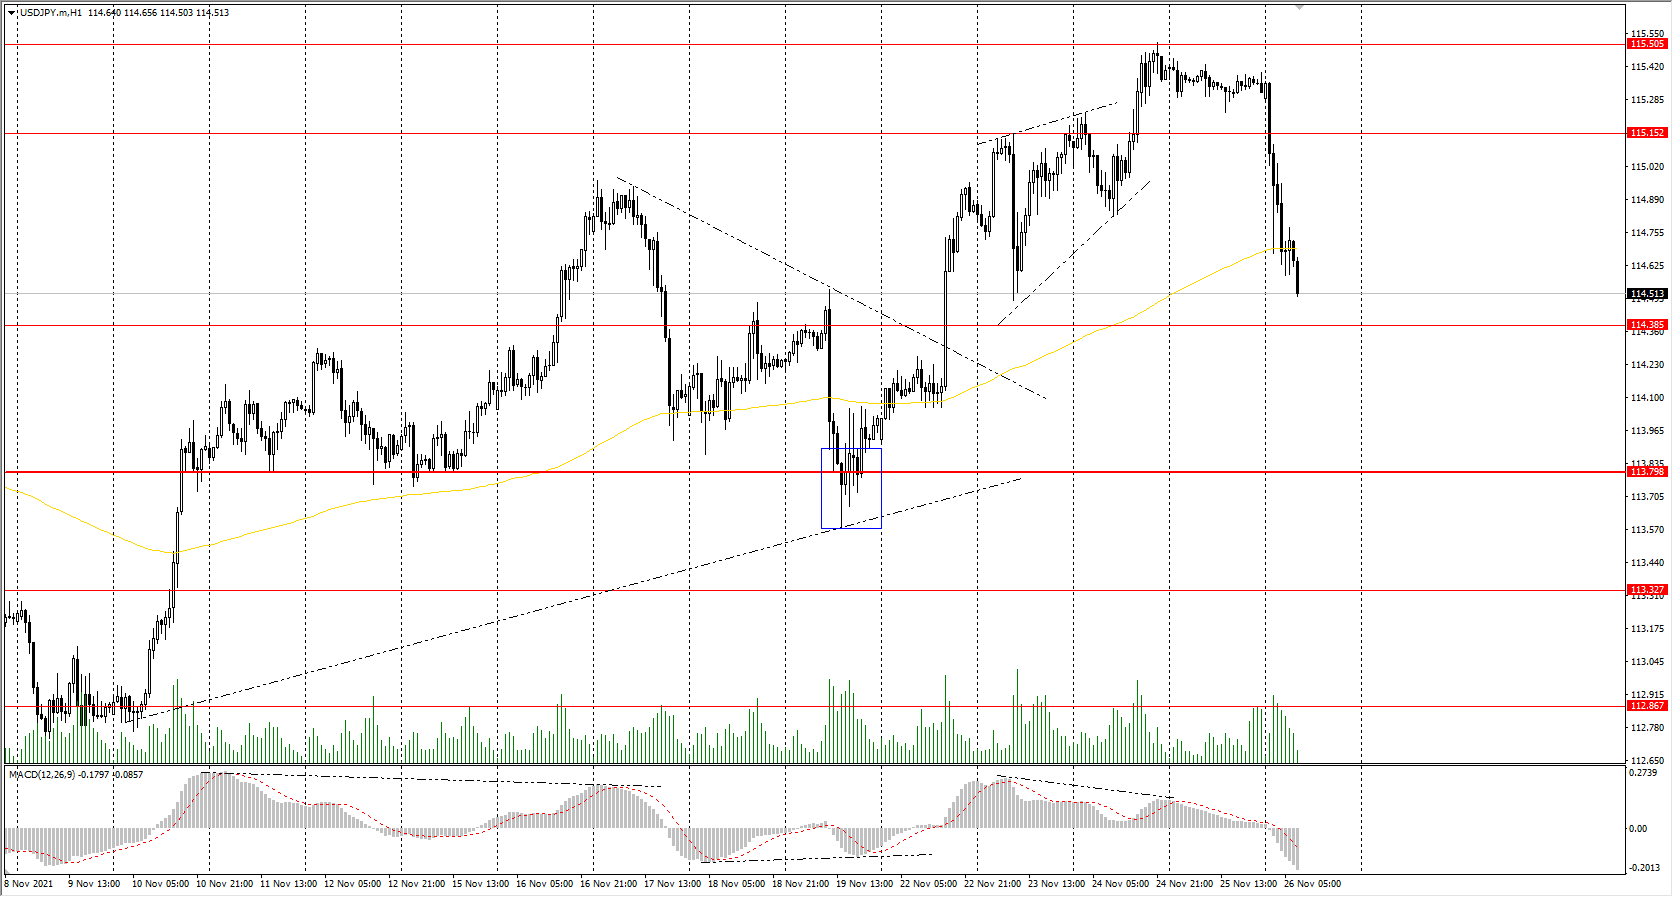
Prev Open: 115.41
Prev Close: 115.31
% chg. over the last day: -0.09%
The Japanese yen strengthened sharply in early Friday trading as a new strain of Covid-19 detected in South Africa sparked a wave of caution in global markets. The Japanese Yen is one of the “safe-haven” currencies in case of emergency shocks.
Trading recommendations
Support levels: 114.38, 113.79, 113.32, 112.87, 112.30
Resistance levels: 115.15, 115.50
The global trend on the USD/JPY currency pair is bullish. But the MACD indicator became negative, and sellers' pressure is increasing. Under such market conditions, it’s better to look for buy positions from the buyers' initiative zone near the moving average, but after additional confirmation in the form of a buyers' initiative. Sell positions should be considered from the resistance levels of higher time frames, given there is sellers' initiative, but only with short targets.
Alternative scenario: if the price falls below 113.79, the uptrend will likely be broken.
The USD/JPY currency pair
Technical indicators of the currency pair:
Prev Open: 115.41
Prev Close: 115.31
% chg. over the last day: -0.09%
The Japanese yen strengthened sharply in early Friday trading as a new strain of Covid-19 detected in South Africa sparked a wave of caution in global markets. The Japanese Yen is one of the “safe-haven” currencies in case of emergency shocks.
Trading recommendations
Support levels: 114.38, 113.79, 113.32, 112.87, 112.30
Resistance levels: 115.15, 115.50
The global trend on the USD/JPY currency pair is bullish. But the MACD indicator became negative, and sellers' pressure is increasing. Under such market conditions, it’s better to look for buy positions from the buyers' initiative zone near the moving average, but after additional confirmation in the form of a buyers' initiative. Sell positions should be considered from the resistance levels of higher time frames, given there is sellers' initiative, but only with short targets.
Alternative scenario: if the price falls below 113.79, the uptrend will likely be broken.
EUR/USD Outlook: A Key Bearish Trend Line Forming With Resistance Near 1.1220
The Euro started a fresh recovery from the 1.1185 zone against the US Dollar. The EUR/USD pair traded above the 1.1200 resistance zone to move into a short-term positive zone.
However, the pair is still well below the 1.1250 level and the 50 hourly simple moving average. There is also a key bearish trend line forming with resistance near 1.1220 on the hourly chart.
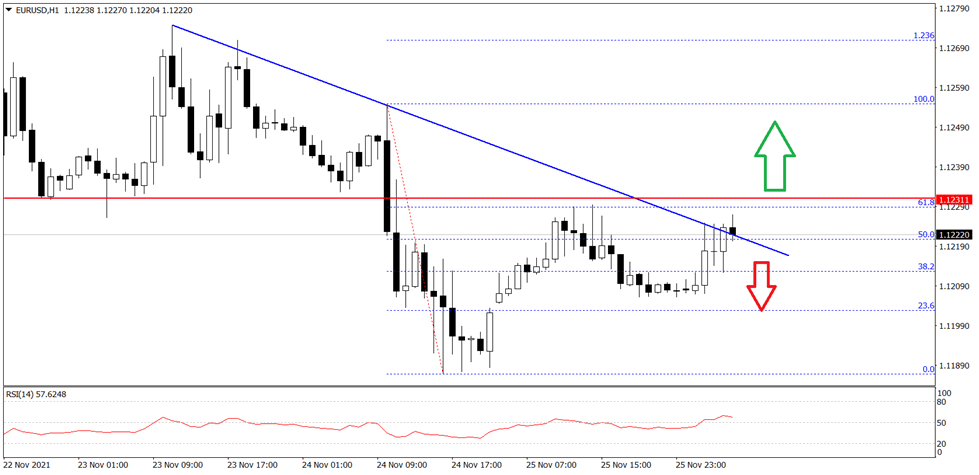
An immediate resistance near the 1.1225 level. A break above the 1.1220 and 1.1225 resistance levels could lead the pair towards the 1.1250 zone, above which the pair could rise towards 1.1320 on FXOpen.
On the downside, an initial support is near the 1.1205 level. The key support is near 1.1200, below which there is a risk of a fresh decline. The next major support is near the 1.1185 level.