
Sample Category Title
EUR/USD Falls Again as Momentum Turns Cautiously Bearish
Key Highlights
- EUR/USD started a downside correction from the 1.1800 zone.
- A key bearish trend line is forming with resistance at 1.1750 on the 4-hour chart.
- GBP/USD is struggling to clear the 1.3520 resistance zone.
- Bitcoin started a steady increase above $90,000 and $92,000.
EUR/USD Technical Analysis
The Euro struggled near the 1.1800 barrier and corrected gains against the US Dollar. EUR/USD traded below 1.1750 to enter a short-term bearish zone.
Looking at the 4-hour chart, the pair declined below the 1.1720 support level and the 100 simple moving average (red, 4-hour). It is now showing bearish signs below the last swing low of 1.1702. If the bears remain in action, the pair could continue to move down.
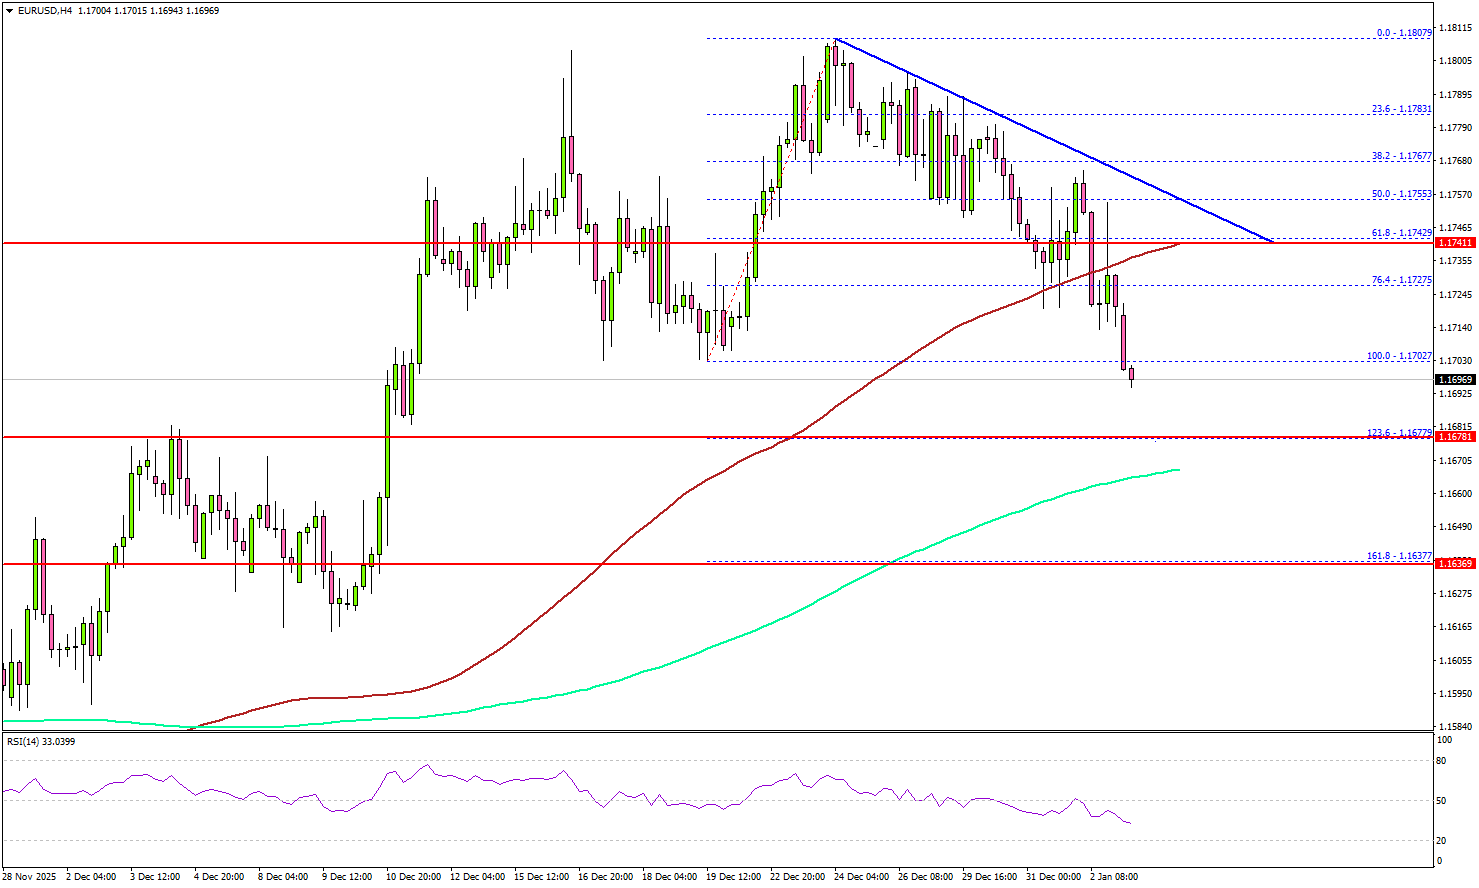
On the downside, there is key support at 1.1680 and the 200 simple moving average (green, 4-hour). A close below the 200 simple moving average (green, 4-hour) or 1.1660 might spark heavy bearish moves.
The first major support is 1.1620. The next support could be 1.1600, below which the bears might aim for a move toward 1.1550.
Immediate resistance sits near 1.1725. The first key hurdle is seen near 1.1750. There is also a key bearish trend line forming with resistance at 1.1750. A close above 1.1750 could open the doors for a move toward 1.1800. Any more gains could set the pace for a steady increase toward 1.1850.
Looking at Bitcoin, the bulls remained in action and were able to push the price above the $92,000 resistance zone.
Upcoming Key Economic Events:
- US ISM Manufacturing Index for Dec 2025 – Forecast 48.3, versus 48.2 previous.
Markets Enter 2026 with Low Volatility, U.S. Jobs Data in Focus
The year-end period was generally quiet, with no major economic releases and New Year holidays keeping trading activity subdued. Low liquidity limited price movements, and most market action reflected position adjustments rather than strong directional views.
Gold was the most notable mover, falling early in the week and retracing part of its recent gains after a strong run higher. The Japanese yen continued to weaken, with no clear signs of intervention from Japanese authorities to slow the move.
The Federal Reserve released the minutes from its December policy meeting, which contained few surprises. Officials reiterated that future interest rate cuts will depend on incoming inflation and economic data, with markets currently pricing in around a 15% chance of a U.S. rate cut at the January meeting.
Markets This Week
U.S. Stocks
Year-end profit taking pushed the Dow slightly lower, but price action remained range-bound with limited volatility. Range trading conditions are likely to continue through most of the week as markets look ahead to potential U.S. interest rate cuts as the next driver for gains. U.S. employment data could be key in determining the start of the next meaningful trend. Resistance is seen at 49,000 and 50,000, while support is located at 48,000, 47,500, 47,000, 46,500, and 46,000.
Japanese Stocks
Japanese stocks edged slightly lower in the final week of the year but still ended 2025 with a strong 28% gain, marking the third consecutive year of gains. With the yen likely to remain weak, the Nikkei outlook stays positive as long as prices hold above the 50,000 level. Resistance is seen at 51,000円, 51,500円, and 52,000円, while support is located at 49,000円, 48,000円, and 47,000円.
USD/JPY
USD/JPY resumed its uptrend last week as Japan’s 10-year government bond yield pushed above 2%, keeping concerns about Japan’s public finances in focus. Markets remain skeptical about the Japanese government’s ability to curb yen weakness through intervention, supporting continued upside pressure. With price action likely to remain range-bound ahead of Friday’s U.S. employment data, buying opportunities may emerge within the range. Resistance is seen at 158, 159, and 160, while support is located at 156, 155, and 154.5.
Gold
Gold fell sharply at the start of last week as profit taking followed the recent strong rally, with the move amplified by thin holiday trading conditions. Despite the size of the pullback, the decline remains modest relative to gold’s recent gains and does not change the broader bullish outlook. Ongoing geopolitical risks and expectations of lower U.S. interest rates in the year ahead should continue to support demand, with buyers likely to re-emerge on dips. Resistance is seen at $4,400, $4,500, and $4,600, while support is located at $4,300, $4,275, $4,200, and $4,175.
Crude Oil
WTI crude ended the year quietly, with selling pressure continuing as markets remain concerned about oversupply and a slowing U.S. economy. While technical indicators suggest more sideways movement in the short term, the broader bias remains bearish as long as prices stay below $60. Resistance is seen at $60, $65, $66.50, $70, and $75, while support remains at $55 and $50.
Bitcoin
Bitcoin ended 2025 with a 7% loss, as recent declines reduced activity and led to a range-bound finish to the year. Prices saw a modest rebound last week as the market tested the $90,000 level, but momentum remains limited. While many traders remain bullish on Bitcoin in 2026, a sustained move is unlikely until price breaks out of the $85,000–$95,000 range. Until then, range trading remains the preferred approach. Resistance is seen at $95,000 and $100,000, while support is located at $85,000, $80,000, and $75,000.
This Week’s Focus
- Monday: U.S. Construction Spending (MoM) and ISM Manufacturing PMI
- Tuesday: E.U. HCOB Eurozone Composite PMI, U.K. S&P Global Composite PMI, U.S. S&P Global Composite
- Wednesday: Japan au Jibun Bank Services PMI, U.K. S&P Global Construction PMI, E.U. CPI, U.S. ADP Nonfarm Employment Change, Factory Orders and ISM Non-Manufacturing PMI
- Thursday: Australia Trade Balance, E.U. Unemployment Rate, U.S. Trade Balance
- Friday: China CPI and PPI, U.S. Nonfarm Payrolls, Building Permits, Housing Starts and Michigan Consumer Sentiment
Markets are returning from the holiday break, but the week is expected to start slowly as traders reassess conditions and position themselves for 2026. Liquidity is likely to remain thin early on, keeping price action subdued. The main focus will be Friday’s U.S. employment data, which has the potential to trigger volatility. Gold, equities, and USD/JPY are expected to be the key markets to watch.
Summary 1/5 – 1/9
Monday, Jan 5, 2026
| GMT | Ccy | Events | Consensus | Previous |
|---|---|---|---|---|
| 00:30 | JPY | Manufacturing PMI Dec F | 49.7 | 49.7 |
| 01:45 | CNY | RatingDog Services PMI Dec | 52 | 52.1 |
| 07:30 | CHF | Real Retail Sales Y/Y Nov | 2.90% | 2.70% |
| 09:30 | EUR | Eurozone Sentix Investor Confidence Jan | -6.2 | |
| 09:30 | GBP | Mortgage Approvals Nov | 64K | 65K |
| 09:30 | GBP | M4 Money Supply M/M Nov | -0.10% | -0.20% |
| 15:00 | USD | ISM Manufacturing PMI Dec | 48.3 | 48.2 |
| 15:00 | USD | ISM Manufacturing Prices Paid Dec | 59 | 58.5 |
| 15:00 | USD | ISM Manufacturing Employment Dec | 44 | |
| 23:50 | JPY | Monetary Base Y/Y Dec | -8.00% | -8.50% |
| GMT | Ccy | Events | |
|---|---|---|---|
| 00:30 | JPY | Manufacturing PMI Dec F | |
| Forecast: 49.7 | Previous: 49.7 | ||
| 01:45 | CNY | RatingDog Services PMI Dec | |
| Forecast: 52 | Previous: 52.1 | ||
| 07:30 | CHF | Real Retail Sales Y/Y Nov | |
| Forecast: 2.90% | Previous: 2.70% | ||
| 09:30 | EUR | Eurozone Sentix Investor Confidence Jan | |
| Forecast: | Previous: -6.2 | ||
| 09:30 | GBP | Mortgage Approvals Nov | |
| Forecast: 64K | Previous: 65K | ||
| 09:30 | GBP | M4 Money Supply M/M Nov | |
| Forecast: -0.10% | Previous: -0.20% | ||
| 15:00 | USD | ISM Manufacturing PMI Dec | |
| Forecast: 48.3 | Previous: 48.2 | ||
| 15:00 | USD | ISM Manufacturing Prices Paid Dec | |
| Forecast: 59 | Previous: 58.5 | ||
| 15:00 | USD | ISM Manufacturing Employment Dec | |
| Forecast: | Previous: 44 | ||
| 23:50 | JPY | Monetary Base Y/Y Dec | |
| Forecast: -8.00% | Previous: -8.50% | ||
Tuesday, Jan 6, 2026
| GMT | Ccy | Events | Consensus | Previous |
|---|---|---|---|---|
| 00:01 | GBP | BRC Shop Price Index Y/Y Dec | 0.60% | |
| 08:30 | CHF | Manufacturing PMI Dec | 49.9 | 49.7 |
| 08:50 | EUR | France Services PMI Dec F | 50.2 | 50.2 |
| 08:55 | EUR | Germany Services PMI Dec F | 52.6 | 52.6 |
| 09:00 | EUR | Eurozone Services PMI Dec F | 52.6 | 52.6 |
| 09:30 | GBP | Services PMI Dec F | 52.1 | |
| 13:00 | EUR | Germany CPI M/M Dec P | 0.30% | -0.20% |
| 13:00 | EUR | Germany CPI Y/Y Dec P | 2.20% | 2.60% |
| 14:45 | USD | Services PMI Dec F | 52.9 | 52.9 |
| GMT | Ccy | Events | |
|---|---|---|---|
| 00:01 | GBP | BRC Shop Price Index Y/Y Dec | |
| Forecast: | Previous: 0.60% | ||
| 08:30 | CHF | Manufacturing PMI Dec | |
| Forecast: 49.9 | Previous: 49.7 | ||
| 08:50 | EUR | France Services PMI Dec F | |
| Forecast: 50.2 | Previous: 50.2 | ||
| 08:55 | EUR | Germany Services PMI Dec F | |
| Forecast: 52.6 | Previous: 52.6 | ||
| 09:00 | EUR | Eurozone Services PMI Dec F | |
| Forecast: 52.6 | Previous: 52.6 | ||
| 09:30 | GBP | Services PMI Dec F | |
| Forecast: | Previous: 52.1 | ||
| 13:00 | EUR | Germany CPI M/M Dec P | |
| Forecast: 0.30% | Previous: -0.20% | ||
| 13:00 | EUR | Germany CPI Y/Y Dec P | |
| Forecast: 2.20% | Previous: 2.60% | ||
| 14:45 | USD | Services PMI Dec F | |
| Forecast: 52.9 | Previous: 52.9 | ||
Wednesday, Jan 7, 2026
| GMT | Ccy | Events | Consensus | Previous |
|---|---|---|---|---|
| 00:30 | JPY | Services PMI Dec F | 52.5 | 52.5 |
| 00:30 | AUD | CPI M/M Nov | 0% | |
| 00:30 | AUD | CPI Y/Y Nov | 3.80% | |
| 00:30 | AUD | Trimmed Mean CPI M/M Nov | 0.30% | |
| 00:30 | AUD | Trimmed Mean CPI Y/Y Nov | 3.30% | |
| 00:30 | AUD | Building Permits M/M Nov | 2.10% | -6.40% |
| 07:00 | EUR | Germany Retail Sales M/M Nov | 0.20% | -0.30% |
| 08:55 | EUR | Germany Unemployment Rate Nov | 6.30% | 6.30% |
| 08:55 | EUR | Germany Unemployment Change Nov | 5K | 1K |
| 09:30 | GBP | Construction PMI Dec | 39.4 | |
| 10:00 | EUR | Eurozone CPI Y/Y Dec P | 2.10% | 2.10% |
| 10:00 | EUR | Eurozone Core CPI Y/Y Dec P | 2.40% | 2.40% |
| 13:15 | USD | ADP Employment Change Dec | 50K | -32K |
| 15:00 | USD | ISM Services PMI Dec | 52.3 | 52.6 |
| 15:00 | USD | Factory Orders M/M Oct | -1.00% | 0.20% |
| 15:00 | CAD | Ivey PMI Dec | 49.5 | 48.4 |
| 15:30 | USD | Crude Oil Inventories (Jan 2) | -1.9M | |
| 23:30 | JPY | Labor Cash Earnings Y/Y Nov | 2.30% | 2.60% |
| GMT | Ccy | Events | |
|---|---|---|---|
| 00:30 | JPY | Services PMI Dec F | |
| Forecast: 52.5 | Previous: 52.5 | ||
| 00:30 | AUD | CPI M/M Nov | |
| Forecast: | Previous: 0% | ||
| 00:30 | AUD | CPI Y/Y Nov | |
| Forecast: | Previous: 3.80% | ||
| 00:30 | AUD | Trimmed Mean CPI M/M Nov | |
| Forecast: | Previous: 0.30% | ||
| 00:30 | AUD | Trimmed Mean CPI Y/Y Nov | |
| Forecast: | Previous: 3.30% | ||
| 00:30 | AUD | Building Permits M/M Nov | |
| Forecast: 2.10% | Previous: -6.40% | ||
| 07:00 | EUR | Germany Retail Sales M/M Nov | |
| Forecast: 0.20% | Previous: -0.30% | ||
| 08:55 | EUR | Germany Unemployment Rate Nov | |
| Forecast: 6.30% | Previous: 6.30% | ||
| 08:55 | EUR | Germany Unemployment Change Nov | |
| Forecast: 5K | Previous: 1K | ||
| 09:30 | GBP | Construction PMI Dec | |
| Forecast: | Previous: 39.4 | ||
| 10:00 | EUR | Eurozone CPI Y/Y Dec P | |
| Forecast: 2.10% | Previous: 2.10% | ||
| 10:00 | EUR | Eurozone Core CPI Y/Y Dec P | |
| Forecast: 2.40% | Previous: 2.40% | ||
| 13:15 | USD | ADP Employment Change Dec | |
| Forecast: 50K | Previous: -32K | ||
| 15:00 | USD | ISM Services PMI Dec | |
| Forecast: 52.3 | Previous: 52.6 | ||
| 15:00 | USD | Factory Orders M/M Oct | |
| Forecast: -1.00% | Previous: 0.20% | ||
| 15:00 | CAD | Ivey PMI Dec | |
| Forecast: 49.5 | Previous: 48.4 | ||
| 15:30 | USD | Crude Oil Inventories (Jan 2) | |
| Forecast: | Previous: -1.9M | ||
| 23:30 | JPY | Labor Cash Earnings Y/Y Nov | |
| Forecast: 2.30% | Previous: 2.60% | ||
Thursday, Jan 8, 2026
| GMT | Ccy | Events | Consensus | Previous |
|---|---|---|---|---|
| 00:30 | AUD | Trade Balance (AUD) Nov | 5.55B | 4.39B |
| 03:00 | CNY | Trade Balance (USD) Dec | 111.68B | |
| 05:00 | JPY | Consumer Confidence Dec | 37.9 | 37.5 |
| 07:00 | EUR | Germany Factory Orders M/M Nov | -0.70% | 1.50% |
| 07:30 | CHF | CPI M/M Dec | 0.00% | -0.20% |
| 07:30 | CHF | CPI Y/Y Dec | 0.10% | 0.00% |
| 10:00 | EUR | Eurozone Unemployment Rate Nov | 6.40% | 6.40% |
| 10:00 | EUR | Eurozone PPI M/M Nov | 0.20% | 0.10% |
| 10:00 | EUR | Eurozone PPI Y/Y Nov | -0.50% | |
| 10:00 | EUR | Eurozone Economic Sentiment Dec | 96.9 | 97 |
| 10:00 | EUR | Eurozone Services Sentiment Dec | 5.9 | 5.7 |
| 10:00 | EUR | Eurozone Industrial Confidence Dec | -9 | -9.3 |
| 10:00 | EUR | Eurozone Consumer Confidence Dec F | -14.6 | -14.6 |
| 13:30 | CAD | Trade Balance Nov | 0.2B | |
| 13:30 | USD | Trade Balance (USD) Oct | -59.4B | -52.8B |
| 13:30 | USD | Initial Jobless Claims (Jan 2) | 199K | |
| 13:30 | USD | Nonfarm Productivity Q3 | 3.70% | 3.30% |
| 13:30 | USD | Unit Labor Costs Q3 | 0.50% | 1% |
| 15:00 | USD | Wholesale Inventories Oct F | 0.20% | 0.50% |
| 15:30 | USD | Natural Gas Storage (Jan 2) | -38B | |
| 23:30 | JPY | Household Spending Y/Y Nov | -1% | -3% |
| GMT | Ccy | Events | |
|---|---|---|---|
| 00:30 | AUD | Trade Balance (AUD) Nov | |
| Forecast: 5.55B | Previous: 4.39B | ||
| 03:00 | CNY | Trade Balance (USD) Dec | |
| Forecast: | Previous: 111.68B | ||
| 05:00 | JPY | Consumer Confidence Dec | |
| Forecast: 37.9 | Previous: 37.5 | ||
| 07:00 | EUR | Germany Factory Orders M/M Nov | |
| Forecast: -0.70% | Previous: 1.50% | ||
| 07:30 | CHF | CPI M/M Dec | |
| Forecast: 0.00% | Previous: -0.20% | ||
| 07:30 | CHF | CPI Y/Y Dec | |
| Forecast: 0.10% | Previous: 0.00% | ||
| 10:00 | EUR | Eurozone Unemployment Rate Nov | |
| Forecast: 6.40% | Previous: 6.40% | ||
| 10:00 | EUR | Eurozone PPI M/M Nov | |
| Forecast: 0.20% | Previous: 0.10% | ||
| 10:00 | EUR | Eurozone PPI Y/Y Nov | |
| Forecast: | Previous: -0.50% | ||
| 10:00 | EUR | Eurozone Economic Sentiment Dec | |
| Forecast: 96.9 | Previous: 97 | ||
| 10:00 | EUR | Eurozone Services Sentiment Dec | |
| Forecast: 5.9 | Previous: 5.7 | ||
| 10:00 | EUR | Eurozone Industrial Confidence Dec | |
| Forecast: -9 | Previous: -9.3 | ||
| 10:00 | EUR | Eurozone Consumer Confidence Dec F | |
| Forecast: -14.6 | Previous: -14.6 | ||
| 13:30 | CAD | Trade Balance Nov | |
| Forecast: | Previous: 0.2B | ||
| 13:30 | USD | Trade Balance (USD) Oct | |
| Forecast: -59.4B | Previous: -52.8B | ||
| 13:30 | USD | Initial Jobless Claims (Jan 2) | |
| Forecast: | Previous: 199K | ||
| 13:30 | USD | Nonfarm Productivity Q3 | |
| Forecast: 3.70% | Previous: 3.30% | ||
| 13:30 | USD | Unit Labor Costs Q3 | |
| Forecast: 0.50% | Previous: 1% | ||
| 15:00 | USD | Wholesale Inventories Oct F | |
| Forecast: 0.20% | Previous: 0.50% | ||
| 15:30 | USD | Natural Gas Storage (Jan 2) | |
| Forecast: | Previous: -38B | ||
| 23:30 | JPY | Household Spending Y/Y Nov | |
| Forecast: -1% | Previous: -3% | ||
Friday, Jan 9, 2026
| GMT | Ccy | Events | Consensus | Previous |
|---|---|---|---|---|
| 01:30 | CNY | CPI Y/Y Dec | 0.60% | 0.70% |
| 01:30 | CNY | PPI Y/Y Dec | -2.20% | -2.20% |
| 05:00 | JPY | Leading Index Nov P | 110.5 | 109.8 |
| 07:00 | EUR | Germany Industrial Production M/M Nov | 0.00% | 1.80% |
| 07:00 | EUR | Germany Trade Balance (EUR) Nov | 16.9B | |
| 07:45 | EUR | France Industrial Output M/M Nov | 0.00% | 0.20% |
| 08:00 | CHF | Foreign Currency Reserves Dec | 727B | |
| 08:00 | CHF | Unemployment Rate Dec | 3.00% | 3% |
| 10:00 | EUR | Eurozone Retail Sales M/M Nov | 0.10% | 0.00% |
| 13:30 | CAD | Net Change in Employment Dec | -5.0K | 53.6K |
| 13:30 | CAD | Unemployment Rate Dec | 6.70% | 6.50% |
| 13:30 | USD | Building Permits Sep | 1.312M | |
| 13:30 | USD | Housing StartsSep | 1.307M | |
| 13:30 | USD | Nonfarm Payrolls Dec | 55K | 64K |
| 13:30 | USD | Unemployment Rate Dec | 4.50% | 4.60% |
| 13:30 | USD | Average Hourly Earnings M/M Dec | 0.30% | 0.10% |
| 13:30 | USD | Housing Starts Change Oct | ||
| 13:30 | USD | Housing Starts M/M Oct | 1.31M | |
| 13:30 | USD | Building Permits M/M Oct | 1.34M | |
| 15:00 | USD | UoM Consumer Sentiment Jan P | 53.5 | 52.9 |
| 15:00 | USD | UoM 1-Yr Inflation Expectations Jan P | 4.20% |
| GMT | Ccy | Events | |
|---|---|---|---|
| 01:30 | CNY | CPI Y/Y Dec | |
| Forecast: 0.60% | Previous: 0.70% | ||
| 01:30 | CNY | PPI Y/Y Dec | |
| Forecast: -2.20% | Previous: -2.20% | ||
| 05:00 | JPY | Leading Index Nov P | |
| Forecast: 110.5 | Previous: 109.8 | ||
| 07:00 | EUR | Germany Industrial Production M/M Nov | |
| Forecast: 0.00% | Previous: 1.80% | ||
| 07:00 | EUR | Germany Trade Balance (EUR) Nov | |
| Forecast: | Previous: 16.9B | ||
| 07:45 | EUR | France Industrial Output M/M Nov | |
| Forecast: 0.00% | Previous: 0.20% | ||
| 08:00 | CHF | Foreign Currency Reserves Dec | |
| Forecast: | Previous: 727B | ||
| 08:00 | CHF | Unemployment Rate Dec | |
| Forecast: 3.00% | Previous: 3% | ||
| 10:00 | EUR | Eurozone Retail Sales M/M Nov | |
| Forecast: 0.10% | Previous: 0.00% | ||
| 13:30 | CAD | Net Change in Employment Dec | |
| Forecast: -5.0K | Previous: 53.6K | ||
| 13:30 | CAD | Unemployment Rate Dec | |
| Forecast: 6.70% | Previous: 6.50% | ||
| 13:30 | USD | Building Permits Sep | |
| Forecast: | Previous: 1.312M | ||
| 13:30 | USD | Housing StartsSep | |
| Forecast: | Previous: 1.307M | ||
| 13:30 | USD | Nonfarm Payrolls Dec | |
| Forecast: 55K | Previous: 64K | ||
| 13:30 | USD | Unemployment Rate Dec | |
| Forecast: 4.50% | Previous: 4.60% | ||
| 13:30 | USD | Average Hourly Earnings M/M Dec | |
| Forecast: 0.30% | Previous: 0.10% | ||
| 13:30 | USD | Housing Starts Change Oct | |
| Forecast: | Previous: | ||
| 13:30 | USD | Housing Starts M/M Oct | |
| Forecast: 1.31M | Previous: | ||
| 13:30 | USD | Building Permits M/M Oct | |
| Forecast: 1.34M | Previous: | ||
| 15:00 | USD | UoM Consumer Sentiment Jan P | |
| Forecast: 53.5 | Previous: 52.9 | ||
| 15:00 | USD | UoM 1-Yr Inflation Expectations Jan P | |
| Forecast: | Previous: 4.20% | ||
Markets Weekly Outlook – NFP Jobs Data in Focus in 1st Full Trading Week of 2026
Week in review
The US stock markets started 2026 on a high note, with the S&P 500 and Nasdaq rallying on the first trading day thanks to renewed investor confidence.
Technology companies led the comeback, with giants like Nvidia and Broadcom posting strong gains after a few difficult days at the end of December. Although the market missed out on the traditional year-end "Santa Claus rally," the longer-term picture remains very strong; all three major indexes finished 2025 with double-digit growth, marking their third straight year of profits.
The Dow Jones specifically closed out the year with an eight-month winning streak, fueled largely by the exploding demand for artificial intelligence technology.
On the FX front, the US dollar began 2026 with a slight recovery, rising 0.12% on Friday after a challenging performance last year.
In contrast, the Euro slipped by 0.11% to $1.1732, hurt by news that European factory activity has dropped to a nine-month low. Despite this slow start, both the Euro and the British Pound, which also dipped slightly today are coming off their strongest annual gains since 2017.
Overall trading activity remained quiet especially in the Asian session as markets in Japan and China were closed for the holiday.
Commodities started the day eyeing a recovery following the recent selloff. Gold traded briefly above the $4400/oz before the precious metal wiped out the majority of its daily gains.
Silver is down around the 1% mark on the day while Platinum is up just over 1%.
Palladium has struggled but is eyeing a move into positive territory, finally.
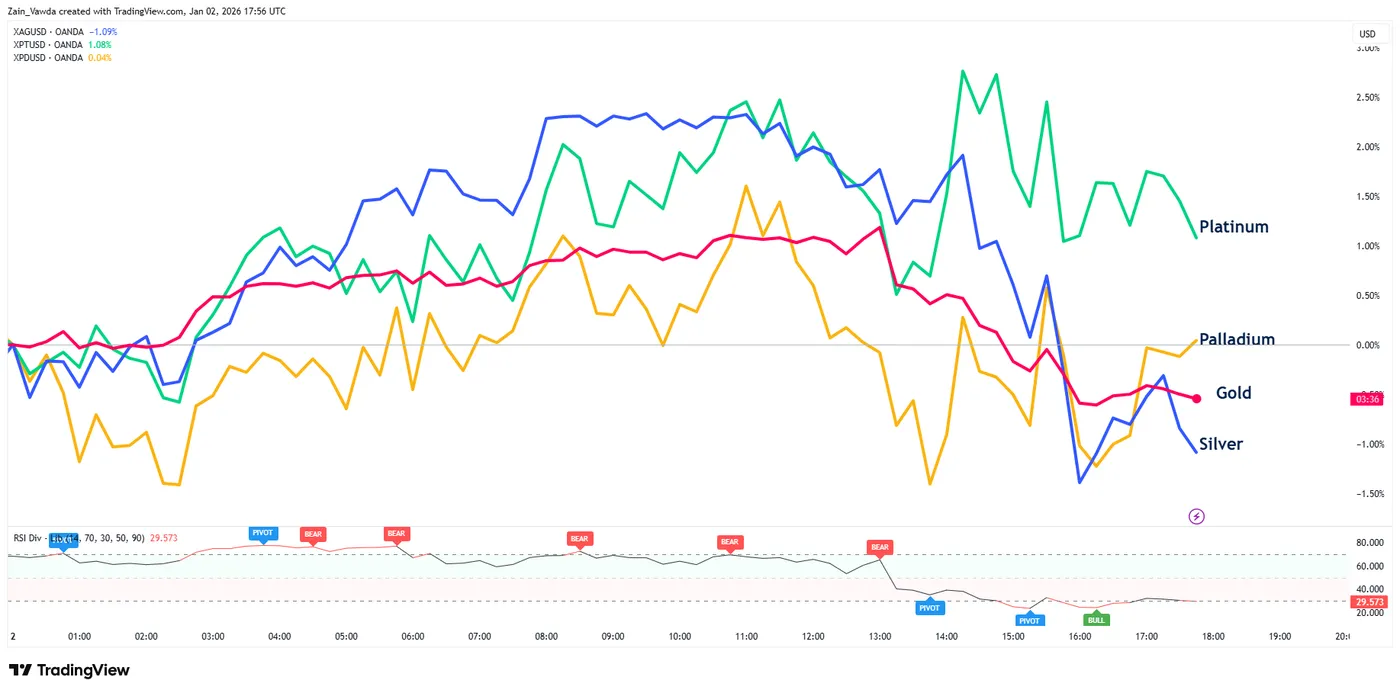
Source:TradingView
The Week Ahead
The first full trading week of 2026 marks a sharp transition from the quiet holiday season to a busy schedule of critical economic reports. Market participants are moving on from a strong year where major US stock indexes rose between 16% and 20%, now facing an economy that feels unstable and uneven.
The coming week will be dominated by the December US jobs report, manufacturing data from both the U.S. and Europe, and updates on how UK retailers performed over Christmas. These events are happening against a backdrop of stubborn inflation near 3% and growing worries about labor shortages and new trade tariffs.
US Markets - Deciphering the "Low-Hire, Low-Fire" Paradigm
The main event for this week is the US employment report coming out on January 9, 2026.
This follows a year where hiring gradually slowed down, and experts predict the economy added about 55,000 jobs in December similar to November's modest numbers.
However, the way analysts interpret this data is changing significantly. J.P. Morgan notes that because of stricter immigration rules and an aging population, the economy now needs far fewer new jobs to keep unemployment stable. The number of jobs needed to maintain the status quo has dropped from 50,000 a month to as low as 15,000.
Consequently, even a relatively low gain of 55,000 jobs would be strong enough to lower the unemployment rate, which is expected to dip from 4.6% to 4.5%
The current "stagnant" job market where companies are neither hiring aggressively nor firing workers is largely due to business uncertainty caused by changing trade rules and a recent government shutdown.
As a result, most new jobs in December are expected to come from stable industries like healthcare and shipping, while construction and manufacturing struggle under high costs. This cooling labor demand allowed the Federal Reserve to cut interest rates late last year, bringing them to a range of 3.5% to 3.75%.
While market participants do not expect another cut in January, there is currently a 50% chance of a cut in March.
However, if the upcoming jobs report is surprisingly weak, it could spark fears of a recession and lead investors to bet on faster interest rate cuts.
In the UK, in the United Kingdom, the first full week of January is synonymous with the "Golden Quarter" post-mortem. The retail sector, a cornerstone of the UK economy, faces a rigorous assessment through a series of trading updates from its most prominent entities: Next, Marks & Spencer, Tesco, and J Sainsbury.
These reports will offer the first definitive look at how consumers responded to the festive season amidst a backdrop of rising employment costs and a potential "price war" in the grocery sector.
This may have a bigger impact than usual on indices after the FTSE 100 passed the 10000 point mark for the first time this week.
Asia Pacific Markets
In the Asia-Pacific region, the week of January 4 is characterized by the return of full market participation following the extended New Year bank holidays in Japan.
Market participants are closely monitoring the Bank of Japan this week. While the bank is expected to proceed cautiously, new wage data arriving on January 7 could speed up interest rate hikes if earnings are higher than expected, which would strengthen the Japanese Yen.
Attention also turns to China, where inflation data released on January 9 is expected to highlight ongoing problems with falling factory prices. Before that, a key trade report on January 8 will show how well China is coping with global trade tensions; despite new export restrictions on steel and electric vehicles, experts still forecast a massive trade surplus of over $100 billion.
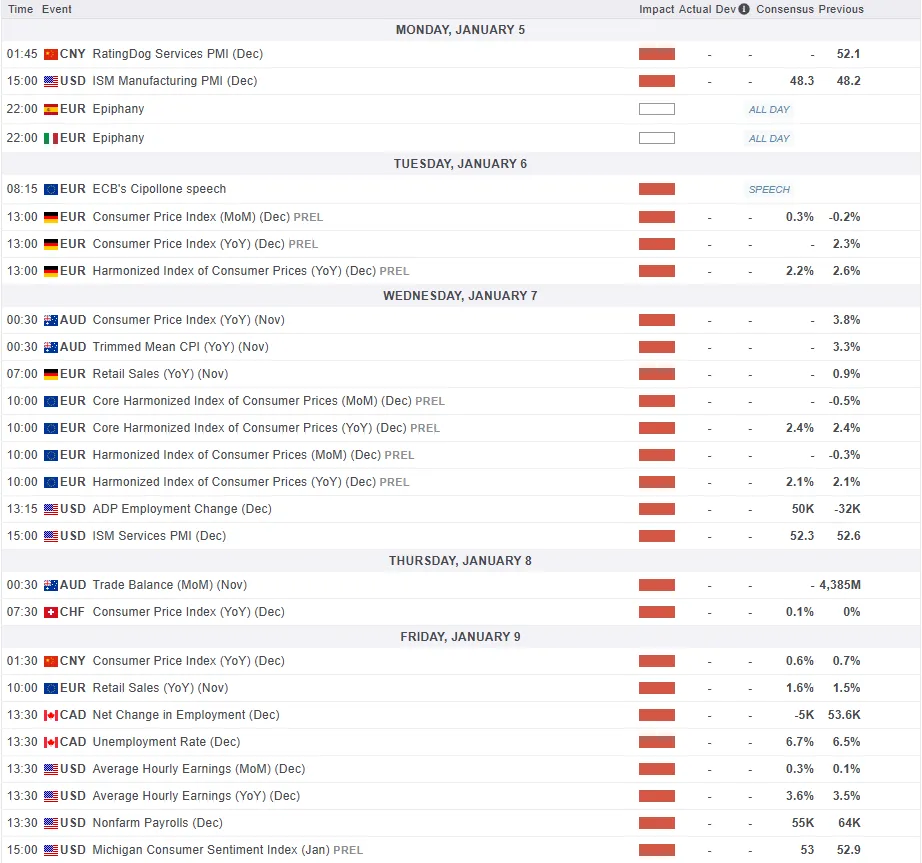
For all market-moving economic releases and events, see the MarketPulse Economic Calendar. (click to enlarge)
Chart of the Week - S&P 500
From a technical perspective, the S&P 500 has seen a decent pullback over the last 5 trading days.
This has brought the index close to a key confluence level where the 100-day MA and ascending trendline converge.
This is around the 6800 handle and could see the index print a higher low before moving higher once more.
If this level breaks, support may be found at 6675 and 6650 respectively.
On the upside, resistance rests at 6900 before the all-time highs at 6950 comes into focus.
S&P 500 Daily Chart, January 2, 2026
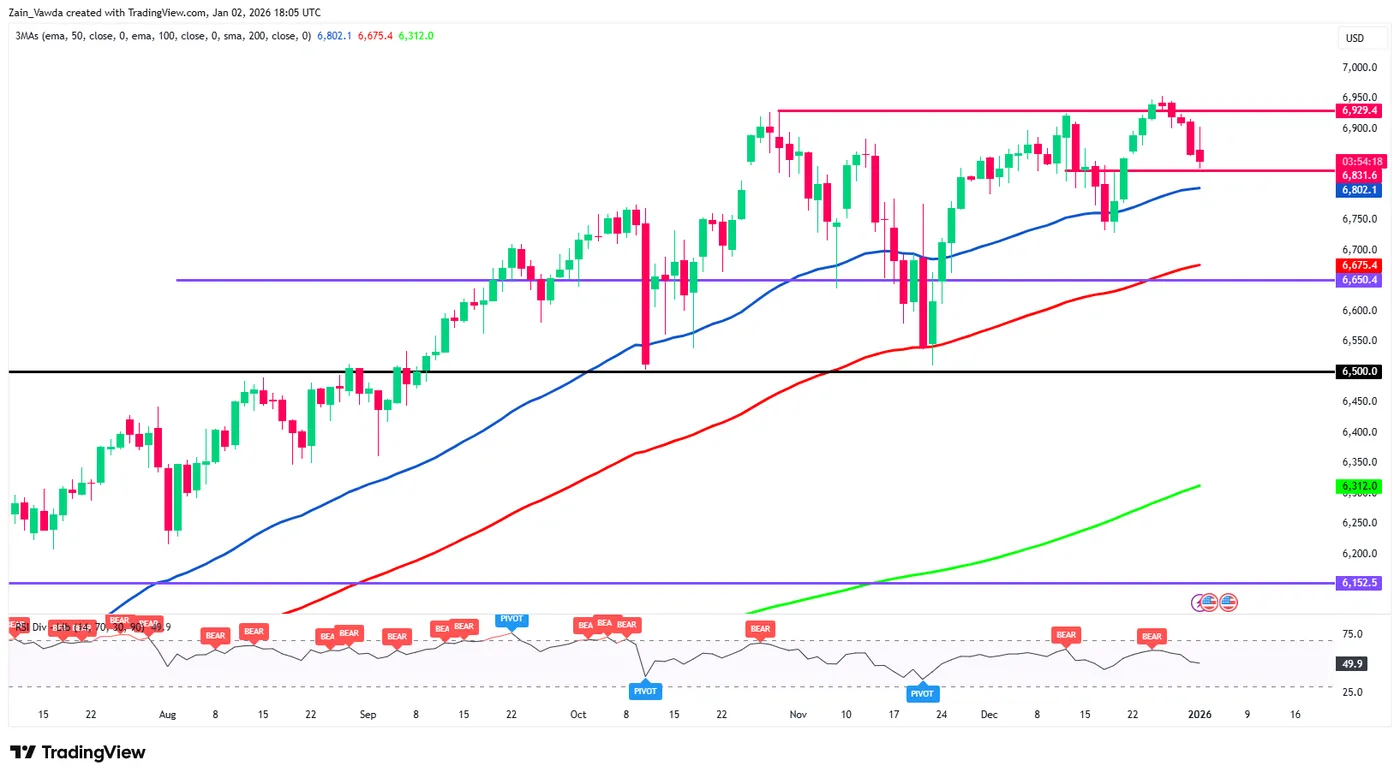
Source:TradingView.Com (click to enlarge)
The Weekly Bottom Line: More Political Chaos on Top of Underlying Resilience
Canadian Highlights
- Canada’s economy starts 2026 under a cloud as underlying domestic demand remains weak.
- Trade losses with the U.S. have been primarily offset by gains in resource, metals, and agricultural trade, while key manufactured goods still face tariff challenges.
- Building on positive momentum while addressing key underlying issues will be critical for success in 2026.
U.S. Highlights
- 2026 is shaping up to be another wild ride as international trade policy and the November midterm elections take top billing.
- The upcoming Supreme Court ruling on the scope of executive authority in setting tariff policy is expected in the coming weeks, while President Trump is expected to trigger the renegotiation of the USMCA ahead of its official review period in July.
- While the labour market is showing signs of easing, relatively robust inflation will likely limit the Fed to two cuts this year, while growth remains steady at around trend for 2026.
Canada – Time to Deliver
After a 2025 that featured a historic disruption to Canada’s economic relationship with its biggest trading partner, 2026 starts with the promise of a fresh start. The economy has shown some mettle, likely growing 1.7% in 2025 as data revisions revealed better-than-expected past performance and large swings in trade-flattered topline figures. However, there are real cracks under the surface (domestic demand contracted in two quarters this year) and focus is now firmly on how Ottawa’s strategy of new infrastructure, defense spending, and greasing the wheels on major projects to diversify trade markets begins to be delivered.
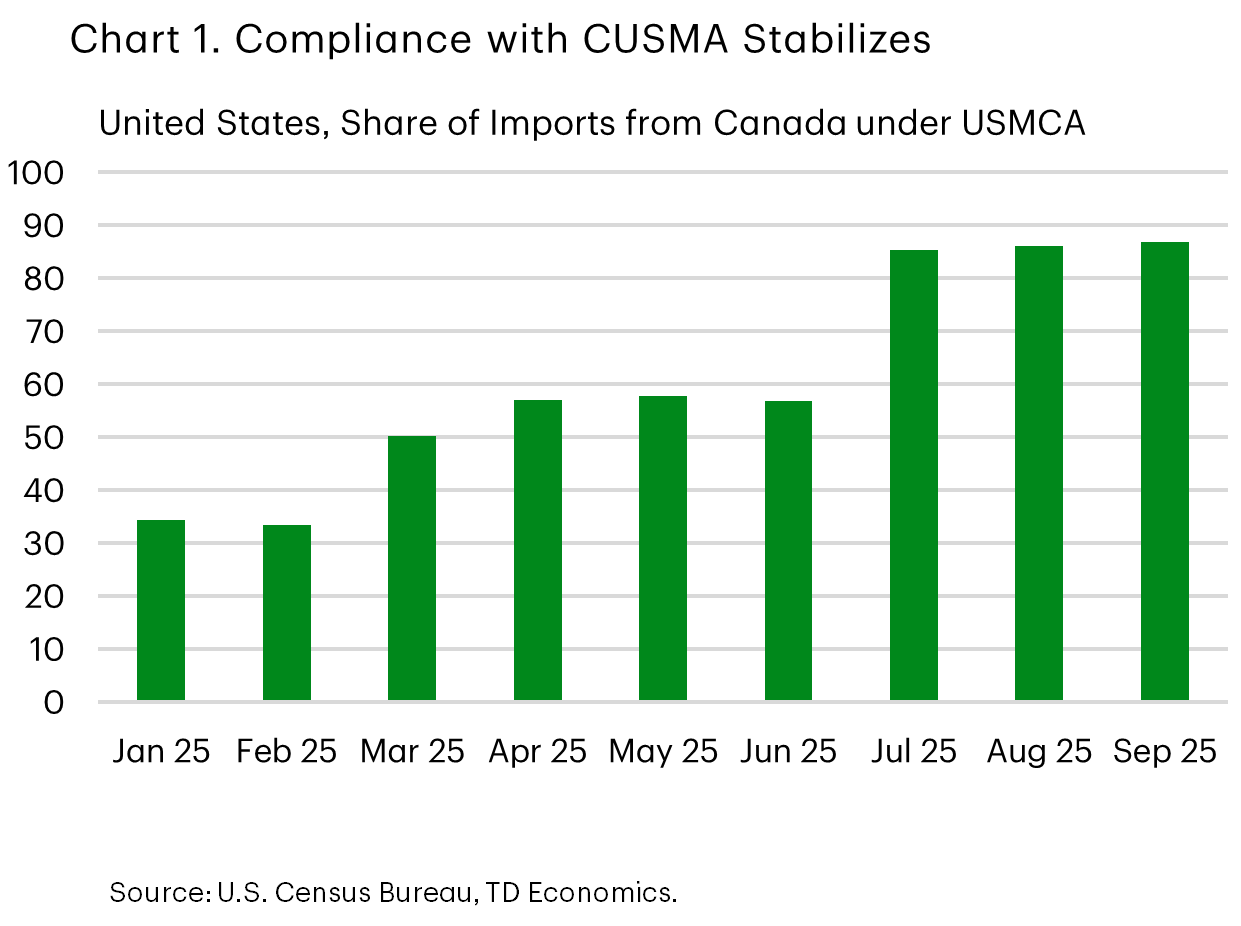
Next week, the trickle of data updates on Canada’s economy will resume. Delayed information on October’s trade balance will give another snapshot of how the process to diversify trading partners is going. Thus far, Canada has managed to more than offset the $13.0 billion decline in exports to the U.S. with $16.3 billion in flows to the rest of the world. Moreover, roughly 87% of Canadian exports to the U.S. in September (the last month for which we have data) were still duty-free as the increase in compliance under CUSMA has (thus far) shielded products from the 35% tariff rate (Chart 1). Unfortunately, there is more to this data than meets the eye.
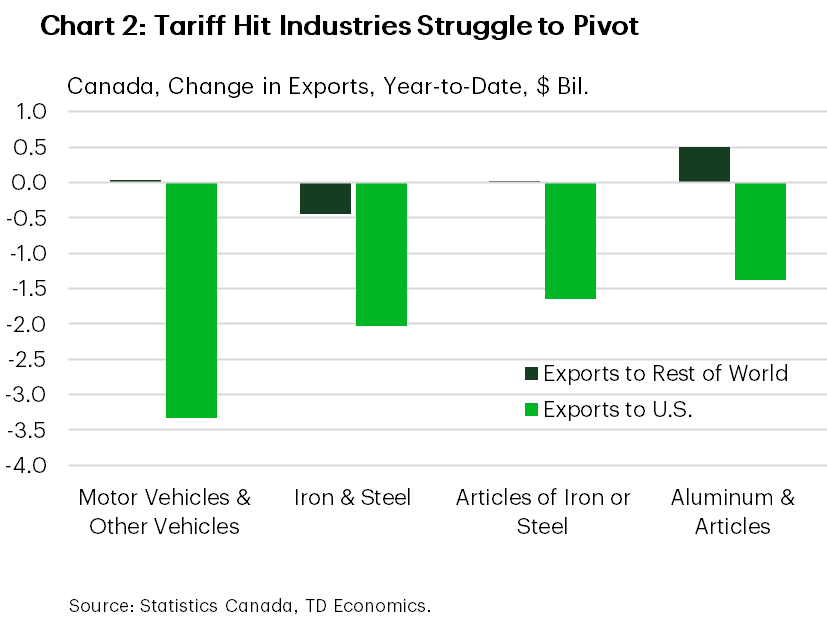
The protection conveyed by CUSMA doesn’t extend to specific goods tariffed under Section 232 of the Trade Expansion Act. These levies have materially affected the competitiveness of Canadian manufactured goods south of the border. Motor and Other Vehicles (-$3.3 billion year-to-date), steel & iron (-$2.0 billion), and aluminum (-$1.4 billion) exports to the U.S. have contracted significantly. Moreover, flows abroad for most of those products have not been sufficient to offset the lost revenues (Chart 2).
Secondly, the offsets to the trade losses are not coming from redirecting flows elsewhere, but by growth in other sectors. In fact, the economy has (generally) fallen back on the resource sector and raw materials sectors to grow exports. Leading the way are shipments of gold (+$5.3 billion), oil (+$3.8 billion), cereals (+0.9 billion) and fertilizer ($0.7 billion). A silver lining in non-resource sectors has been the aerospace industry. Aircraft exports are up over a billion dollars compared to the first nine months of 2024, and when jet engines are included in the tally, that contribution rises to roughly two billion dollars.
What the data reveal are the tricky particularities Canada faces when it comes to competing in the global marketplace. The regional elements of Canada’s economy mean that the parts of the country leading the charge on diversification are not necessarily those losing out from market access to our country’s largest trading partner. Moreover, CUSMA is set for a review this year, and its future is all but certain. Looking to 2026, the challenges facing the economy are daunting, so here’s hoping that the positive momentum (where we’ve seen it) can hold up while the key issues are addressed.
U.S. – 2026: More Political Chaos on Top of Underlying Resilience
Like it or not, 2025’s wild ride likely has more legs as 2026 is shaping up to be another rollercoaster year. Headline-grabbing political drama is likely to continue, coupled with an economy that will likely show resilience in the face of it.
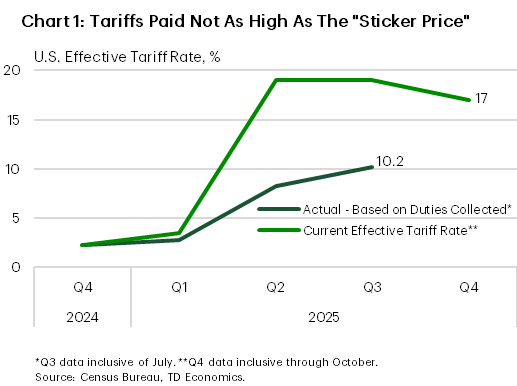
Trade policy will be front and center. One of the most closely watched legal developments is the Supreme Court’s pending decision regarding the scope of Presidential authority under the International Emergency Economic Powers Act (IEEPA), particularly as it relates to President Trump’s Liberation Day tariff package. With the decision expected in the coming weeks a ruling overturning the tariffs is unlikely to stem trade uncertainty given that the President could simply turn to other tariff measures. These include expanding Section 232 and 301 tariffs applied to imports deemed to be a national security threat or against countries that employed unfair trade practices against the U.S. Or, the President could employ unused tariff policies, including temporary Section 122 or 338 tariffs which are currently not in use. In either case, the decision will not un-ring the bell (Chart 1).
The renegotiation of the USMCA is another trade policy development to watch. While the official review doesn’t start until the 5th anniversary of the agreement in July, the U.S. has already released a list of trade concerns with Canada that will be part of negotiations. While the discussion could feature fits and starts as was the case in 2025, a renewed agreement would be a key factor in both lifting trade uncertainty in North America and opening the door for more countries to pursue deals that either fell by the wayside or did not exist at all last year.
The Midterm elections will be the main event to watch in 2026 – the house, 33 senate seats and 36 state gubernatorial races will be decided in November and a Democratic flip of either House or Congress could give Democrats renewed political power through committee and impede the President’s agenda in 2027. Current polling suggests the Senate will likely remain in Republican hands, while the House could lean in either direction depending on numerous close races.
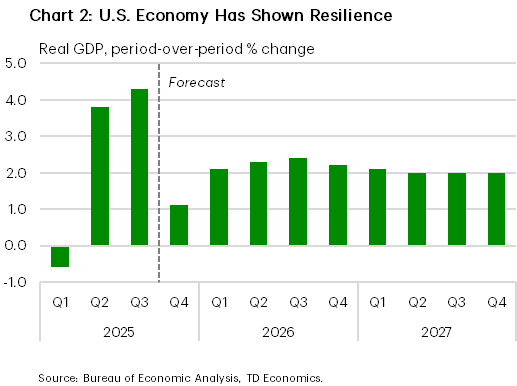
The evolution of economic growth will be a critical factor in deciding the outcome. To that end, the U.S. economy has shown more resilience than forecasters would have suggested a year ago, given the upending of international trade policy. GDP growth has averaged more than 4% in the 2nd and 3rd quarters, with a robust pace of consumer and business spending to boot. The fly in the ointment is that the labor market has notably weakened over time, with stagnant job growth pushing the unemployment rate to its highest level since 2021. But with domestic demand and inflation still holding up, we think this limits the Fed to just two additional cuts next year. The coming year will likely feature an evening out of these factors with still a healthy pace of growth around trend (Chart 2), driven by more trade certainty, the deregulatory impacts of the One Big Beautiful Bill Act, and ultimately, an underlying resilience that is hard to doubt.
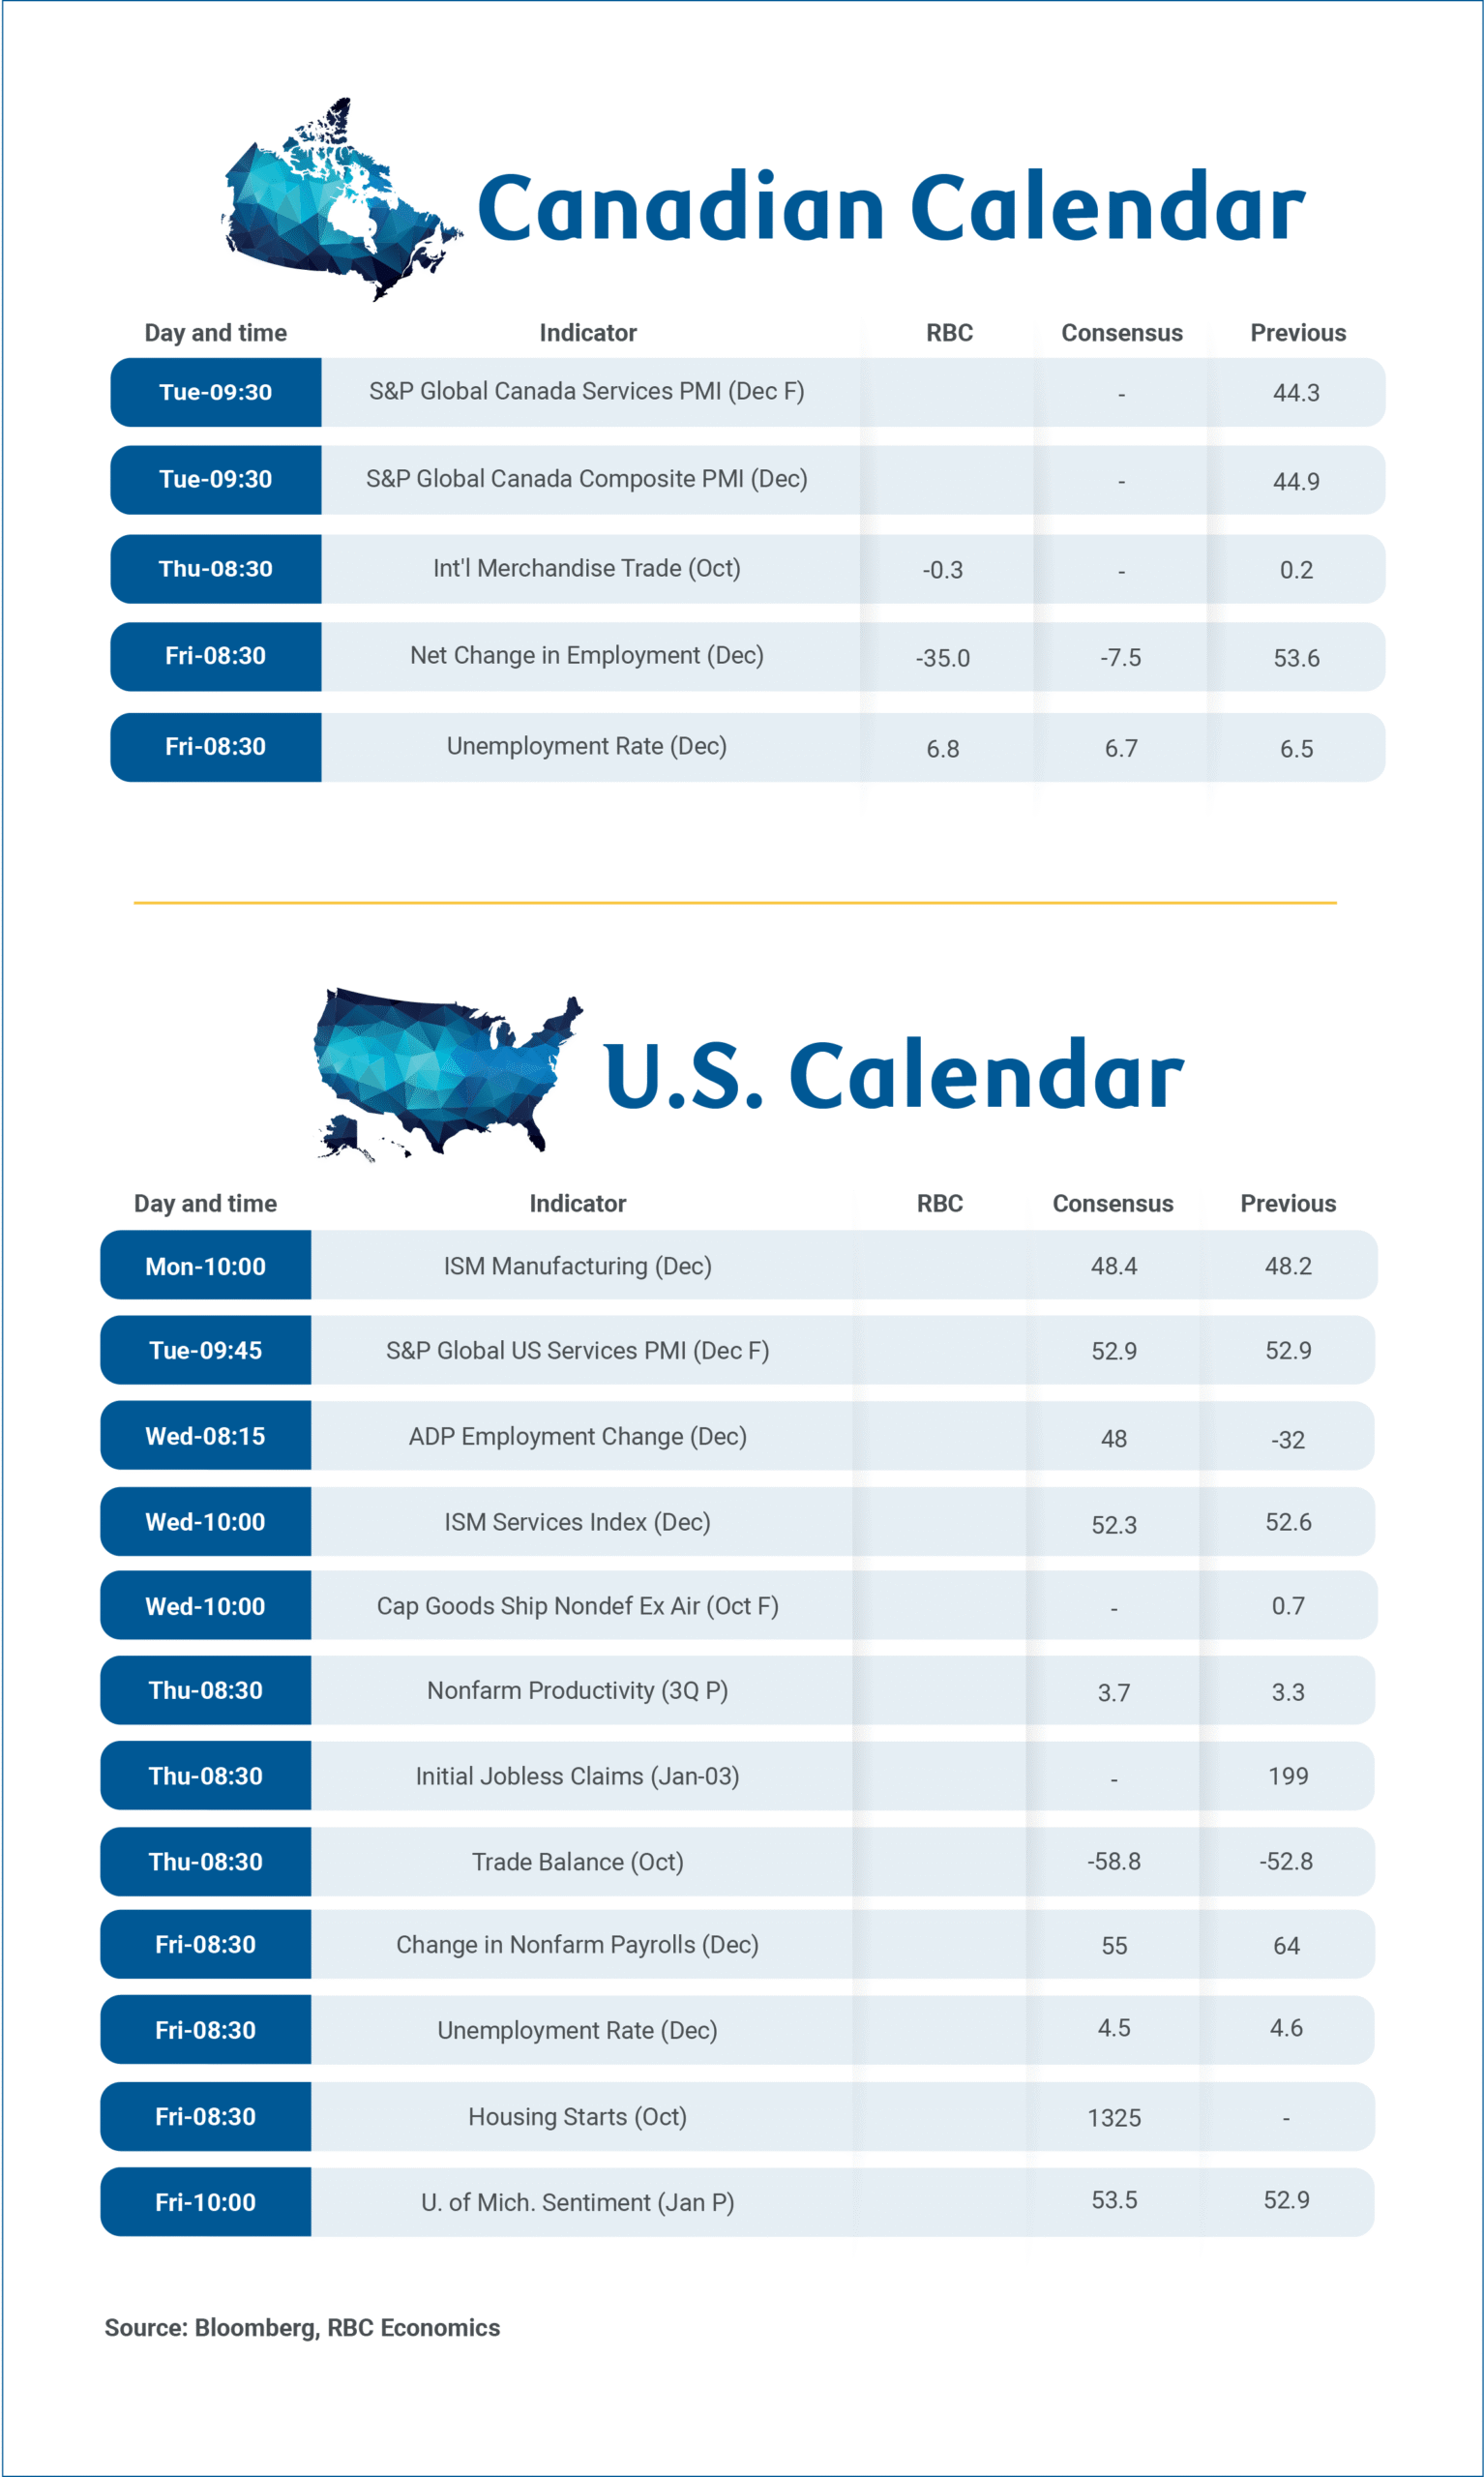
December Jobs Data Key Input for Bank of Canada January Decision
Labour market data will be back in focus next week with the dual release of Canadian and U.S. December employment reports on Friday, the first major Canadian data release of 2026 and an important input ahead of the Bank of Canada’s January policy decision.
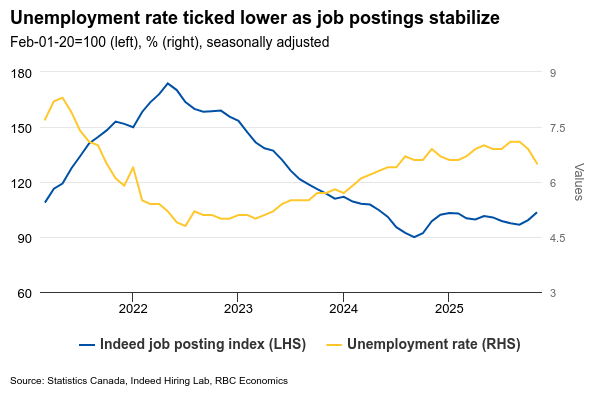
After a series of firmer-than-expected labour market prints through the fall, we expect Canada’s December data to show a pullback after a surprisingly large drop in November unemployment, but still consistent with early signs of broader stabilization in Canadian labour markets into the end of the year.
Changes in the monthly employment count are notoriously volatile, but we look for employment to decline by 35,000 in December, reversing more than half of November’s large gain. We expect the unemployment rate to rise to 6.8% to reverse most of (but not all) of the unusually large 0.4 percentage point drop to 6.5% in November.
Although November’s sharp decline in the unemployment rate appears difficult to sustain, the December increase we expect should be viewed as a partial reversal of that move rather than a signal of renewed labour market deterioration.
Details behind the upside surprise in the November employment data underscored the volatility in the monthly data, and may have reflected in part difficulties seasonally adjusting the data around the start of the holiday hiring period. Employment gains were again concentrated in part-time positions and among younger workers, while labour force participation declined. But the typically more stable core-age unemployment rate also declined and wage growth accelerated.
Heavily trade-exposed sectors continue to underperform broader employment trends. But there is little evidence that weakness has spread more broadly across the economy. And broader labour market conditions have shown further signs of stabilization.
Job postings data suggest hiring demand has stopped weakening and may be recovering modestly. And growth in the available labour force will continue to slow as federal government caps on temporary residence visas reduce population growth. The population aged 15+ already posted its smallest increase since May 2021 in November and highly likely slowed further in December given a reported pullback in total population in Q3.
From a policy perspective, December’s labour market report is unlikely to materially alter the Bank of Canada’s near-term outlook. We continue to expect the next change in interest rates from the BoC will be a hike, but not (as a base-case) until 2027.
Week ahead data watch:
Statistics Canada has flagged January 8th as the release date for October trade report, though timing remains preliminary given residual impacts from the earlier U.S. government shutdown. We expect October trade balance to move back to deficit, shifting from a $153 million surplus to roughly $283 million deficit, as export growth declines slightly while import growth edged higher. Lower oil prices, down 5.4% in October, likely pushed energy trade balance down. Motor vehicle shipments also reversed (-2%), following the jump in September.
In the U.S., employment growth is expected to remain slightly positive in December after a 64k gain in November. Employment growth has slowed to a crawl since tariffs escalated sharply with an average 17k per-month increase since April and the heavily exposed manufacturing sector posting job losses for 7 straight months. The unemployment rate jumped to 4.6% in November from 4.4% in September (the October unemployment rate could not be calculated due to the government shutdown that month.) That was the highest unemployment rate in more than 4 years, although current market consensus is looking for a tick lower to 4.5% in December.
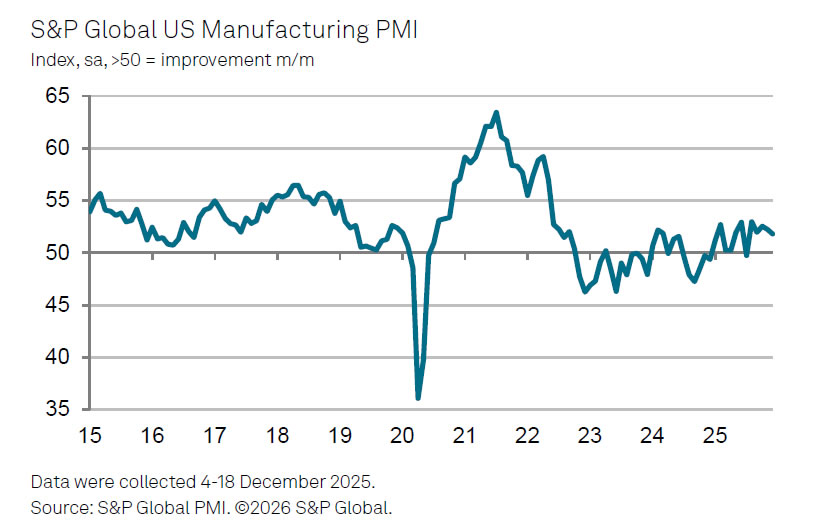
US PMI manufacturing finalized at 51.8, in Wile E. Coyote moment as orders lag output
US PMI Manufacturing was finalized at 51.8 in December, easing from November’s 52.2 and marking the weakest expansion in the current five-month growth stretch. While activity remains in growth territory, the slowdown points to fading momentum as the sector heads into 2026.
According to S&P Global Market Intelligence, output continued to rise in December, implying manufacturing still supported solid fourth-quarter growth. However, Chief Business Economist Chris Williamson warned of a “Wile E. Coyote” dynamic: factories are maintaining production even as new orders fall. The gap between output growth and declining orders is now the widest since the 2008–09 financial crisis, raising concerns over sustainability.
Unless demand improves, production is likely to be scaled back, with adverse implications for payrolls. Cost pressures remain a key headwind, as firms continue passing higher tariff-related costs to customers. Input cost inflation did moderate to its lowest since January, suggesting tariff effects peaked last summer, but costs are still rising at an elevated pace relative to other major economies.
Will US Dollar Make a Comeback in 2026? DXY Outlook
The US Dollar has just concluded one of its toughest years in recent memory, correcting approximately 10% from its early 2025 highs of 110.00.
Yet, even after a rough final month of trading, the Greenback is beginning to flash signs of a potential rebound.
The implications of this shift are significant. A new year often marks the genesis of new market trends as traders and asset managers reassess their allocations. In Currency Markets, the dominant narrative for 2026 will hinge on whether the US Dollar continues to suffer outflows or if that theme died with 2025.
With the Euro and Swiss Franc finishing the year on top, the question remains: is there more upside left in the tank?
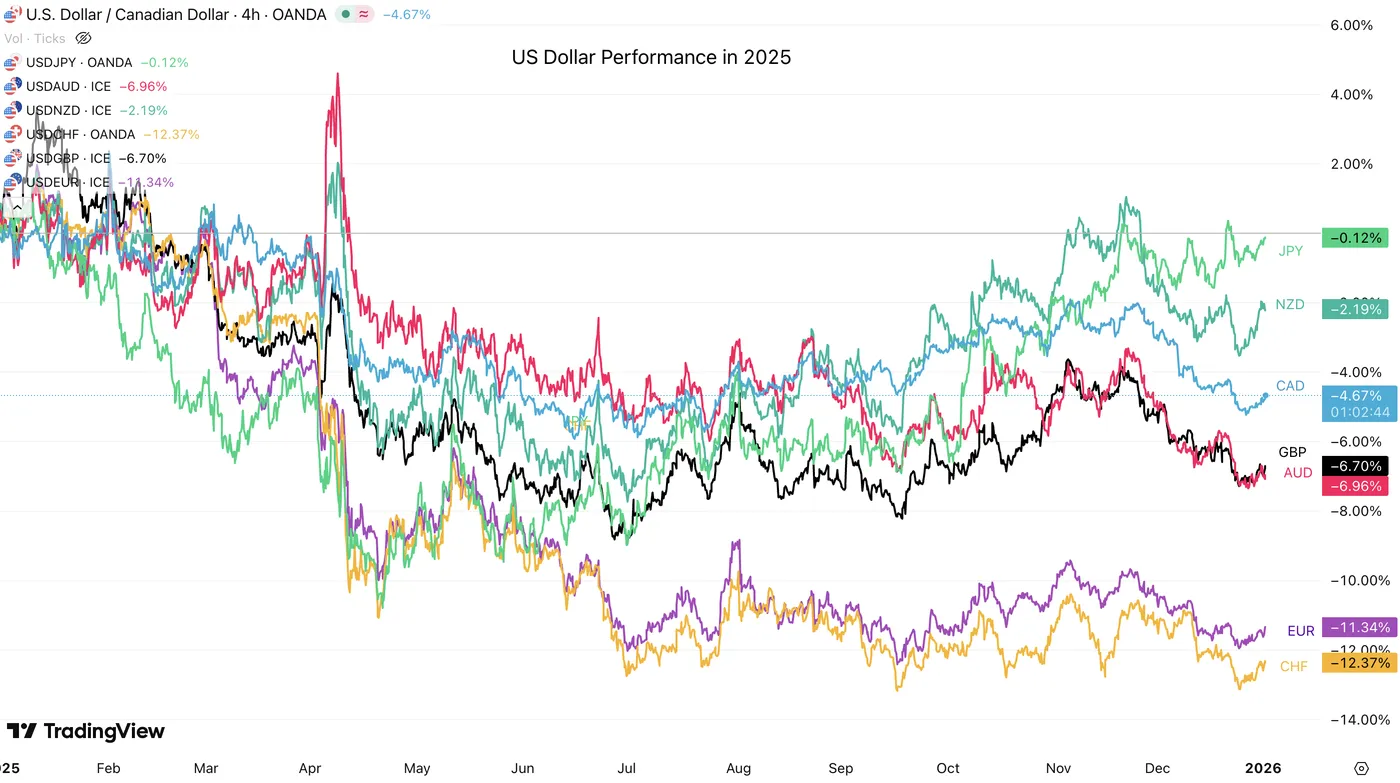
Performance of other currencies against the US Dollar in 2025 – Source: TradingView
Much of this will depend on whether regional growth can be sustained. Continued defense spending within the EU area is expected to act as a broad positive for the Euro. However, the USD still holds several trump cards:
- Feasibility of Diversification: Investors seeking fixed-income alternatives that rival the depth and liquidity of US Treasuries may find their options limited, naturally steering flows back to the dollar.
- Cash Positioning: With fund managers' cash levels at historic lows, a mean-reversion toward safety amid elevated equity valuations could provide a structural uplift for the USD.
- Legal & Economic Catalysts: If the US economy remains resilient, or if controversial tariffs are struck down by the Supreme Court, asset managers caught offside could be forced to cover, sparking a rally.
On the flip side, risks remain skewed to the downside if economic weakness accelerates, if the Fed's independence is compromised by a new Chair appointment in May 2026, or if further instability from the Trump Administration triggers a fresh wave of global outflows.
Let's dive right into a few Dollar Index (DXY) charts to see what the trading candles could foreshadow for the Greenback.
Dollar Index Technical Outlook
Daily Chart
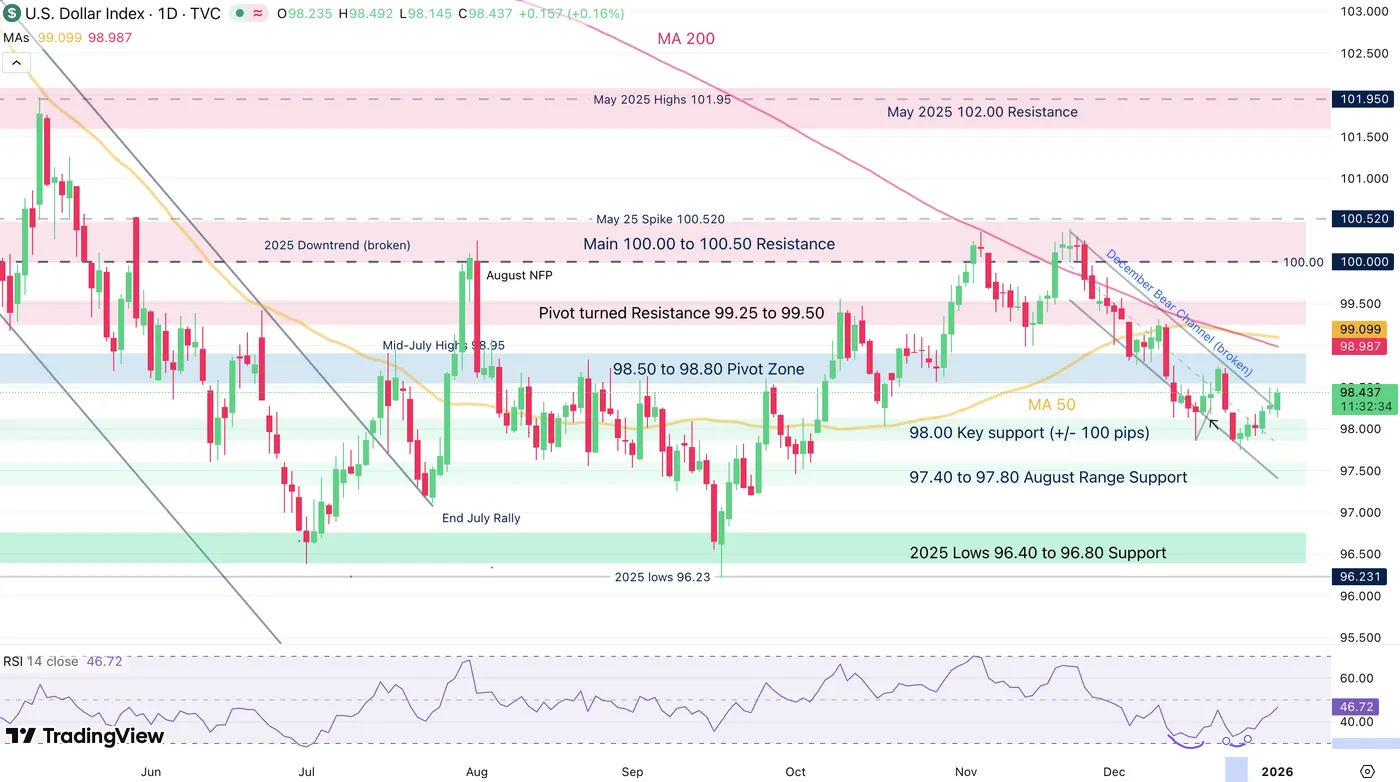
Dollar Index (DXY) Daily Chart. January 2, 2025 – Source: TradingView
The US Dollar just broke out of its descending channel formed since the end of November.
Weakened by a reinstalled outflows ahead and after the cut, sellers took back the action after the DXY reached the 100.00 Level.
Now rebounding from the 98.00 handle, buyers could be making a reappearance in order to retake the advantage after a RSI double-bottom.
Let's take a closer look.
4H Chart and Trading Levels
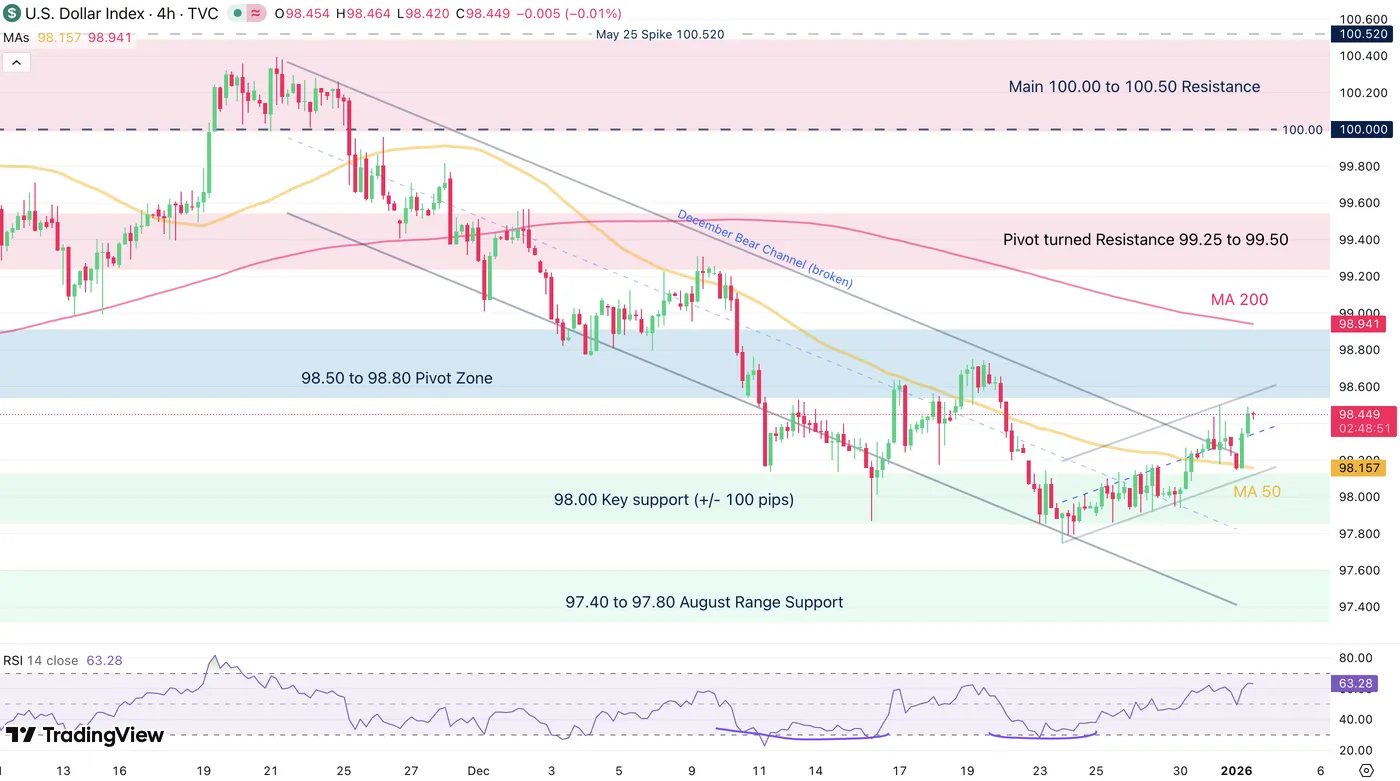
Dollar Index (DXY) 4H Chart. January 2, 2025 – Source: TradingView
Now bouncing from its intraday moving average, the USD is elevating towards the 98.50 to 98.80 Pivot Area. Watch if buyers manage to push above the 98.50 session highs.
Bouncing back above would generate a high probability setup of a test of the 100.00 level, implying down performance of other FX Currency Majors.
Levels to place on your DXY charts:
Resistance Levels
- 98.50 to 98.80 Pivot Zone (immediate test)
- 98.58 (200-Hour Moving Average)
- Pivot turned Resistance 99.25 to 99.50
- 100.00 to 100.50 Main resistance zone
- 100.376 November highs
Support Levels
- 98.00 Key support (+/- 100 pips) – Recent rebound
- 97.75 Recent lows
- 97.40 to 97.80 August Range Support
- Mini-support 98.50
- 2025 Lows 96.40 to 96.80 Support
- Safe Trades and Happy New Years!
Silver (XAG/USD): A Major Top or a Correction Before New Highs?
Key takeaways
Silver’s 2025 surge was exceptional but stretched: XAG/USD gained 159% in 2025, driven by safe-haven flows and strong industrial demand, yet the late-December sell-off and extreme positioning have raised near-term bubble concerns.
No major secular top yet, but a medium-term peak likely in place: The Silver/Gold ratio and distance from the 200-day MA are elevated but still below historical levels that preceded long-term collapses, suggesting the rally is not structurally exhausted.
High odds of a multi-week correction before new highs: Elliott Wave and momentum signals point to the completion of a medium-term wave III, implying a corrective wave IV toward key supports before a potential final bullish wave V unfolds.
2025 was a banner year for both precious and industrial metals, where gold and silver doubled/quadrupled their typical moves, while copper hit multi-year highs on a mix of supply shocks and Chinese demand expectations.
Silver emerged as the top performer among the major cross-assets in 2025, with an annual gain of 159%, its best performance since the inflationary crisis period of 1979, according to data from the London Bullion Market Association (LBMA) (see Fig. 1).
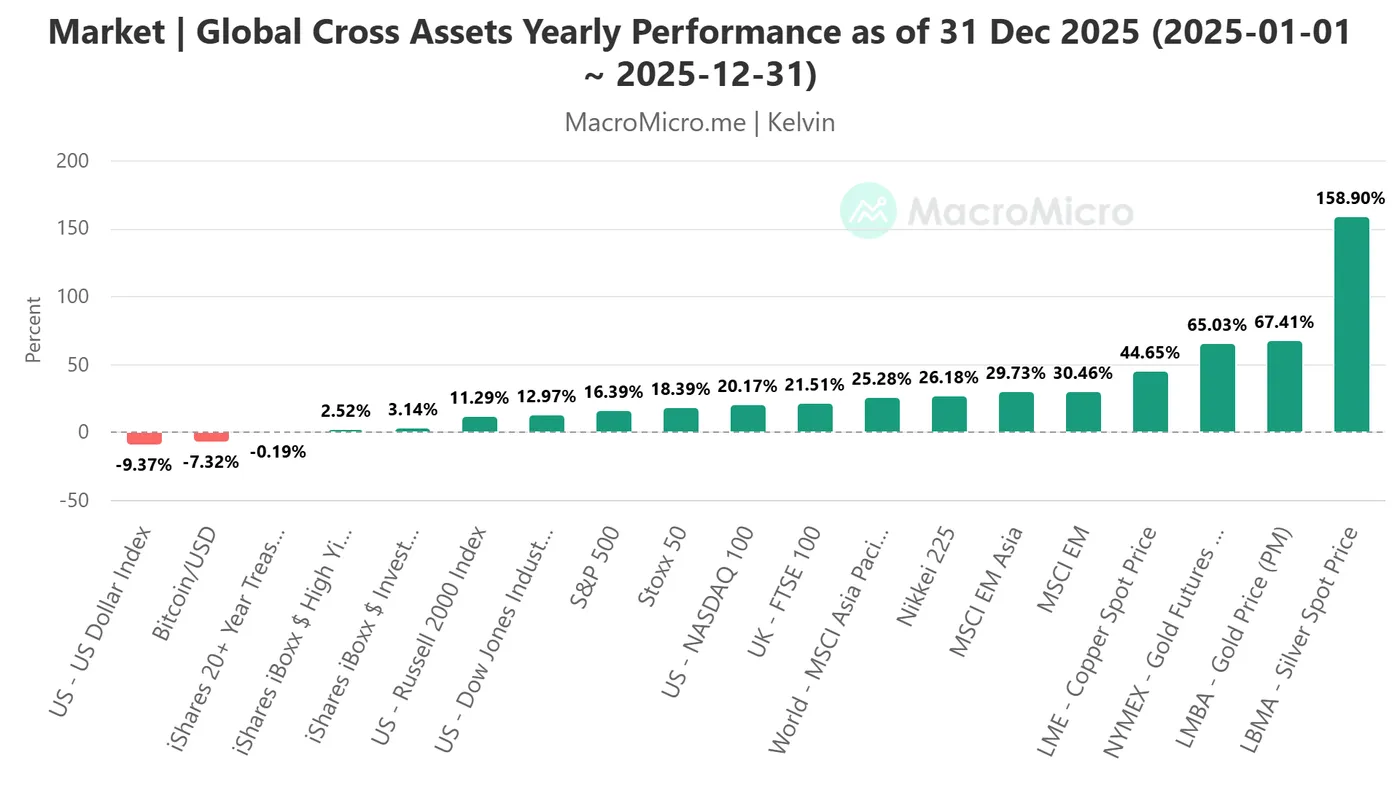
Fig. 1: Annual performances of cross assets as of 31 Dec 2025 (Source: MacroMicro)
Silver’s powerful rally has been underpinned by its dual appeal as both a safe-haven asset and a critical industrial metal, with robust demand from fast-growing sectors such as solar energy, electronics, and data centres.
After it hit a fresh all-time intraday high of US$84.03 on 29 December 2025, silver (XAG/USD) tumbled by 9% to end the session lower on the same day, where it also recorded its worst daily performance since August 2020.
The frenetic price action seen in the final two weeks of December 2025 has once again reignited fears of a speculative bubble bursting in silver (XAG/USD), drawing comparisons with the sharp bearish reversals witnessed in 2011 and 1980.
Let’s break down the details from a technical analysis standpoint.
Silver/Gold ratio suggests silver has reached a potential major topping process
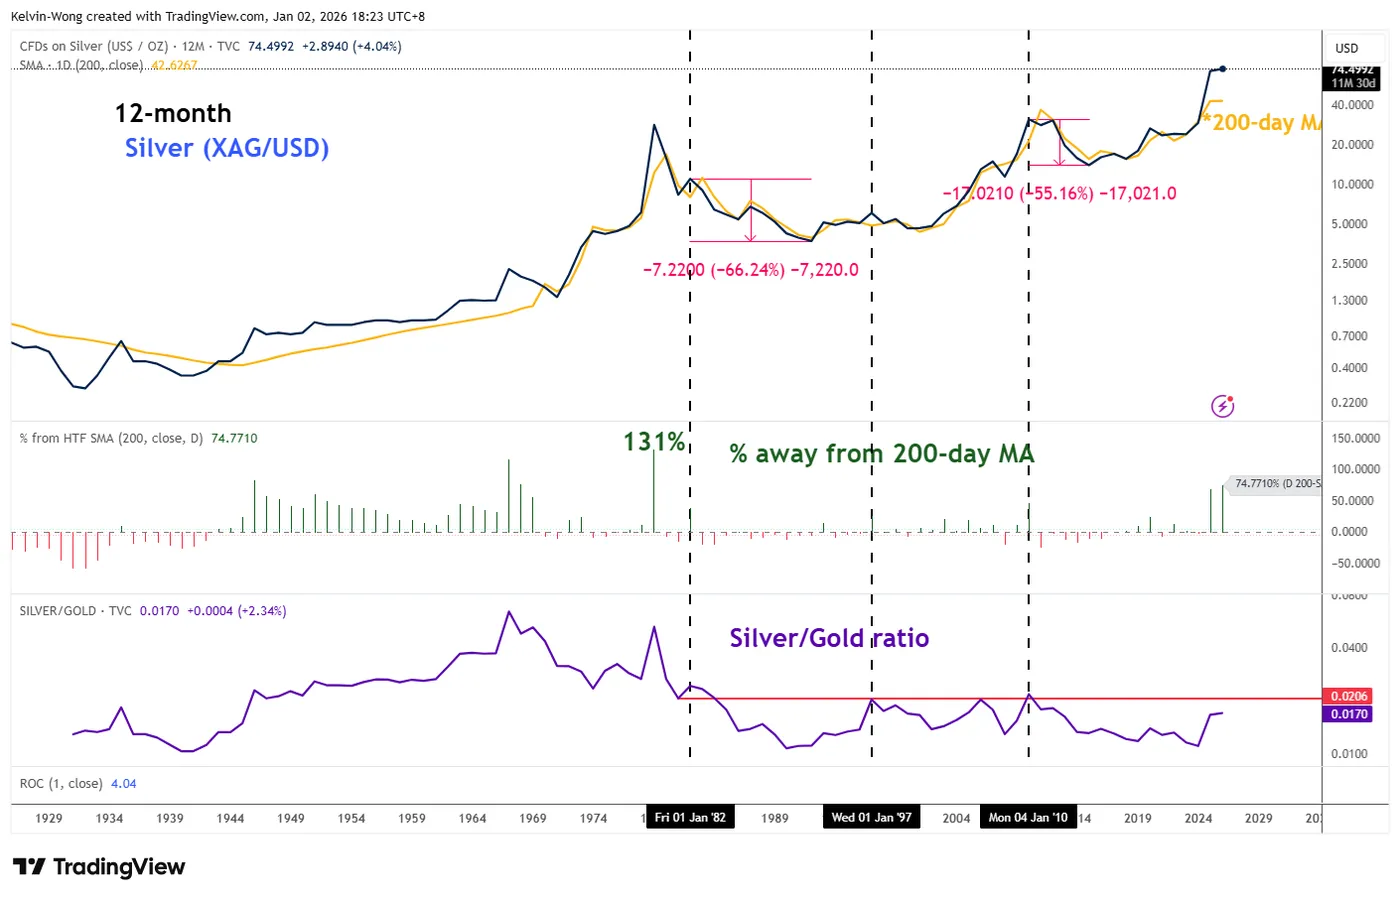
Fig. 2: Long-term secular trend of Silver with Silver/Gold ratio & % away from 200-day MA as of 2 Jan 2026 (Source: TradingView)
The current value of the Silver/Gold ratio on the 12-month chart stands at 0.017, which is still below a historically significant level of 0.0206, where it triggered off a major corrective decline of silver (-66%) and (-55%) during the 1982 to 1992 and 2010 to 2015 periods (see Fig. 2).
Although silver is currently trading about 75% above its 200-day moving average, a multi-decade extreme, it remains well below the 115% to 131% stretch reached during the high-inflation episodes of 1967 and 1979, which preceded a severe, 13-year collapse in prices till 1992.
Therefore, these observations suggest that silver has not reached a major top yet.
Elliot Wave/Fibonacci analysis suggests the end of a medium-term uptrend
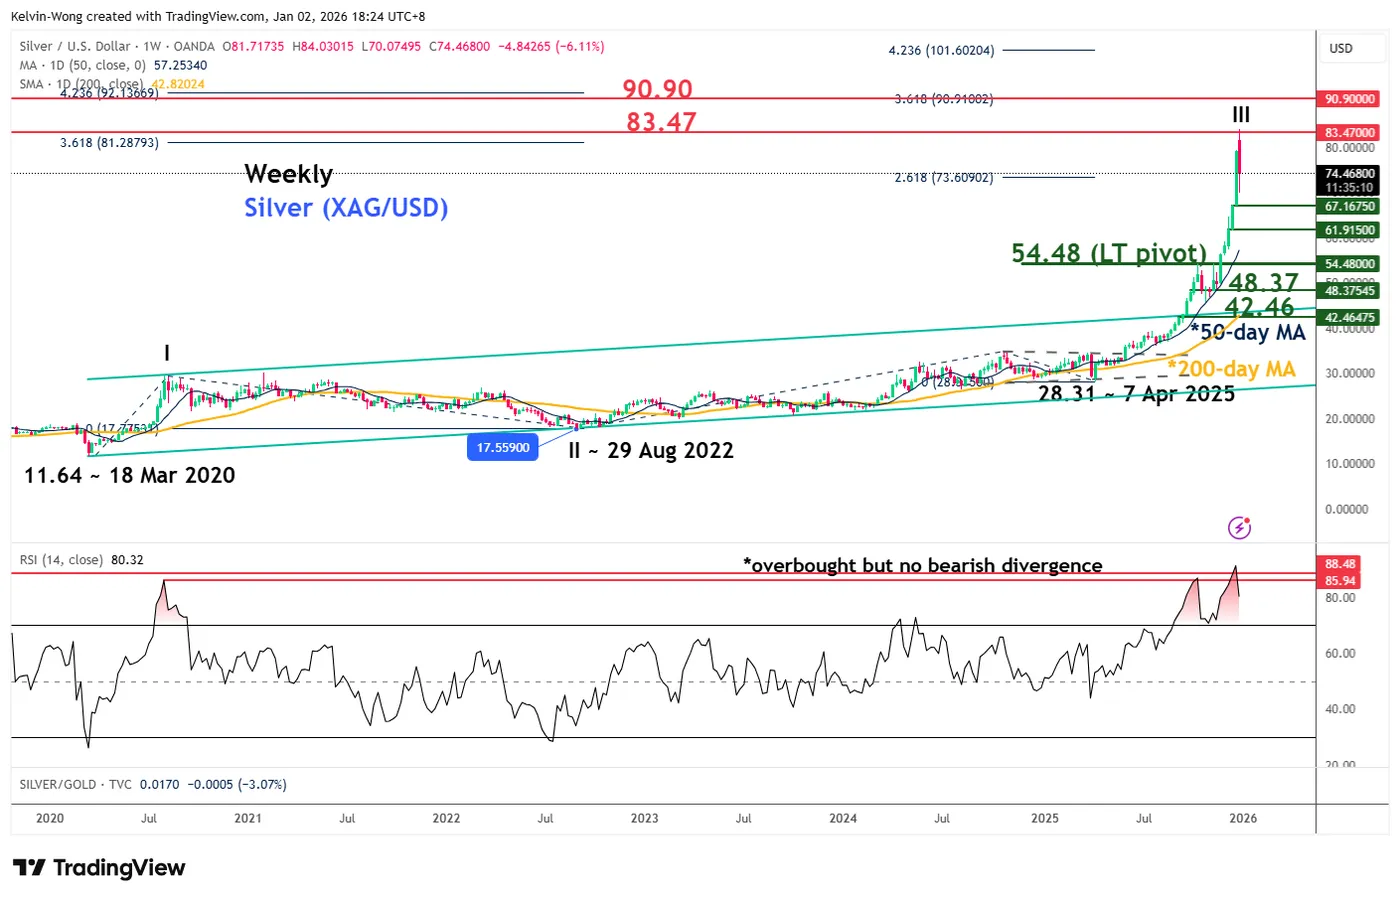
Fig. 3: Silver (XAG/USD) major trend of 2 Jan 2026 (Source: TradingView)
Based on Elliot Wave/Fibonacci analysis, the price action structure of silver (XAG/USD) is likely to have completed its medium-term bullish impulsive up move sequence from the week of 29 August 2022 low of US$17.56 after it met a Fibonacci extension price target of US$83.47 (labelled as a bullish wave III) on 29 December 2025 (printed an all-time intraday high of US$84.03) (see Fig. 3).
In addition, the weekly RSI momentum indicator has hit an extreme overbought level of 85/88 but has not flashed out any bearish divergence condition.
These observations suggest that silver (XAG/USD) has not completed a major bullish five-wave cycle, labelled as I, II, III, IV, V according to Elliot Wave.
Hence, the all-time high of US$84.03 printed on 29 December 2025 marks the potential termination of a medium-term bullish wave III (end of a medium-term uptrend), where the next probable move is a potential multi-week (at least) corrective decline sequence to kickstart a corrective wave IV before bullish wave V materializes with key long-term pivotal support at US$54.48 to maintain the major bullish structure.
Multi-week correction in process below US$84.03 key medium-term resistance
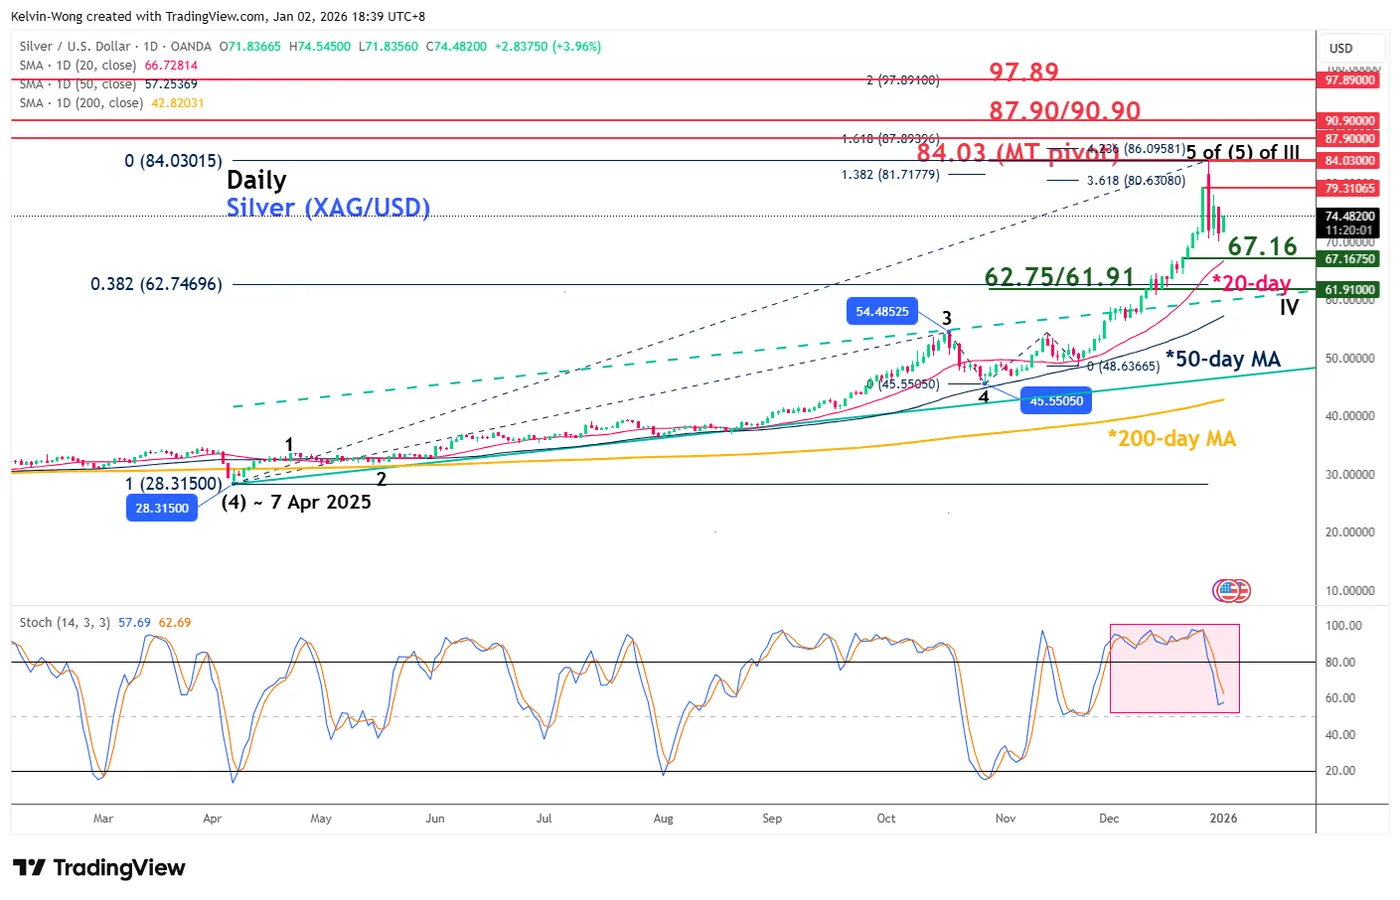
Fig. 4: Silver (XAG/USD) medium-term trend of 2 Jan 2026 (Source: TradingView)
The price actions of silver (XAG/USD) as seen from its daily chart suggest the risk of a multi-week mean reversion/corrective decline sequence towards the 20-day and 50-day moving averages.
In addition, the daily Stochastic oscillator has exited from its overbought region (above 80) and still has ample room before it reaches its oversold region (below 20).
Watch the US$84.03 key medium-term pivotal resistance with the next medium-term supports coming in at US$67.16 and US$62.75/61.91 (also the 38.2% Fibonacci retracement of the medium-term uptrend from 7 April 2025 low to 29 December 2025 high and the pull-back support of the former resistance of the ascending channel) (see Fig. 4).
On the other hand, clearance and a daily close above the US$84.03 key medium-term resistance invalidates the bearish scenario for the continuation of the bullish impulsive up move sequence to expose the next medium-term resistances at US$87.90/90.90 and US$97.89.