
Sample Category Title
GBP/USD Daily Outlook
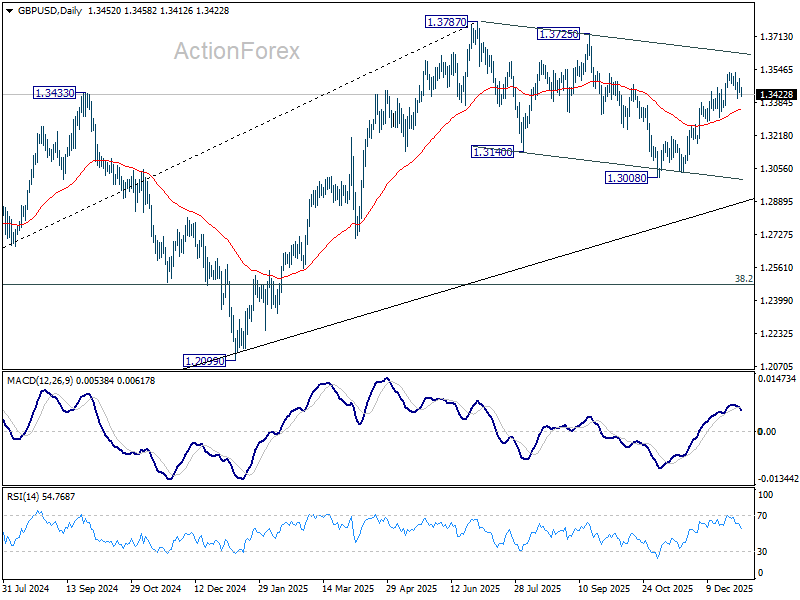
Daily Pivots: (S1) 1.3430; (P) 1.3466; (R1) 1.3498; More...
GBP/USD is staying in range and intraday bias stays neutral at this point. Further rally is in favor with 1.3356 support intact. Above 1.3533 will resume the rally from 1.3008 to retest 1.3787 high. However, firm break of 1.3356 will turn bias back to the downside for deeper pullback.
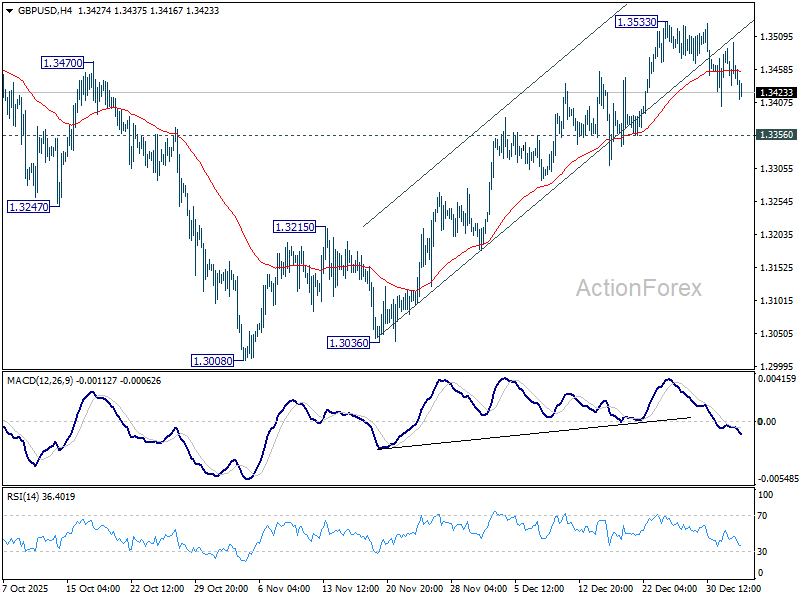
In the bigger picture, current development suggests that fall from 1.3787 is merely a corrective move, and larger rise from 1.0351 (2022 low) is still in progress. Firm break of 1.3787 will target 1.4248 (2021 high) key structural resistance. This will remain the favored case as long as target 38.2% retracement of 1.0351 to 1.3787 at 1.2474 holds, in case of another fall.
US Intervention in Venezuela Grabbing Lots of Media Attention But Not So Much Markets
Markets
The US intervention in Venezuela over the weekend is grabbing lots of media attention but not so much that of the markets. Geopolitical events rarely impact markets on a lasting basis. The Trump administration ultimately strives for a regime shift with motives stretching from Maduro seen as the illegitimate (and now former) president to Venezuela lambasted as a narco-state impacting the US over the opportunities seen in the country’s failing oil industry. Haven assets including gold are rising this morning but so are the riskier segments in the market. Asian stocks surge up to 3% at the open, led by Japan. The Nikkei225 is inches away from its October 2025 record high. Oil prices swung between losses and gains only to trade little changed at around $60.5 per barrel currently (Brent). US government bonds gain a little. Yields erase some of Friday’s slight gains. Curves turned steeper at the end of last week, particularly in Europe where rates rose between 1.7 and 6.4 bps in the German case. 10-yr tenors (swap, Germany) are nearing important technical levels around 3%. Japan shows a similar steepening this morning. The traditional upcoming supply at the start of the year, corporate and governments alike, is a potential driving force. Slovenia (new 10-yr benchmark EUR transaction today) is a case in point. The jury’s out on the eventual impact of supply on the curve with many (especially sovereigns) targeting shorter maturities to reduce interest rate costs. But the sheer - often record - amount of financing needs is bound to push yields generally higher. The US dollar extends its recent bottoming out process. The gradual recovery of the trade-weighted index kicked in since Christmas Eve at sub 98 and built to 98.66 currently. Everything remains the same technically in 2026 as in 2025 though. EUR/USD is no different with the pair depreciating back below 1.17 after hitting 1.18 two weeks ago. The sideways trading range between 1.14 and 1.19 in place since the summer of 2025 is very much in play. A slightly weaker euro also drags EUR/GBP back below 0.87 for the first time since October.
The first full week of the new year immediately offers an interesting economic calendar that should already shape central bank expectations for the broader Q1, particularly for the Fed. The US kicks off with the manufacturing ISM (December) today with the services gauge due on Wednesday, along with the ADP job and JOLTS reports. Friday’s December payrolls are the highlight. Inflation numbers are due in the euro area but won’t alter market expectations for the ECB’s status quo.
News & Views
The eight OPEC+ countries (Saudi Arabia, Russia, Iraq, UAE, Kuwait, Kazakhstan, Algeria and Oman) reaffirmed their November decision to pause production increments in February and March. Delegates said that they didn’t discuss Venezuela in their monthly update and that it’s premature to assess the impact of the situation and the cartel’s reaction function to it. Lowest oil prices in four years’ time and forecasts of a significant global oil surplus are key considerations. OPEC+ meets again on February 1st. The next official OPEC meeting is scheduled for June 7, 2026.
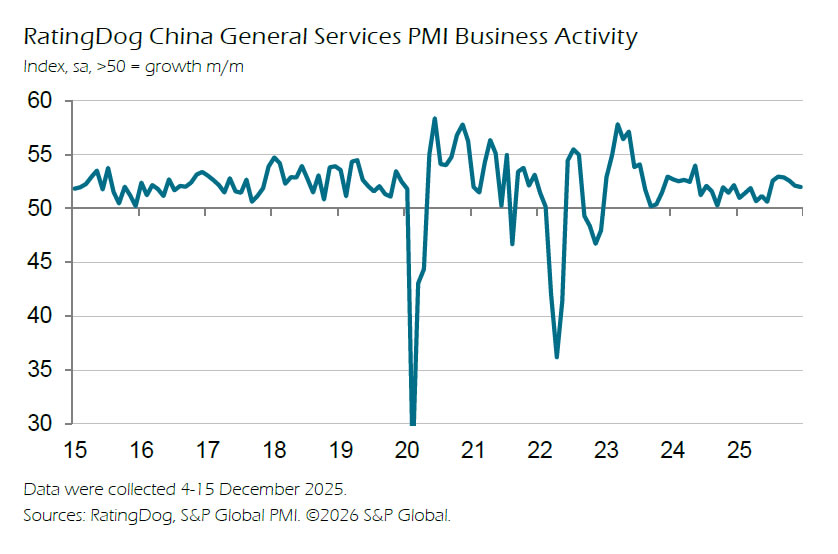
The private (RatingDog) Chinese services PMI stabilized at 52 in December (from 52.1), matching consensus forecasts. The statement suggested that a smaller number of, especially Japanese, tourists was responsible for a renewed drop in new export business. The employment component slipped further into contraction territory (48.9 from 49.2) while prices charged fell compared with November. The manufacturing PMI was already published last week and unexpectedly returned above the 50 boom/bust mark (50.1 from 49.9). Both output and new orders rose compared to November. Official PMI’s showed a similar end-of-year rebound driven by large manufacturing firms.
EUR/USD Daily Outlook
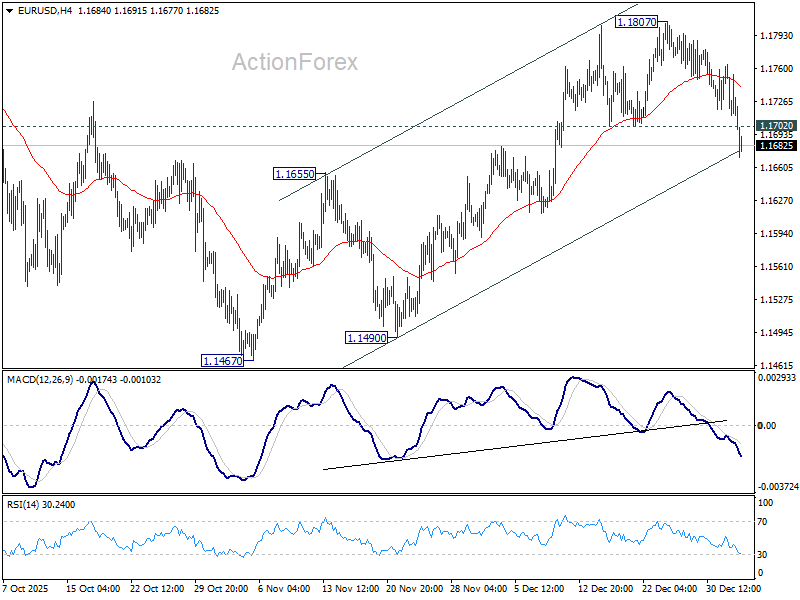
Daily Pivots: (S1) 1.1701; (P) 1.1733; (R1) 1.1753; More….
EUR/USD's fall from 1.1807 accelerated lower today and the break of 1.1702 support suggests that rise from 1.1467 could have completed with three waves up to 1.1807. The development argues that fall from 1.1807 is the third leg of the whole pattern from 1.1917 high. Intraday bias is back on the downside. Sustained trading below 55 D EMA (now at 1.1670) will affirm this case and target 1.1467 support and below. For now, risk will stay on the downside as long as 1.1807 resistance holds, in case of recovery.
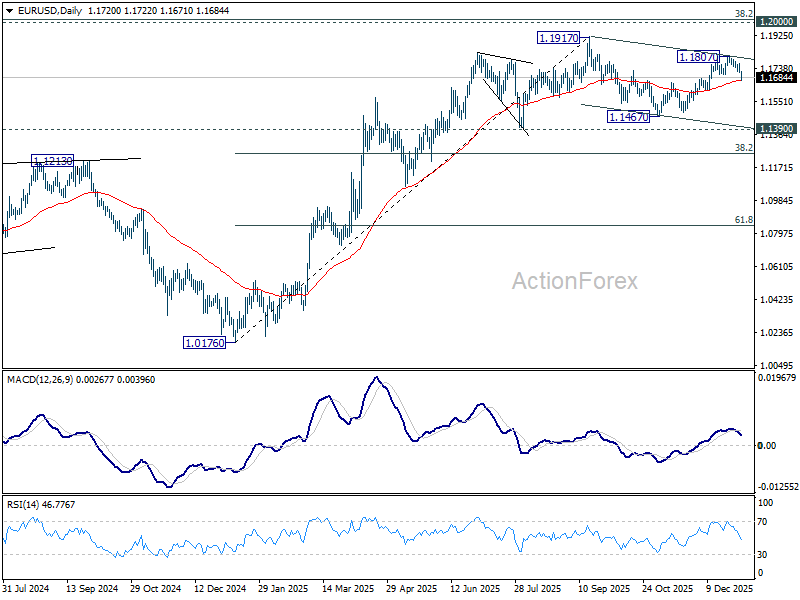
In the bigger picture, as long as 55 W EMA (now at 1.1408) holds, up trend from 0.9534 (2022 low) is still in favor to continue. Decisive break of 1.2 key psychological level will carry larger bullish implication. However, sustained trading below 55 W EMA will argue that rise from 0.9534 has completed as a three wave corrective bounce, and keep long term outlook bearish.
Safe-Haven Bid Lifts Dollar and Metals, But Geopolitics Fail to Disrupt Risk Assets
As liquidity conditions have normalized quickly after the holiday lull, markets are digesting the fallout from Washington’s weekend raid in Venezuela and the capture of President Nicolás Maduro. While the operation initially triggered a spike in geopolitical risk, price action suggests investors remain cautious but far from alarmed.
The greenback rallied broadly alongside precious metals as safe-haven demand picked up. However, risk sentiment has not deteriorated meaningfully. Asian equities were notably resilient, with Nikkei 225 posting strong gains, indicating the absence of broad risk-off positioning. Oil prices have also remained relatively steady, reinforcing the view that markets are not yet pricing material supply disruption or wider geopolitical spillovers. For now, the reaction remains contained across asset classes.
That reflects a familiar pattern. Unless geopolitical shocks escalate beyond regional boundaries, markets tend to refocus quickly on macro fundamentals. So far, investors appear to be treating developments in Venezuela as serious but localized.
Attention is therefore shifting back to the economic calendar for clearer directional guidance. This week’s focus is firmly on heavyweight US data, beginning with ISM Manufacturing, followed by ISM Services midweek. The main event, however, will be December non-farm payrolls on Friday. The report will offer the first clean read on US labor conditions following last year’s data distortions and is likely to drive short-term volatility across FX and rates.
Even so, the set of data is unlikely to alter expectations for a January hold by the Fed. While the data could influence pricing around a possible March rate cut, it will not be decisive, with further inflation and employment releases due before that meeting.
For now, Dollar sits at the top of the performance table, followed by Yen and Swiss Franc as secondary haven beneficiaries. At the other end, Aussie lags, trailed by Loonie and Kiwi. Euro and Sterling are trading in the middle.
In Asia, Nikkei closed up 2.97%. Hong Kong HSI is up 0.02%. China Shanghai SSE rose 1.38%. Singapore Strait Times is up 0.67%. Japan 10-year JGB yield rose 0.048 to 2.122.
Gold and Silver bounce on Venezuela shock, bull trends intact
Safe-haven demand is flowing back into precious metals, with Gold and Silver posting notable rebounds at the start of the week. Price action in both metals remains corrective following recent record highs. The resilience reinforces the view that larger uptrends remain intact for new record highs later in Q1.
The trigger for the renewed haven bid was news that the US captured Venezuelan President Nicolás Maduro over the weekend. Saturday’s operation marked Washington’s most controversial intervention in the region since the invasion of Panama nearly four decades ago. The symbolism of the move have unsettled regional stability assumptions, pushing investors back toward assets perceived as protection against geopolitical shocks.
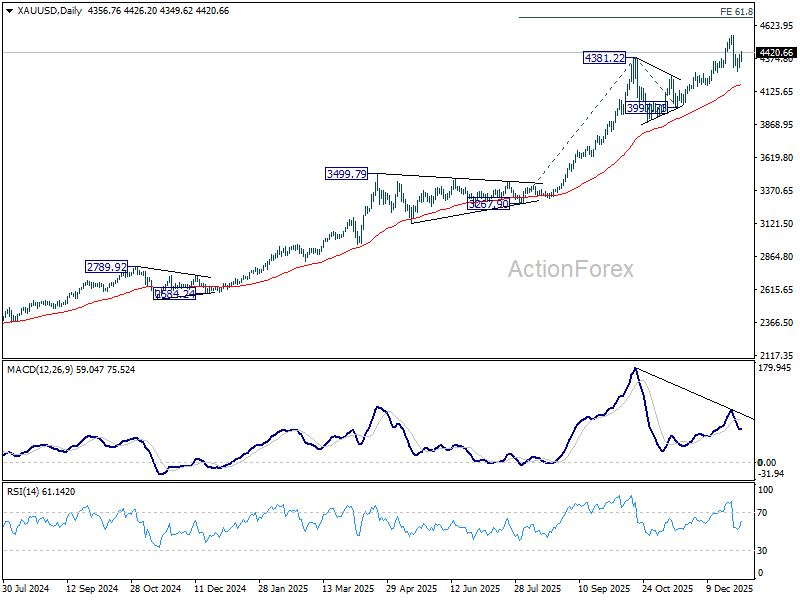
Technically, Gold’s recent pullback from 4549.90 was slightly deeper than expected, nearly reaching 50% retracement of 3,997.73 to 4,549.90 at 4,273.81. Still, price has remained well supported above 55 D EMA (now at 4,172.34), keeping the long-term uptrend intact.
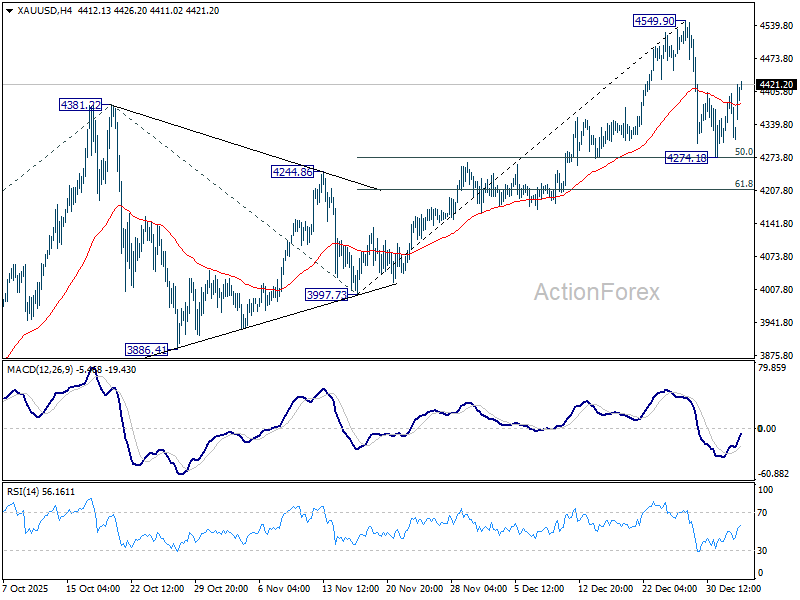
Once the current consolidation phase completes, the longer-term bullish trend is expected to reassert itself. Decisive break above 4,549.90 would open the way toward 61.8% projection of 3,267.90 to 4,381.22 from 3,997.73 at 4,685.76. However, bearish divergence on D MACD suggests strong resistance could emerge near that zone, capping upside on the first attempt.
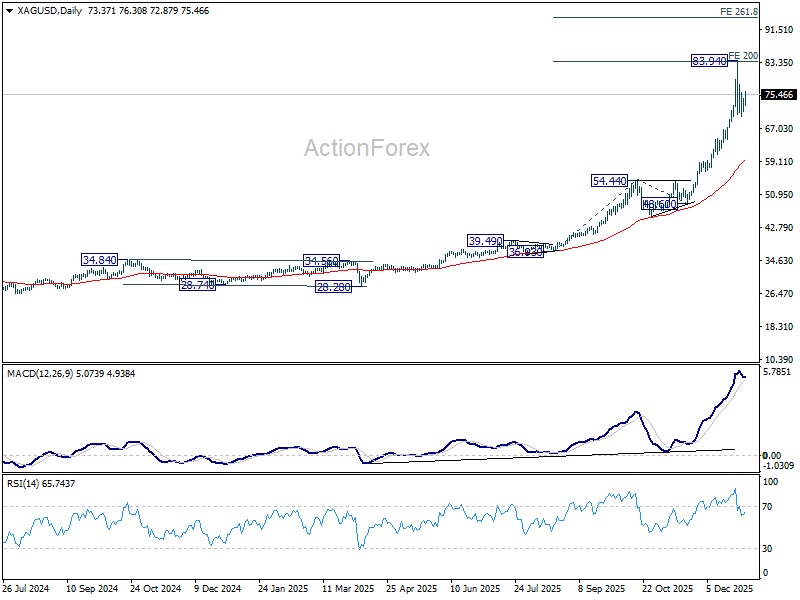
Silver continues to display relative strength versus Gold. Support has been confirmed near 38.2% retracement of 48.60 to 83.94 at 70.44. The price action since remains viewed as a sideways consolidation, expected to remain bounded within the 70–84 range.
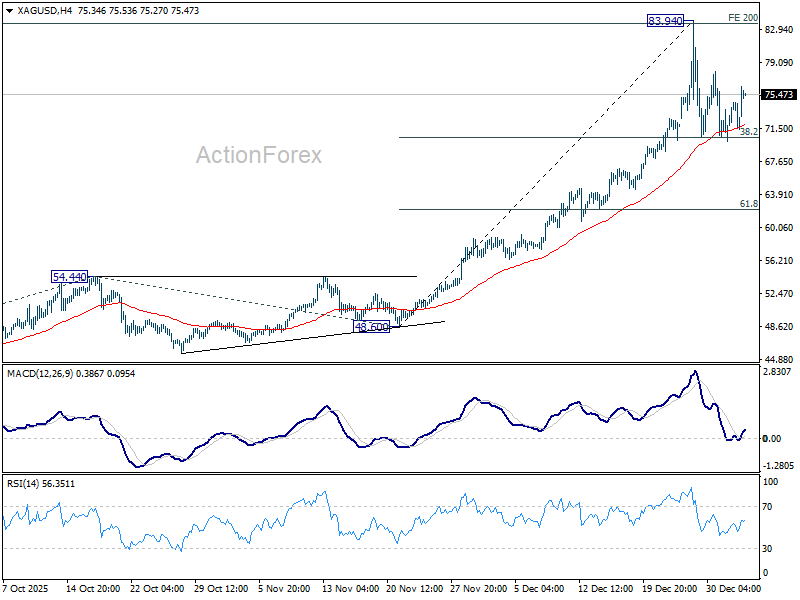
On resumption, the next major upside target for Silver sits at 261.8% projection of 36.93 to 54.44 from 48.50 at 94.43. Though, that level may be adjusted depending on the depth and duration of the current consolidation.
BoJ’s Ueda sees durable wage-price cycle, signals scope for further hikes
BoJ Governor Kazuo Ueda reaffirmed the tightening bias today, adding wages and prices are “highly likely to rise together moderately.” In a speech he said adjusting the degree of monetary support would help place the economy on a path toward sustained growth.
Ueda added that the central bank will continue to raise interest rates if economic activity and inflation evolve in line with its forecasts. Also, Japan’s economy maintained a moderate recovery last year despite pressure on corporate profits from higher U.S. tariffs.
Speaking at the same banking event, Finance Minister Satsuki Katayama said Japan is at a critical stage of shifting toward a growth-driven economy after decades of deflation.
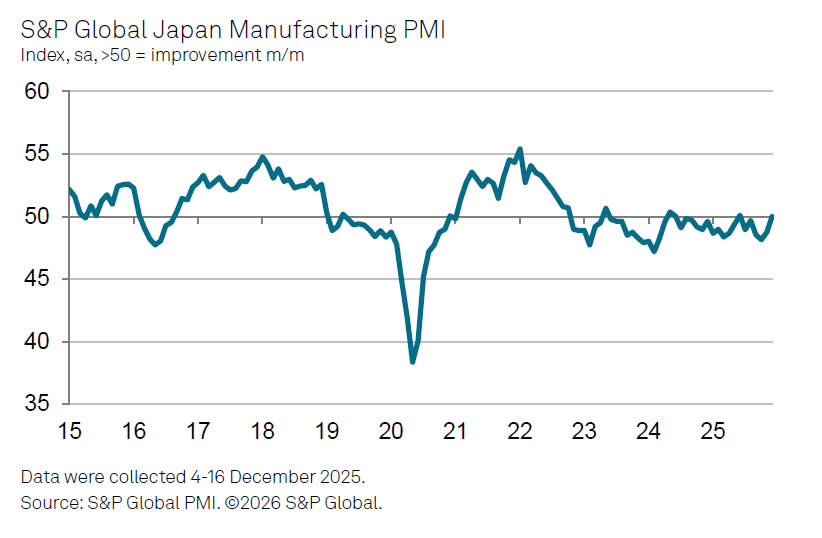
Japan PMI manufacturing stabilizes at 50.0, weak Yen lifts inflation risks
Japan’s Manufacturing PMI was finalized at 50.0 in December, rising from 48.7 in November and ending a five-month stretch of contraction. The reading points to stabilization rather than renewed expansion, but marks a clear improvement in underlying momentum as 2025 drew to a close.
According to Annabel Fiddes, Economics Associate Director at S&P Global Market Intelligence, factories reported a much softer decline in sales alongside broadly steady production levels. Employment also provided a modest positive signal, with staffing levels rising at a slightly faster pace as firms positioned for firmer demand in the months ahead.
That said, confidence remains fragile. Respondents continued to flag headwinds from sluggish global conditions, Japan’s ageing population, and rising cost pressures. Input prices climbed at the fastest pace since April, driven by higher raw material and labor costs as well as a weak Yen, prompting firms to lift output prices to protect margins.
China's private PMI services falls to 52.0, constraints persist into 2026
China’s RatingDog PMI Services edged down from 52.1 to 52.0 in December, marking the lowest level in six months and extending the slowdown in growth momentum for a fourth consecutive month.
According to Yao Yu, founder of RatingDog, the sector ended the year with a “modest growth, high expectations” profile. Survey responses showed an improvement in business confidence, offering some "psychological support" for the 2026 outlook.
However, structural headwinds remain evident. Employment continued to contract, while volatile external demand weighed on new business. Both will remain "key constraints facing the sector."
From Fed gridlock to RBA hawkishness, US NFP and AU CPI to drive early-year volatility
The policy divide that shaped the Fed's debate through the second half of 2025 is set to define early-2026 trading as well. Persistent tension between maximum employment and price stability has left the FOMC deeply split. That tension is expected to continue.
This week’s U.S. data may help narrow the fault lines, but expectations are modest. ISM Manufacturing and ISM Services provide useful color on activity, yet the December non-farm payroll report stands as the decisive macro event of the first full trading week of the year.
Crucially, the end of the government shutdown in November means labor data should return to normal reporting standards. For Fed officials, the key question is whether employment remains strong enough to tolerate prolonged restraint, or whether cooling argues for further easing in 2026.
That judgment directly feeds into rate expectations. The prevailing base case remains just one 25bp cut this year. Yet, pricing reflects a near coin-toss between delivery in Q1 or Q2, with policymakers wary of acting too early against still-sticky inflation dynamics. While no single data point will decide the outcome, December payrolls could set the tone for January trading.
Staying in North America, Canadian labour market data is another focus for the week ahead. After a run of firmer-than-expected prints through the autumn, December employment is expected to show some pullback . Even so, the data should remain broadly consistent with early signs of stabilization.
Beneath the surface, however, heavily trade-exposed sectors continue to lag broader employment trends. Yet, there is little evidence that this weakness is spreading across the wider Canadian economy. Thus, December’s report is unlikely to materially shift the near-term outlook for the BoC. A prolong hold is expected until the next move as a hike, but unlikely to be before 2027.
Outside the North America, Australia stands out as a potential volatility source. CPI data this week lands just after a notably hawkish shift by the RBA, which has reopened debate over whether policy may tighten again rather than continue easing.
Speculation has grown that the RBA could deliver a rate hike as early as February if price pressures fail to cool. Commonwealth Bank of Australia now expects one increase next year to 3.85%, warning of risk toward a larger hiking cycle should growth prove more resilient and inflation more persistent.
That view is echoed by National Australia Bank, whose chief economist Sally Auld forecasts two hikes — in February and May — taking the terminal rate to 4.10%. Much hinges on whether inflation momentum convincingly slows, or instead forces policymakers to reassert control.
Elsewhere, CPI data from the Eurozone, Switzerland and China will be monitored but is unlikely to shift policy expectations materially. ECB remains firmly on hold at 2.00% deposit rate, with next move seen as a hike but timing still distant. The SNB continues to see little deflation risk, keeping rates at 0.00% with a high bar for returning to negative territory. In China, CPI surged to a 21-month high in November, but doubts persist over sustainability, particularly as Yuan strength in late-2025 acts as a disinflationary force.
- Monday: China RatingDog PMI services; Swiss retail sales, PMI manufacturing; US ISM manufacturing.
- Tuesday: Germany CPI flash; Eurozone PMI services final, UK PMI services final.
- Wednesday: Australia CPI; Germany retail sales, unemployment; Swiss foreign currency reserves; UK PMI construction; Eurozone CPI flash; US ADP employment, ISM services.
- Thursday: Japan labor cash earnings; Australia trade balance; Germany factory orders; Swiss CPI; Eurozone PPI; Canada trade balance; US jobless claims, trade balance.
- Friday: Japan household spending; China PPI, CPI; Germany industrial production; Swiss unemployment rate; Eurozone retail sales; Canada employment; US non-farm payroll, U of Michigan consumer sentiment.
EUR/USD Daily Outlook
Daily Pivots: (S1) 1.1701; (P) 1.1733; (R1) 1.1753; More….
EUR/USD's fall from 1.1807 accelerated lower today and the break of 1.1702 support suggests that rise from 1.1467 could have completed with three waves up to 1.1807. The development argues that fall from 1.1807 is the third leg of the whole pattern from 1.1917 high. Intraday bias is back on the downside. Sustained trading below 55 D EMA (now at 1.1670) will affirm this case and target 1.1467 support and below. For now, risk will stay on the downside as long as 1.1807 resistance holds, in case of recovery.
In the bigger picture, as long as 55 W EMA (now at 1.1408) holds, up trend from 0.9534 (2022 low) is still in favor to continue. Decisive break of 1.2 key psychological level will carry larger bullish implication. However, sustained trading below 55 W EMA will argue that rise from 0.9534 has completed as a three wave corrective bounce, and keep long term outlook bearish.
Gold and Silver bounce on Venezuela shock, bull trends intact
Safe-haven demand is flowing back into precious metals, with Gold and Silver posting notable rebounds at the start of the week. Price action in both metals remains corrective following recent record highs. The resilience reinforces the view that larger uptrends remain intact for new record highs later in Q1.
The trigger for the renewed haven bid was news that the US captured Venezuelan President Nicolás Maduro over the weekend. Saturday’s operation marked Washington’s most controversial intervention in the region since the invasion of Panama nearly four decades ago. The symbolism of the move have unsettled regional stability assumptions, pushing investors back toward assets perceived as protection against geopolitical shocks.
Technically, Gold’s recent pullback from 4549.90 was slightly deeper than expected, nearly reaching 50% retracement of 3,997.73 to 4,549.90 at 4,273.81. Still, price has remained well supported above 55 D EMA (now at 4,172.34), keeping the long-term uptrend intact.
Once the current consolidation phase completes, the longer-term bullish trend is expected to reassert itself. Decisive break above 4,549.90 would open the way toward 61.8% projection of 3,267.90 to 4,381.22 from 3,997.73 at 4,685.76. However, bearish divergence on D MACD suggests strong resistance could emerge near that zone, capping upside on the first attempt.
Silver continues to display relative strength versus Gold. Support has been confirmed near 38.2% retracement of 48.60 to 83.94 at 70.44. The price action since remains viewed as a sideways consolidation, expected to remain bounded within the 70–84 range.
On resumption, the next major upside target for Silver sits at 261.8% projection of 36.93 to 54.44 from 48.50 at 94.43. Though, that level may be adjusted depending on the depth and duration of the current consolidation.
China’s private PMI services falls to 52.0, constraints persist into 2026
China’s RatingDog PMI Services edged down from 52.1 to 52.0 in December, marking the lowest level in six months and extending the slowdown in growth momentum for a fourth consecutive month.
According to Yao Yu, founder of RatingDog, the sector ended the year with a “modest growth, high expectations” profile. Survey responses showed an improvement in business confidence, offering some "psychological support" for the 2026 outlook.
However, structural headwinds remain evident. Employment continued to contract, while volatile external demand weighed on new business. Both will remain "key constraints facing the sector."
BoJ’s Ueda sees durable wage-price cycle, signals scope for further hikes
BoJ Governor Kazuo Ueda reaffirmed the tightening bias today, adding wages and prices are “highly likely to rise together moderately.” In a speech he said adjusting the degree of monetary support would help place the economy on a path toward sustained growth.
Ueda added that the central bank will continue to raise interest rates if economic activity and inflation evolve in line with its forecasts. Also, Japan’s economy maintained a moderate recovery last year despite pressure on corporate profits from higher U.S. tariffs.
Speaking at the same banking event, Finance Minister Satsuki Katayama said Japan is at a critical stage of shifting toward a growth-driven economy after decades of deflation.
Japan PMI manufacturing stabilizes at 50.0, weak Yen lifts inflation risks
Japan’s Manufacturing PMI was finalized at 50.0 in December, rising from 48.7 in November and ending a five-month stretch of contraction. The reading points to stabilization rather than renewed expansion, but marks a clear improvement in underlying momentum as 2025 drew to a close.
According to Annabel Fiddes, Economics Associate Director at S&P Global Market Intelligence, factories reported a much softer decline in sales alongside broadly steady production levels. Employment also provided a modest positive signal, with staffing levels rising at a slightly faster pace as firms positioned for firmer demand in the months ahead.
That said, confidence remains fragile. Respondents continued to flag headwinds from sluggish global conditions, Japan’s ageing population, and rising cost pressures. Input prices climbed at the fastest pace since April, driven by higher raw material and labor costs as well as a weak Yen, prompting firms to lift output prices to protect margins.
Markets Barely Flinch at Venezuelan News
Phew, the year started fast, giving us a rapid heads up that we might be heading into another geopolitically tense year.
The US entered Venezuela and took Maduro out on Saturday. From a market perspective, what happened last Saturday in Venezuela means higher volatility in oil prices, risk premia creeping back into asset prices and markets being forced to react to political shockwaves as soon as many investors return to their desks. But overall feeling is way more relaxed than that.
In oil, Brent crude opened the week above $61/bbl, while US crude tested $58/bbl offers before gains were quickly given back. Venezuela is known to have the largest oil reserves in the world — more than 300 bn barrels, even more than Saudi Arabia (around 267 bn barrels according to a chart published by Al Jazeera) — but its oil exports are far below major exporters like Saudi Arabia ($181 bn), the US ($125 bn) and Russia ($122 bn). In 2023, Venezuela exported just $4.5 bn worth of crude — a very little fraction of Saudi Arabia’s $181 bn — due to aging refinery infrastructure, years of underinvestment, technical challenges and of course, sanctions.
As a result, Venezuela pumps around 800K barrels per day — a third of what it used to a decade ago, and less than 1% of global supplies. In terms of supply risk, that’s almost negligible, especially considering that the crude market is well supplied: the IEA projects a record oil surplus this year, while Trafigura warns of a potential “super glut.” This explains why a potential supply shock in Venezuela is unlikely to reverse the bearish trend — particularly since the US did not touch any oil facilities during last weekend’s operations and sanctions on Venezuelan oil remain in place.
Looking further ahead, if sanctions are lifted and production recovers, output could rise — but only by about 150K barrels per day, according to consultants at Kypler — and it would take years, and massive investment, to bring Venezuela’s oil production back to pre-crisis levels of above 2 mbpd.
Trump has said they will rebuild Venezuela, and they certainly will. For context, Iraq was producing around 2.5 mbpd just before the US-led invasion in early 2003. After the invasion, production and exports initially slumped due to conflict and infrastructure damage, but by the 2010s export levels had climbed back to around 2–2.5 mbpd. Last year, Iraq was exporting even more — around 3.3–3.6 mbpd on average, depending on OPEC quotas and pipeline flows.
So, the long-term impact of US strategy could suggest higher supply and lower energy prices — just as Trump would like! This is certainly why we see oil bears jumping in rapidly to choke off the rally.
Unsurprisingly, safe-haven assets — led by gold — are enjoying a positive ride this morning. The yellow metal, which traded at a fresh record above $4’500 by the end of December but closed the year with a sharp decline below $4’400, is back above that level this Monday. Silver is up more than 3.6% at the time of writing, while the Swiss franc is softer against a broadly bid US dollar, and there is no particular sign of stress or lack of appetite across risk assets.
A quick word on US 10-year bonds: we weren’t sure whether the Venezuela news would boost haven demand or fuel concerns that higher US military spending could increase fiscal pressures. Judging by the initial market reaction, US 10-year yields are holding steady — likely because investors are not feeling particularly stressed about Venezuela.
One interesting place to watch in this Venezuela story is Bitcoin. The coin has been rising since news of US intervention broke, as some estimates suggest Venezuela is sitting on a large shadow reserve of more than 600K coins.
How did they accumulate so much Bitcoin? Several reports and intelligence-focused write-ups claim Venezuela may have converted gold from the Orinoco Mining Arc into Bitcoin when prices were low (around ~$5K) to build a “shadow reserve” and evade sanctions. Other reports suggest they accepted USDT in exchange for oil sales and converted those stablecoins into Bitcoin to avoid potential freezes. Consequently, they are thought to be sitting on 600K Bitcoins worth more than $55 bn at today’s price — which could affect supply if these assets are seized by the US Department of Justice due to narco-terrorism charges or held in strategic reserves.
Anyway, what a first Monday of the year!
Today, eyes will be on Nvidia and AMD CEOs speaking at the CES conference, and later this week, investors will closely watch the US jobs report for insights on Federal Reserve (Fed) expectations and potential market implications.
For now, last week was bullish for tech stocks, even though the S&P500 and Nasdaq kicked off the year on a weak note. Let’s see if Jensen Huang can do something about it.
Market Sentiment Steady Despite US Raid to Venezuela
In focus today
In the US, the December ISM Manufacturing index is due for release today. The PMI released earlier indicated a slowdown in growth momentum towards the end of 2025.
In the euro area, the Sentix indicator is released today and will show the first estimate of investor confidence in 2026. Confidence was higher in 2025 compared to 2024 but ended the year on a downward trend.
The rest of the week will feature several notable data releases. On Wednesday, we expect euro area HICP inflation for December to decline to 2.0% y/y from 2.1% in November. In the US, Wednesday will also bring the December ISM Services index, the ADP private sector employment report for December, and the November JOLTs report. Later in the week, the key highlight will be the US Jobs Report for December, set for release on Friday.
Economic and market news
What happened over the weekend
In geopolitics, the US conducted a controversial raid to capture Venezuelan President Nicolas Maduro on Saturday, who is now detained in New York and faces drug trafficking charges in court today. For now, the rest of Maduro's government remains in power, with Vice President Delcy Rodriguez taking over as an interim leader. Rodriguez has opposed Trump's calls to work with the US, but Trump has threatened she would 'pay a very big price if she doesn't do what's right'. Secretary of State Marco Rubio has also said Venezuela's next leader 'should be aligned with US interests', though the exact claims of the US administration remain unclear. While many Western nations support the removal of Maduro, international criticism has emerged regarding the legality of the raid.
Trump also announced plans for major US oil companies to return to Venezuela and refurbish its degraded oil infrastructure. Currently, Chevron is the only US oil major operating in the country. While the US intervention in Venezuela caught markets off guard, we doubt the near-term implications for the oil market will be significant. Oil prices have remained relatively steady in early Monday trading, while broad USD has strengthened. Venezuela's crude export is small and regardless; there are no indications of any disruptions to production or sales. The potential long-term effects could be more profound, but clouded with uncertainty. Venezuela holds a substantial untapped oil reserve, but its production is far from pre-sanctions highs. It will likely take large-scale investments and several years to reap these gains. In addition, Venezuela is a founding member of OPEC, i.e. a production rise would have to be coordinated with the policy of the group. Finally, Venezuela would need to find buyers for its heavy crude.
OPEC+ held a brief meeting on Sunday and reaffirmed their November decision to maintain oil output levels through March. According to one OPEC+ delegate, the meeting did not address the US capture of Venezuelan President Maduro. This comes amid political turmoil within the group, including tensions between Saudi Arabia and the UAE over the Yemen conflict.
In China, the RatingDog Services PMI was released overnight, and edged down to 52.0 in December from 52.1 in November, marking the weakest expansion in six months. New business growth softened, while foreign demand declined, particularly due to lower tourist numbers. Input costs rose for the tenth consecutive month, driven by higher raw material and labour costs, while firms reduced selling prices amid intensifying competition. Business sentiment improved to a nine-month high, supported by expectations of stronger market conditions and expansion plans for 2026, though structural challenges such as shrinking employment and deflationary pressures remain key constraints.
Most final manufacturing PMIs were released already on Friday. In the US, the index eased to 51.8 in December from 52.2 in November, marking the slowest expansion in five months as new orders declined and exports fell further. In the euro area, final manufacturing PMI dropped to 48.8 from 49.6, with output and new orders contracting, particularly in Germany, Italy and Spain. Despite weaker sales and higher input costs, firms signalled their strongest optimism for the year ahead since early 2022.
In Asia, manufacturing activity continues to recover with PMIs for several East Asian economies rising above the neutral level of 50 in December. Taiwan, South Korea and the Philippines saw particularly strong new orders, suggesting improving demand across the region. The recovery follows a continued rise in industrial metal prices, along with a decent rebound in China's NBS manufacturing PMI, released last week. While trade war-related disruptions impacted Asian manufacturing and exports in 2025, demand now appears to be recovering broadly.
In Sweden, manufacturing PMI rose to 55.3 in December from 54.7 in November, marking six consecutive months above the long-term average. The increase was driven by stronger production and new orders, supported by both export and domestic demand, while supplier delivery times lengthened due to solid activity rather than supply-chain stress.
Equities: Equities started the year on a positive footing, broadly confirming the regime we saw into the end of 2025. Headline indices moved higher, but cyclicals underperformed defensives, driven almost entirely by weakness in the US and in particular US consumer cyclicals. Industrials stood out as the best-performing sector on the first trading day of the year.
VIX was lower on Friday, min vol stocks underperforming, and small caps were outperforming large caps. In short, market tone remains firmly risk-on despite the consumer cyclicals struggling in the US.
What is notable, however, is the continued underperformance of the US. US large caps, and especially large-cap tech, have lagged meaningfully in the risk-on markets late 2025, and this pattern is also visible in today's futures. Risk appetite is there, but it is increasingly expressed outside US mega-cap tech.
Asian markets are strong this morning, not only in Japan but also in South Korea and Taiwan, supported by solid PMI prints late last week. AI-related themes are once again gaining traction in the region, with South Korea up around 3.5% and Taiwan up roughly 2.5% today - a move not mirrored to the same extent in US futures.
US futures are higher this morning, but European futures are even stronger, despite Europe having already outperformed the US into year-end and on the first trading day of the year.
FI and FX: The FX market was relatively steady on the first trading day of 2026. Scandies gained a little vis-à-vis both the EUR and the USD with EUR/NOK slipping below 11.80 and EUR/SEK holding close to 10.80. EUR/USD stayed above 1.17 to start the year. Oil prices were low and steady on Friday ahead of the events over the weekend in Venezuela. The 10Y US yield rose to the highest since before Christmas dragging its 10Y German counterpart up, and equity markets opened the year on a high note.