Sample Category Title
FTSE 100 Breaches 10,000 Mark, Gold Rises 1.8% as UK House Prices Drop to 20-Month Lows
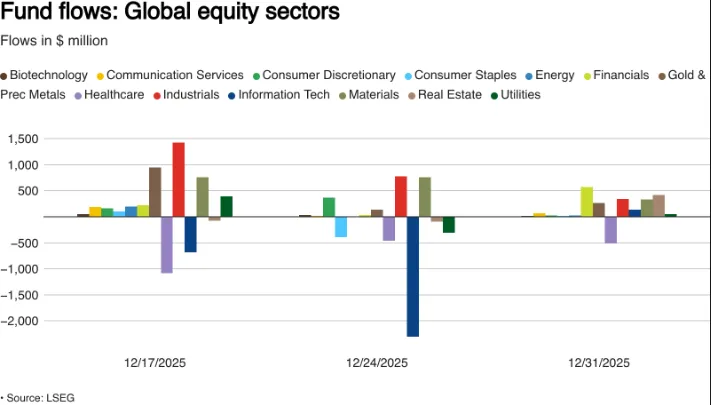
Global Equity Funds Saw Strong Flows in Final Week of 2025
Global stock funds attracted $26.54 billion in new investments this week, continuing a strong buying trend following a massive $37 billion inflow the previous week.
This enthusiasm comes after the global market gained nearly 21% in 2025, its best performance since 2019.
American stock funds led the way, taking in roughly $17 billion, while European and Asian funds also saw healthy gains of $5.75 billion and $2.67 billion, respectively.
When picking specific industries, investors favored finance, real estate, and industrial companies, but they continued to pull money out of the healthcare sector, which lost $510 million.
Source: LSEG
Asia Market Wrap - Samsung Hits New Record High
Stock markets kicked off the new year the same way they ended 2025, with Artificial Intelligence (AI) and computer chip companies leading the charge.
Asian markets rose by 0.9% overall, with the technology sector reaching a new all-time high. Major success stories included Samsung, which hit a record share price, and Baidu, which jumped 7.5% after announcing plans to list its chip business on the stock market.
Meanwhile, AI chip designer Shanghai Biren saw its value quadruple on its first day of trading. South Korea’s market, last year’s top performer, climbed another 2.3% to a record high, powered by huge gains in Samsung and SK Hynix.
Similarly, Taiwan’s market reached a new peak, continuing the strong tech-driven rally that saw it gain 27% last year.
The MSCI index of emerging Asian equities jumped as much as 2% to its highest point since late October.
Stock markets kicked off the new year the same way they ended 2025, with Artificial Intelligence (AI) and computer chip companies leading the charge.
Asian markets rose by 0.9% overall, with the technology sector reaching a new all-time high. Major success stories included Samsung, which hit a record share price, and Baidu, which jumped 7.5% after announcing plans to list its chip business on the stock market.
Meanwhile, AI chip designer Shanghai Biren saw its value quadruple on its first day of trading. South Korea’s market, last year’s top performer, climbed another 2.3% to a record high, powered by huge gains in Samsung and SK Hynix.
Similarly, Taiwan’s market reached a new peak, continuing the strong tech-driven rally that saw it gain 27% last year.
The MSCI index of emerging Asian equities jumped as much as 2% to its highest point since late October.
UK House Prices at 20-Month Lows
UK house price growth slowed significantly in December, rising just 0.6% compared to a year ago, the weakest annual increase since April 2024 and well below what experts predicted.
MoM, prices unexpectedly fell by 0.4%, marking the first drop in four months. Nationwide's Chief Economist explained that this slowdown is partly due to comparisons with strong price gains from the previous year.
However, he noted that the housing market remains stable, with mortgage approvals sitting at pre-pandemic levels. He also highlighted that homes are becoming more affordable as wages rise faster than property prices and mortgage rates continue to fall.
Looking ahead, house prices are expected to recover slightly, with growth forecast between 2% and 4% in 2026.
European Session - FTSE 100 Hits 10000 for the First Time
London's main stock index, the FTSE 100, hit a historic milestone on Friday by crossing the 10,000-point mark for the first time.
This achievement follows a strong performance in 2025, where the index rose nearly 22%, its best year since 2009 beating major markets in Europe and the US.
While global markets have been largely driven by excitement over Artificial Intelligence, the UK's rally was powered by different sectors: mining companies benefited from high metal prices, defense firms grew due to increased military spending, and banks profited from high interest rates.
The large international companies in the FTSE 100 significantly outperformed smaller, domestic UK businesses.
Although the UK index still grew slower than markets in Japan and Italy, reaching this new record offers hope for renewed investor confidence after years of uncertainty surrounding Brexit and political instability.
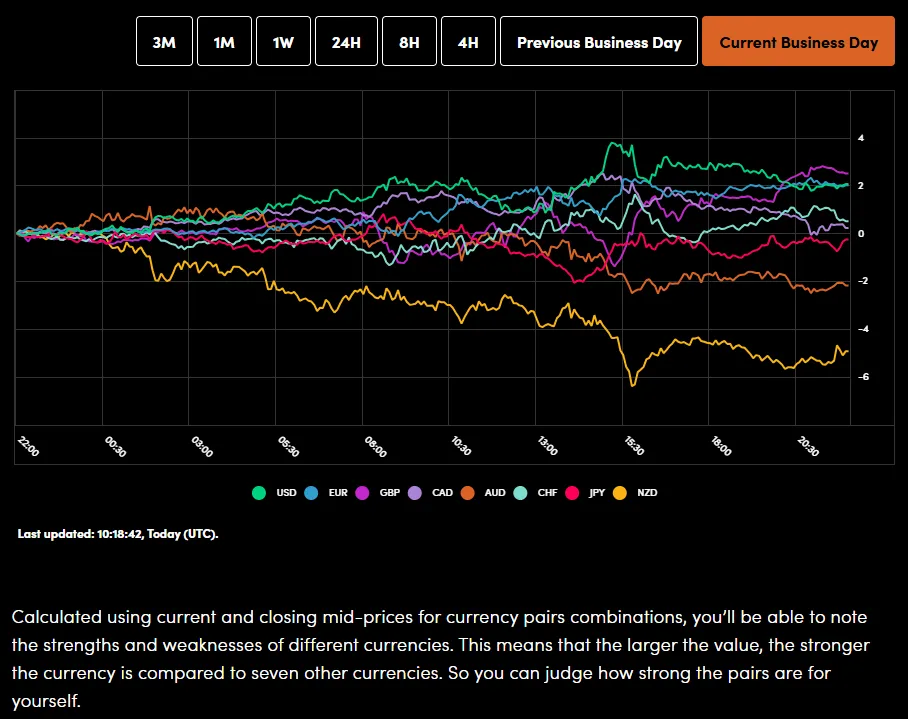
On the FX front, the US dollar started 2026 with a small recovery, rising 0.2% on Friday after suffering its worst year in nearly a decade with a 9.4% drop in 2025. While the dollar stabilized, the Euro dipped slightly and the British Pound remained near its recent highs; both European currencies had surged last year, recording their strongest annual gains since 2017.
In the Pacific, the Australian and New Zealand dollars continued their winning streaks, starting the new year with further gains after strong performances in 2025.
Overall trading was quiet because markets in Japan and China were closed, but investors are watching closely for upcoming US economic data to help predict future interest rate changes.
Currency Power Balance
Source: OANDA Labs
Precious metals started the New Year with a strong rally on Friday, continuing the massive success they saw in 2025. Market participants are buying these "safe-haven" assets because of ongoing political conflicts and the expectation that interest rates will fall later this year.
Gold prices rose 1.4% to around $4,372 per ounce, bouncing back after a short dip earlier in the week.
Other metals saw even bigger gains. Silver jumped 3.6% to nearly $74 per ounce, following a historic year where it gained 147%, its best performance ever.
Platinum also rose 2.5%, recovering after hitting a record high earlier in the week; it more than doubled in value last year.
Palladium climbed 2.4%, building on a 76% gain in 2025, which was its best result in 15 years.
Oil prices rose slightly on the first trading day of 2026, recovering from their biggest annual drop since 2020. This small boost was driven by supply concerns after Ukrainian drones attacked Russian oil facilities and a US blockade restricted Venezuelan exports.
Despite these tensions, the market is coming off a difficult year where prices fell more than 15% due to global oversupply.
Specifically, Brent crude climbed 22 cents to $61.07 a barrel, while U.S. crude also increased by 22 cents to reach $57.64.
Economic Calendar and Final Thoughts
The European session is quiet moving forward with a few medium impact data releases being released already in the morning.
In the US session market participants will get the US and Canadian manufacturing PMI data before attention turns to next week's US data releases which include the NFP jobs data release.
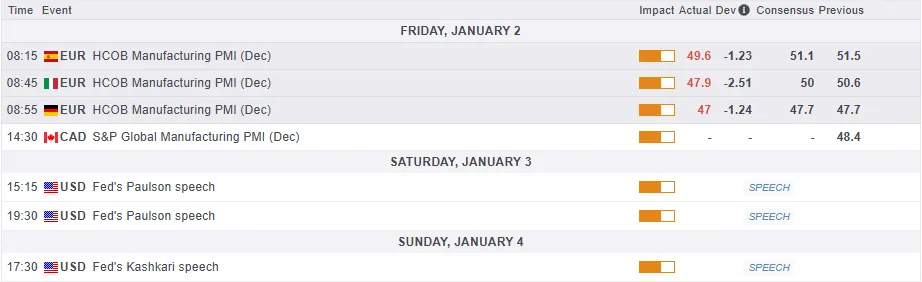
For all market-moving economic releases and events, see the MarketPulse Economic Calendar. (click to enlarge)
Chart of the Day - FTSE 100 Index
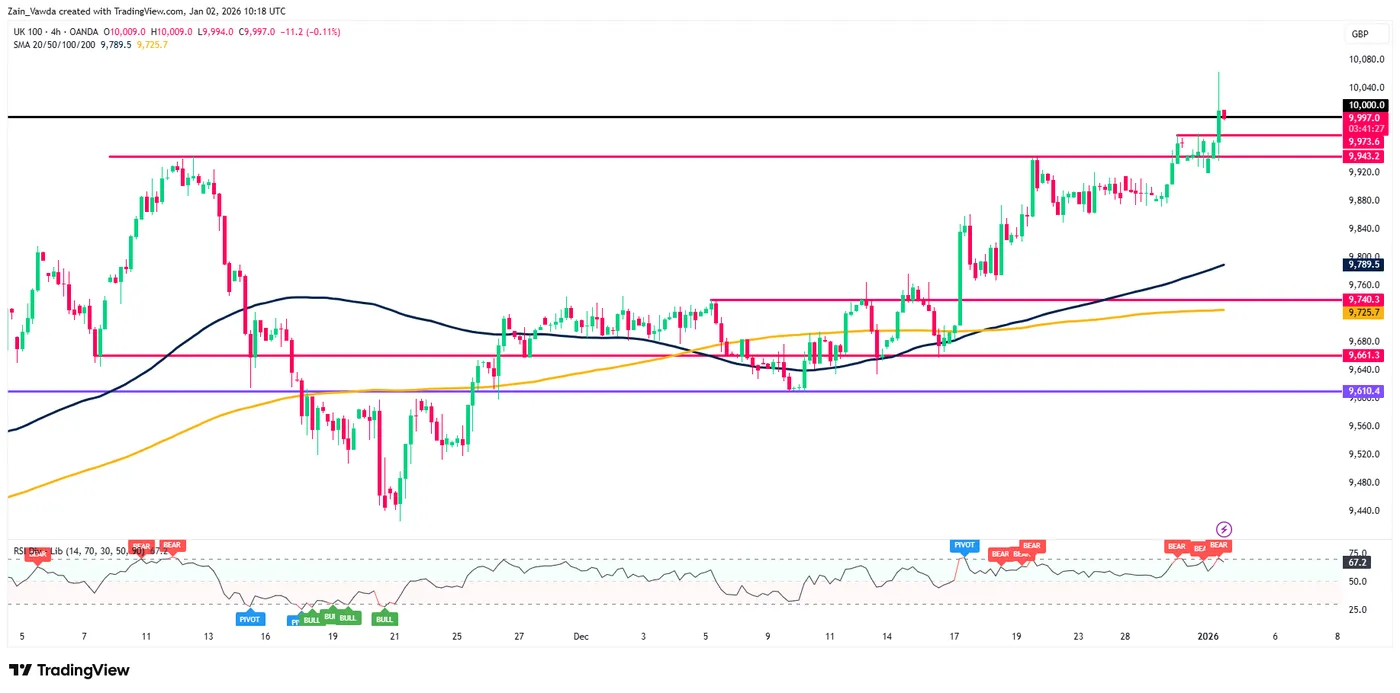
From a technical perspective, the FTSE 100 index has finally breached the psychological 10000 mark.
Price has pulled back since with bouts of volatility and that shouldn't be a surprise. When price breaches such psychological levels we do tend to see some volatile price swings.
Immediate support which may be tested in the near-term include the 9973 and 9943 handles respectively.
However, a key level on the four-hour chart for bullish continuation will be the swing low from December 30 which rests around the 9872 handle. If this handle holds, then fresh highs will likely materialize.
FTSE 100 Index Four-Hour Chart, January 2, 2026
Source: TradingView.com (click to enlarge)
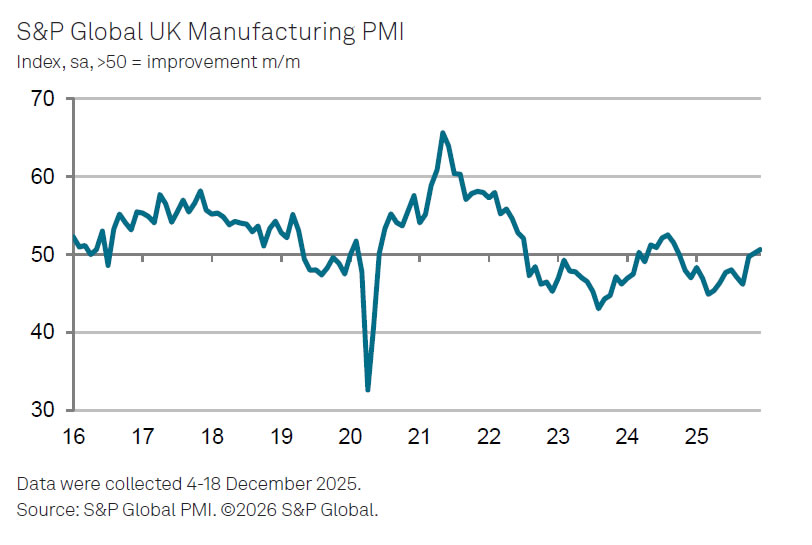
UK PMI manufacturing finalized at 50.6, BoE rate cut offers early support
UK PMI Manufacturing was finalized at 50.6 in December, up from November’s 50.2 and marking a 15-month high. The reading confirmed continued expansion, though it was revised lower from the initial estimate of 51.2, tempering the strength of the signal heading into 2026.
Data from S&P Global Market Intelligence showed output rising for the third straight month, alongside a modest improvement in new order inflows. Rob Dobson highlighted resilience in domestic demand and a meaningful step toward stabilization in export orders, even as overseas sales continue to contract on a multi-year view.
The outlook for early 2026 is less certain. Growth has relied heavily on short-term factors such as inventory accumulation, raising doubts about durability once those supports fade. December’s interest rate cut could help shift momentum toward demand-led growth, but confirmation will depend on whether manufacturers and customers respond with higher spending and investment.
Eurozone PMI manufacturing finalized at 48.8, 2026 recovery hopes rest on fiscal support
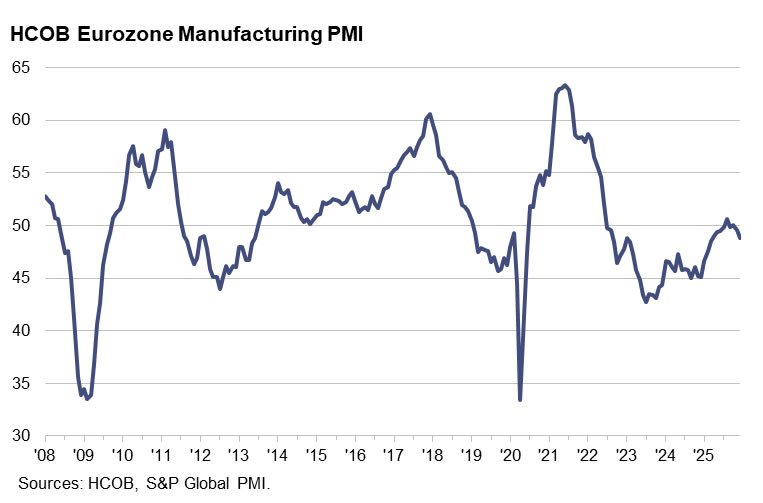
Eurozone PMI Manufacturing was finalized at 48.8 in December, down from November’s 49.6 and marking a nine-month low. Regional divergence remained pronounced. Greece (52.9) and Ireland (52.2) stayed in expansion, while the Netherlands held just above 50 at 51.1. France surprised on the upside at 50.7. However, weakness in the core was decisive, with Germany (47.0) and Italy (47.9) both sliding deeper into contraction and Spain (49.6) slipping back below the 50 threshold after a long expansion run.
According to Hamburg Commercial Bank, the manufacturing downturn has persisted almost continuously since mid-2022. Chief Economist Cyrus de la Rubia said 2025 brought some easing in the downturn but failed to generate a sustainable growth trajectory. Looking ahead, he pointed to Germany’s planned stimulus and rising defence spending across Europe as potential lifelines for 2026.
Input prices rose for a second consecutive month despite falling energy prices, driven instead by sharp gains in industrial metals and lingering supply-chain frictions. With delivery times lengthening and pricing power limited, the outlook remains challenging, leaving fiscal support as a key hope for reviving Eurozone manufacturing momentum in 2026.
Chinese Yuan strength extends Into 2026 as CFETS shift meets technical pressure
Chinese Yuan extended its advance into the opening day of 2026, climbing to its strongest level against Dollar since May 2023. Part of the rally appears to reflect a knee-jerk reaction to the basket adjustment. China’s foreign exchange trade platform said the CFETS basket will be updated in 2026 as part of its routine annual reweighting based on trade flows, lowering the relative influence of both Dollar and Euro.
Specifically, Dollar weighting will fall to 18.307% from 18.903%. Euro weighting will edge down to 17.862% from 17.902%. While both remain the two largest components, their diluted weight reduces their influence on the daily fixing process, giving the People’s Bank of China slightly more flexibility in managing Yuan stability against a broader set of trading partners.
Another notable shift was regional. Korean Won overtook Japanese Yen to become the third-heaviest currency in the basket, reflecting the growing importance of China–South Korea trade, as diplomatic relations with Japan also turned sour. Weightings for Hong Kong Dollar and Thai Baht were also increased.
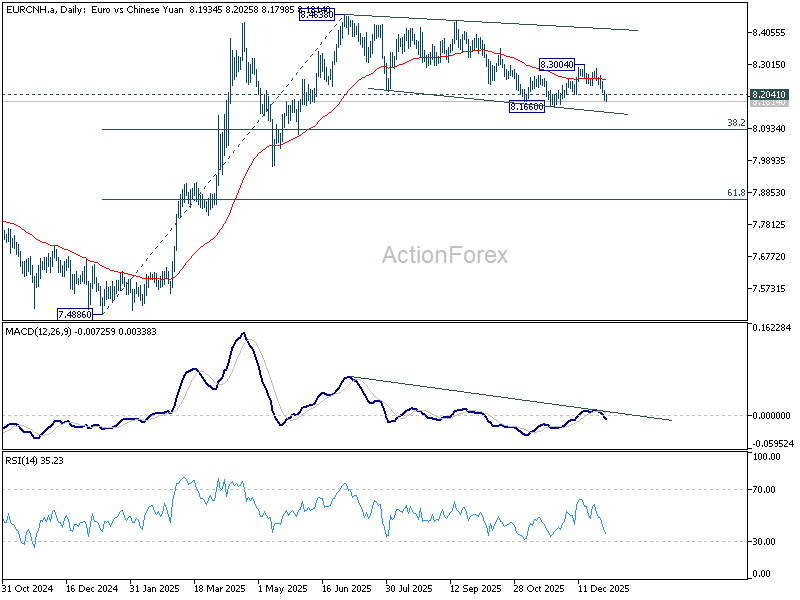
Still, price action suggests Yuan strength is confined to Dollar alone. EUR/CNH is showing renewed vulnerability, hinting that the move could be spreading beyond a mechanical basket adjustment.
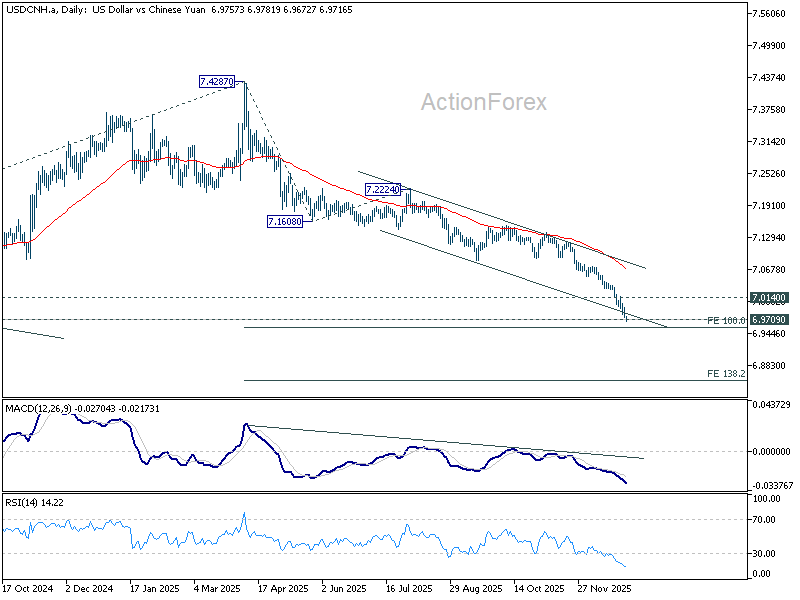
Technically, EUR/CNH’s break below 8.2040 support signals that the rebound from 8.1660 has likely completed at 8.3004. That opens the door for a deeper fall toward 8.1660, with a firm break there extending the broader downtrend from 8.4638. In this case, next target is 38.2% retracement of 7.4886 to 8.4638 at 8.0913.
USD/CNH, meanwhile, is pressing key support near the 2024 low at 6.979. The downtrend from 7.4287 remains intact, though a critical Fibonacci level lies just ahead. That level sits at the 100% projection of 7.4287 to 7.1608 from 7.2224 at 6.9545. Strong support is expected there to trigger at least a corrective rebound. Firm break above 7.0140 resistance will signal short-term bottoming and opening a move back toward 55 D EMA (now at 7.0692).
However, sustained breaks below 6.9545 in USD/CNH and 8.1660 in EUR/CNH would suggest markets are pricing in something more structural than basket mechanics—potentially a shift toward a Yuan appreciation bias in 2026. In that scenario, USD/CNH could extend toward 138.2% projection at 6.8522.
Manufacturing PMIs are in the spotlight as 2026 begins
In focus today
Over Christmas, markets have focused on geopolitical developments and the FOMC minutes released the day before New Year's Eve. Otherwise, markets have remained relatively calm ahead of the critical US and euro area figures set for release over the coming days.
For today, December manufacturing PMIs are set to be released for the US, euro area, Norway, UK and Canada. In the euro area, the flash estimate of 49.2 was released in very early December due to the holidays, so there could be a larger-than-usual revision.
Economic and market news
What happened this week
In geopolitics, US President Trump said the US has struck a facility inside Venezuela, significantly escalating the campaign against alleged drug trafficking operations. Additionally, the US struck vessels allegedly carrying drugs in international waters and imposed sanctions on four oil traders.
Following the meeting between US President Trump and Israeli President Netanyahu, Trump said that the United States would back Israeli strikes on Iran if Iran continued with its ballistic missile and nuclear weapon program. The president said he has heard Iran is "behaving badly" and is looking to restart its nuclear program, but he declined to provide additional details. Leading up to the meeting, Iranian President Pezeshkian said that Iran was in an "all-out war" with the US, Israel and Europe.
China launched large-scale military drills around Taiwan at the start of the week. Taiwanese markets reacted very calmly as the drills appear similar to what we have seen several times in the past. The drills followed a pattern of China 'retaliating' to events it deems as provocation, as they began less than two weeks after US announced USD 11.1bn arms sale to Taiwan. For the first time, China publicly stated that the goal of the drills is to serve as a warning not only to 'separatist forces' within Taiwan, but also for 'external interference forces.
In the US, the FOMC December minutes offered no big surprises and the participants' views remained divided on the outlook for interest rates. If anything, the tone was slightly dovish, given that the discussion on risks was mostly focused on the downside risks to labour markets. To quote, upside risks to inflation 'remain elevated' but downside risks to labour markets 'were elevated and had increased since mid-2025'.
Regarding the balance sheet, nothing was too striking either. The minutes emphasized flexibility for conducting reserve management purchases e.g. allowing the purchase amounts to vary depending on fluctuations of non-reserve liabilities (so around tax dates, debt ceiling debates etc.). The discussion specifically highlighted maintaining purchase amounts at elevated levels until the mid-April tax date and then cutting back thereafter as we have expected.
In the euro area, the flash estimate of December inflation in Spain was released in line with expectations at 2.9% y/y. Spain HICP inflation was at 3% y/y for December and is an early release ahead of the euro area data next week. We expect euro area HICP inflation to decline to 2.0% y/y in December from 2.1% y/y in November. Energy prices have declined since November due to the warm weather in Europe which is the main reason for the expected decline in headline inflation. We expect core inflation to remain steady at 2.4% y/y showing a similar momentum as previous months. Services inflation should remain elevated at 3.4% y/y due to the still strong wage growth.
In Sweden, the Riksbank minutes contained few surprises overall. All members agreed on holding steady the policy rate of 1.75% and the policy rate is expected to be on hold for the next quarters. Governor of the Riksbank Erik Thedéen said that he has confidence in the Riksbank's forecasts and emphasised that the Riksbank will be forward-looking this year and look through temporary declines in inflation from the VAT reduction on food. Thedéen also saw little room for a policy rate cut unless both the economy and inflation surprise on the downside.
In China, the private manufacturing PMI released in positive territory of 50.1, beating expectations of 49.8. Stronger factory activity and a modest uptick in domestic demand offset a decline in export sales. Business sentiment weakened as input cost inflation increased and employment declined.
Equities: Global equities recorded slight negative performance towards the end of the year, with the defensive sector beating the cyclicals by about 1% in the holiday season trading. The overall equity performance for 2025 ended at about 20% for MSCI world. Looking ahead, estimates for 2026 performance is concentrated in the range of 10% return (for the S&P500).
FI and FX: The EUR and the USD were outperformed by among others the Scandi currencies over the holiday season. The latter were aided by a rebound in stock prices with EUR/SEK falling to around 10.80 and EUR/NOK to around 11.80. EUR/USD hovered above 1.17. The 10Y US Treasury yield held steady with the FOMC minutes showing a committee split over what to do next. There was pressure on the US repo markets with SOFR fixing rising outside the Fed's target range before year-end. That prompted dealers to borrow USD75bn on the Fed's standing repo facility - a record amount. Oil prices were stable in the final weeks of December despite a lot of focus on geopolitics, including Russia-Ukraine peace talks.
USD/JPY Signals Upside Continuation, Bulls Stay in Control
Key Highlights
- USD/JPY started a fresh increase above the 156.50 zone.
- A bullish flag seems to be forming with resistance at 156.80 on the 4-hour chart.
- EUR/USD is consolidating gains above 1.1720.
- GBP/USD could aim for a fresh increase if it clears 1.3520.
USD/JPY Technical Analysis
The US Dollar started a fresh increase above 156.20 against the Japanese Yen. USD/JPY cleared the 156.50 resistance to enter a positive zone.
Looking at the 4-hour chart, the pair settled above the 156.50 level, the 200 simple moving average (green, 4-hour), and the 100 simple moving average (red, 4-hour). A high was formed at 156.99 and the pair is now consolidating gains.
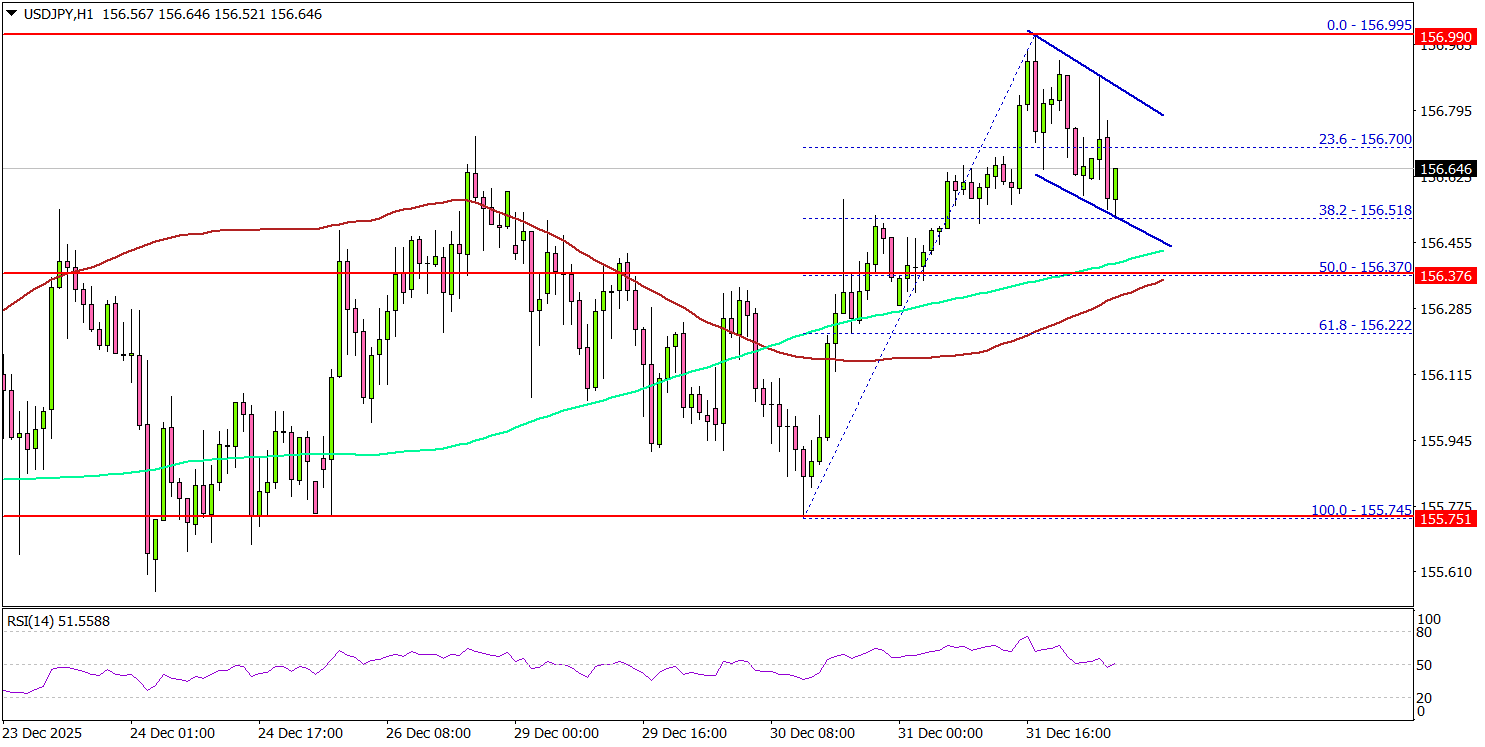
There was a minor decline below 156.70, and the 23.6% Fib retracement level of the upward move from the 155.74 swing low to the 156.99 high. However, there is a bullish flag seems to be forming with resistance at 156.80.
On the downside, there is key support at 156.35 and the 50% Fib retracement. It is also close to the 100-SMA. A downside break below the 100-SMA might spark bearish moves. The next major support could be 156.00, below which the pair might dive and test 155.50.
Immediate resistance sits near 156.70. The first key hurdle is seen near 157.00. A close above 157.00 could open the doors for a move toward 157.50. Any more gains could set the pace for a steady increase toward 158.00.
Looking at EUR/USD, the pair is consolidating gains and could aim for another increase if it manages to clear the 1.1800 resistance.
Upcoming Key Economic Events:
- Euro Zone Manufacturing PMI for Dec 2025 – Forecast 49.2, versus 49.2 previous.
- US Manufacturing PMI for Dec 2025 – Forecast 51.8, versus 51.8 previous.
EURJPY Wave Analysis
EURJPY: ⬆️ Buy
- EURJPY reversed from support area
- Likely to rise to resistance level 184.85
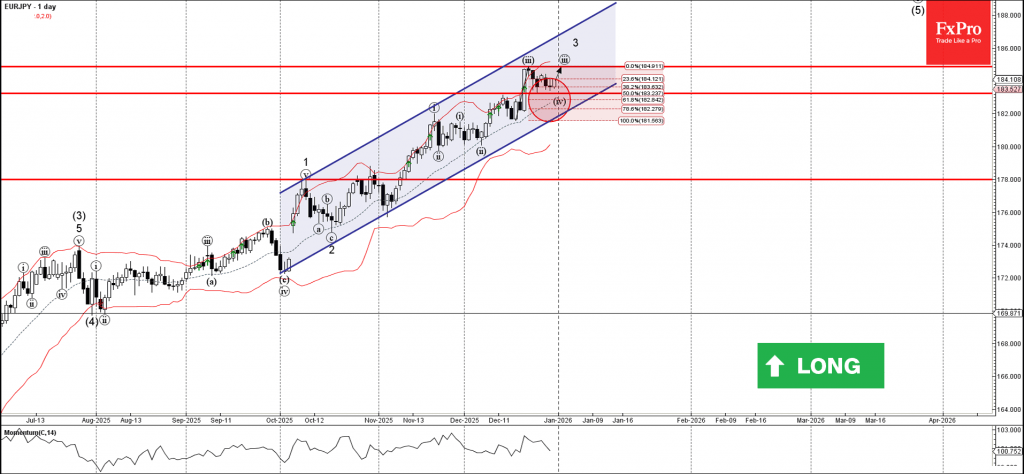
EURJPY currency pair recently reversed from the support area between the pivotal support level 183.25 (former resistance from the start of December) and the 50% Fibonacci correction of the upward impulse from December.
The upward reversal from this support zone continues the active impulse wave iii – which belongs to the higher order impulse waves 3 and (5).
Given the clear daily uptrend, EURJPY currency pair can be expected to rise to the next resistance level 184.85 (top of the previous impulse wave iii).
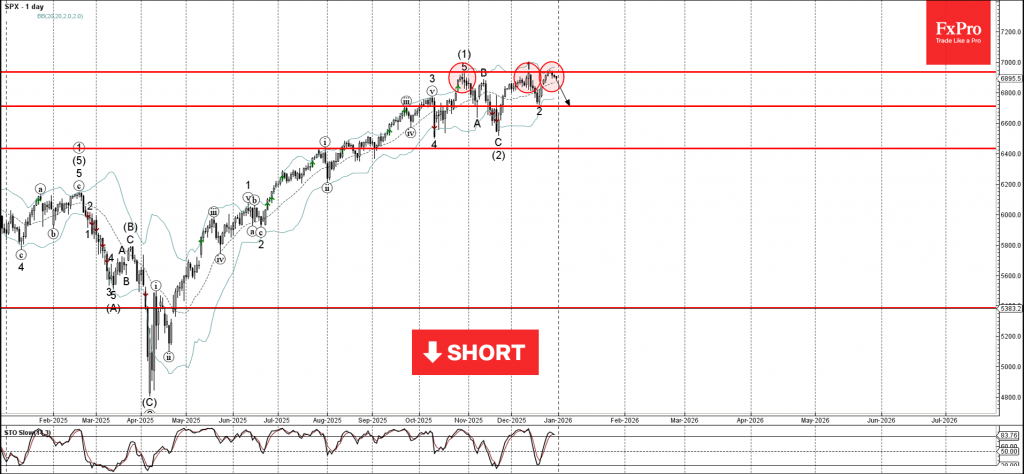
S&P 500 Wave Analysis
S&P 500: ⬇️ Sell
- S&P 500 reversed from strong resistance level 6935.00
- Likely to fall to support level 6710.00
S&P 500 index recently reversed from the resistance area between the strong resistance level 6935.00 (which has been reversing the price from the end of October) and the upper daily Bollinger Band.
The downward reversal from this resistance area stopped the previous sharp upward impulse wave 3 of the intermediate impulse wave (3) from November.
Given the strength of the resistance level 6935.00 and the overbought daily Stochastic, S&P 500 index be expected to fall to the next strong support level 6710.00 (low of the previous wave 2).