Sample Category Title
USD/JPY Daily Outlook
Daily Pivots: (S1) 113.49; (P) 113.70; (R1) 113.94; More...
USD/JPY recovered after drawing support from 4 hour 55 EMA and intraday bias is turned neutral first. On the upside, firm break of 114.69 will resume the larger up trend to 100% projection of 102.58 to 111.65 from 109.11 at 118.18 next. In case of another fall as correction extends, should be contained above 112.07 resistance turned support to bring rise resumption.
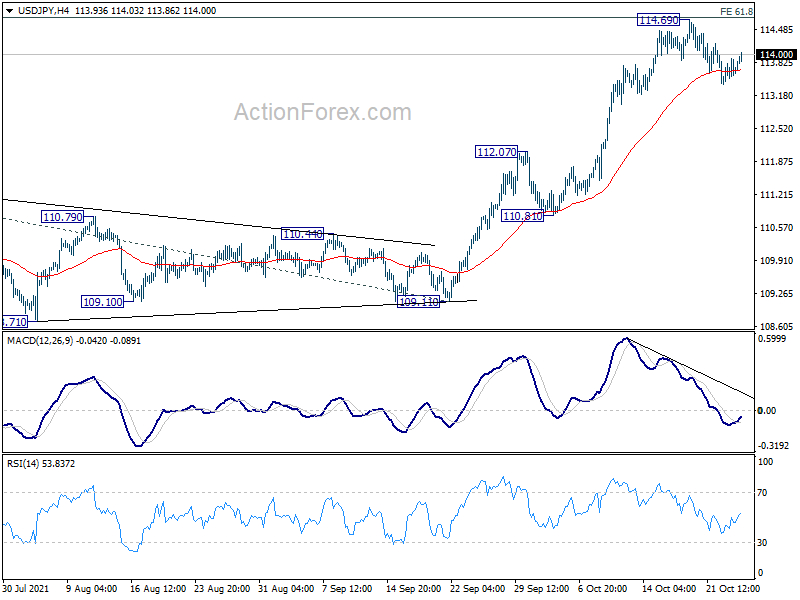
In the bigger picture, corrective decline from 118.65 (2016 high) should have completed at 101.18 already. Rise from the 102.58 is seen as the third leg of the up trend from 101.18. Next target is 114.54 resistance and then 118.65 high. This will now be the preferred case as long as 109.11 support hold, even in case of deep pull back.
USD/CAD Daily Outlook
Daily Pivots: (S1) 1.2347; (P) 1.2374; (R1) 1.2409; More...
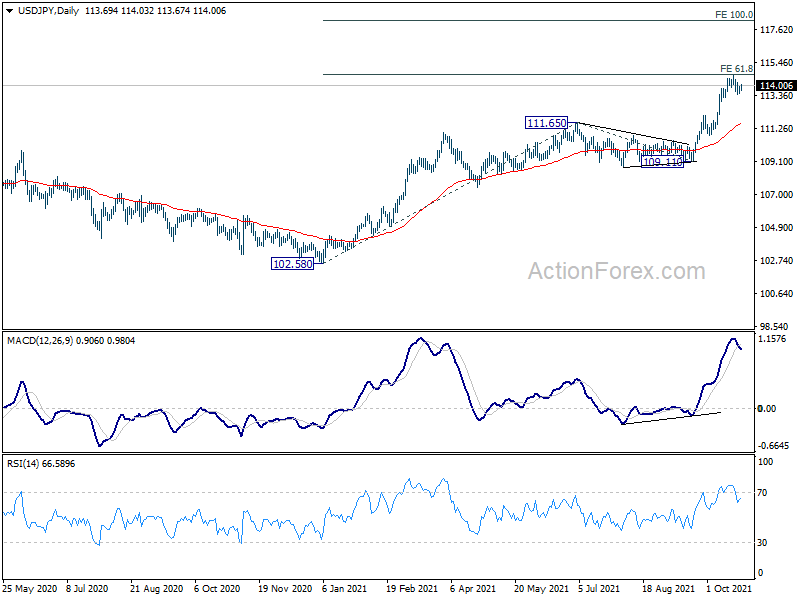
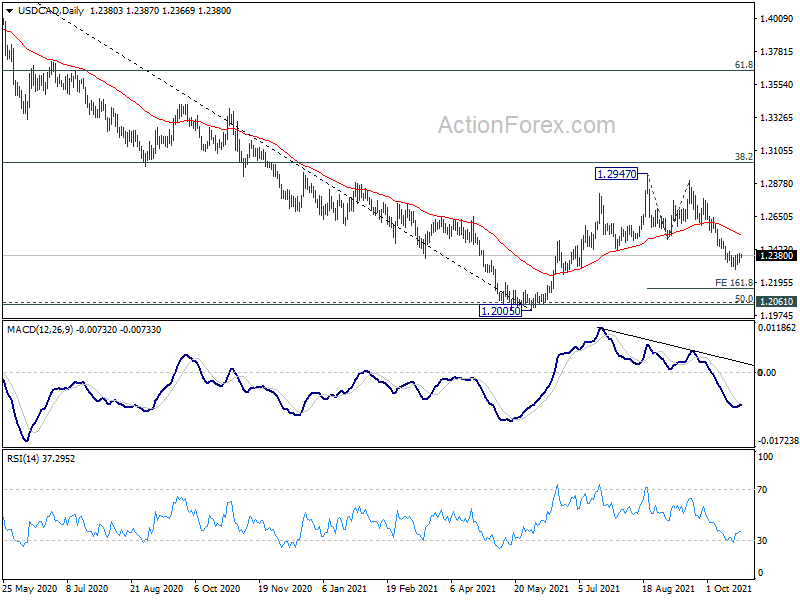
USD/CAD is staying in consolidation from 1.2286 temporary low and intraday bias remains neutral first. Upside of recovery should be limited by 1.2497 resistance to bring fall resumption. On the downside, break of 1.2286 will resume the fall from 1.2947 to 161.8% projection of 1.2947 to 1.2492 from 1.2894 at 1.2158 next.
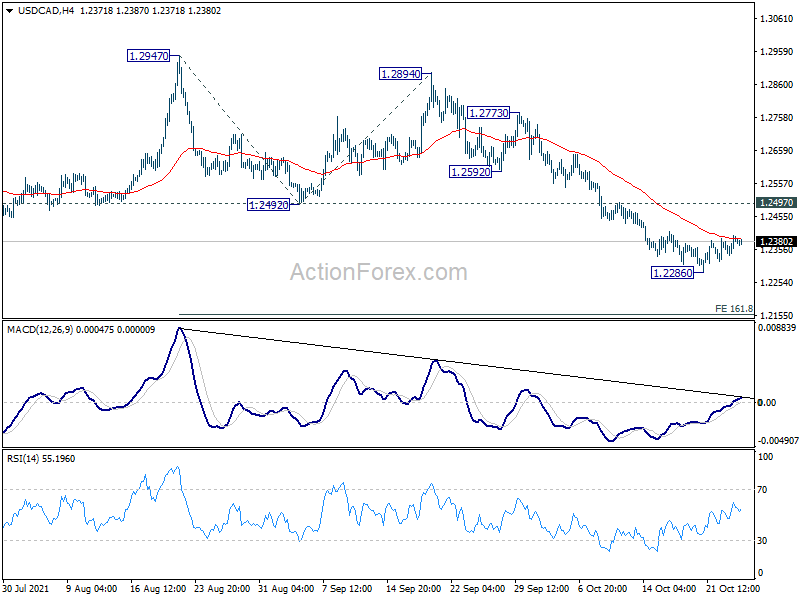
In the bigger picture, the rejection by 38.2% retracement of 1.4667 to 1.2005 at 1.3022 argues that rebound from 1.2005 is merely a corrective rise, which is complete. More importantly, the down trend from 1.4667 (2020 high) is not over yet. Sustained break of 1.2005 will extend the down trend to next long term fibonacci level at 61.8% retracement of 0.9406 to 1.4689 at 1.1424. In any case, outlook will not turn bullish as long as 1.2947 resistance holds.
Daily Technical Analysis
EUR/USD
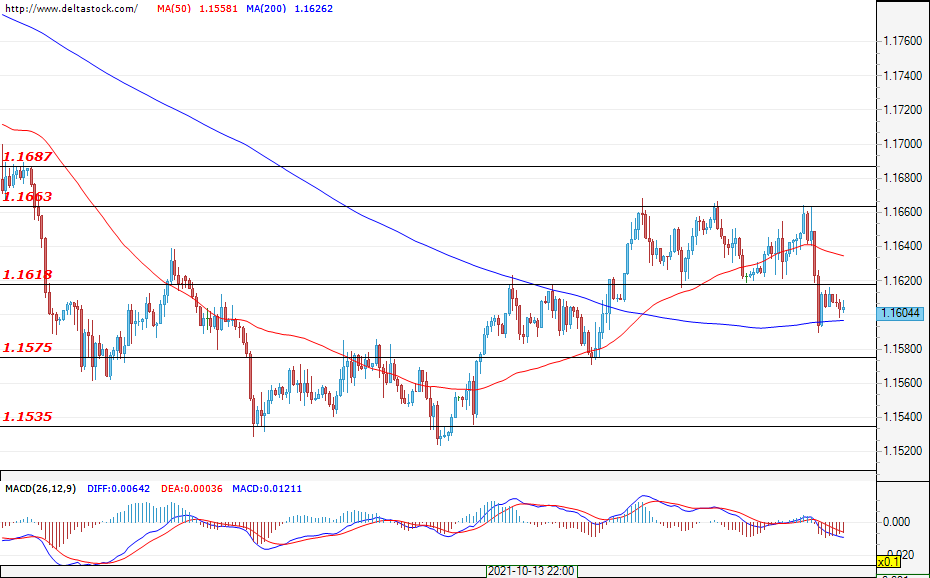
Current level - 1.1604
The bulls did not have enough strength to overcome the resistance of 1.1663, and in the past session, the pair came out of its range and breached the support of 1.1618. As long as the support of 1.1575 remains unbreached, the bulls stand a chance of continuing the upward momentum. The critical resistance for the buyers is the area between 1.1663 and 1.1687. As long as prices remain below this zone, the bears will be in control and new declines will not be ruled out. It is possible that the pair will continue to trade in the range between 1.1575 - 1.1687, at least until Thursday, when the decision on the key interest rate of the European Central Bank will be announced. For now, sentiment is mixed, and should trading to return above 1.1618, it would tip the scales in favor of the bulls. If the declines continue and the bears breach 1.1535, an attack on the 1.1410 zone can be expected. Today, increased activity may be triggered by the data on consumer confidence and sales of new homes in the United States coming out at 14:00 GMT.
| Resistance | Support | ||
| intraday | intraweek | intraday | intraweek |
| 1.1618 | 1.1687 | 1.1575 | 1.1410 |
| 1.1663 | 1.1750 | 1.1535 | 1.1280 |
USD/JPY
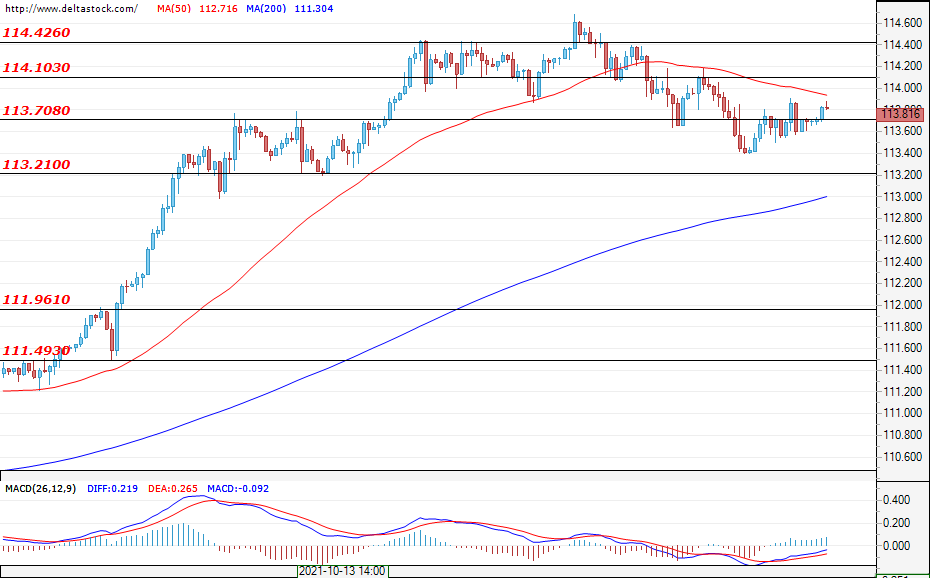
Current level - 113.81
The pullback of the currency pair continues, and during the last session, the bulls found support at 113.70. Sentiment remains positive –for the continuation of the main movement and a new test of the resistance of 114.42. Only a breach of 113.20 would disrupt the integrity of the trend and, for now, this is the main support area. The daily support for the buyers is 113.70 and the first resistance is 114.10.
| Resistance | Support | ||
| intraday | intraweek | intraday | intraweek |
| 114.10 | 116.50 | 113.70 | 111.96 |
| 114.42 | 118.00 | 113.20 | 111.50 |
GBP/USD
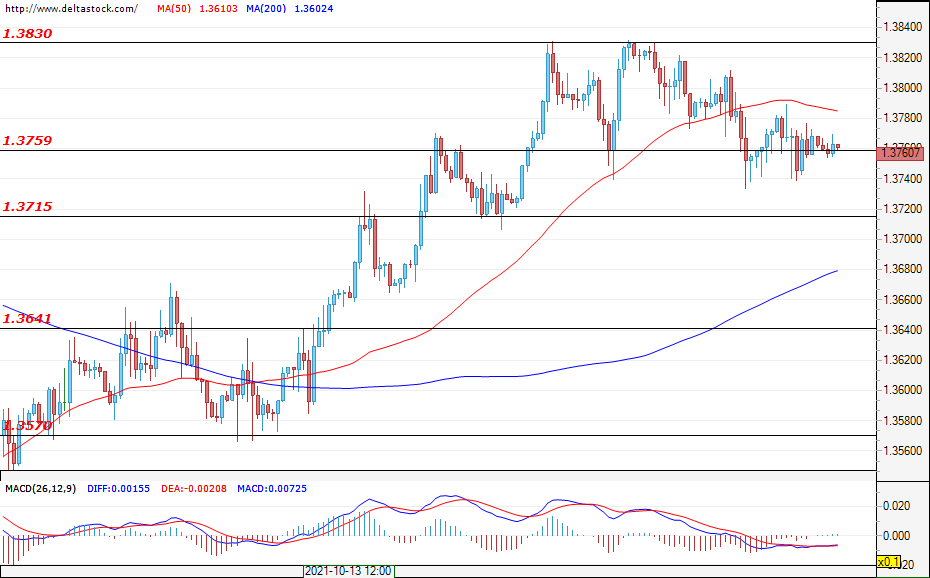
Current level - 1.3760
The pound has halted its uptrend and a complex retracement is currently developing on the market. The first support for the bulls is the area of around 1.3760, and the first resistance is 1.3830. If it takes longer for the pullback to develop, it is expected to remain limited above the local support of 1.3720. Current sentiment remains positive, and should 1.3830 be breached, the next target for the buyers could be the area at around 1.3900.
| Resistance | Support | ||
| intraday | intraweek | intraday | intraweek |
| 1.3830 | 1.3900 | 1.3760 | 1.3640 |
| 1.3900 | 1.4000 | 1.3715 | 1.3570 |
GBPUSD Pulls Back From 200-Day SMA, Maintains Bearish Pattern
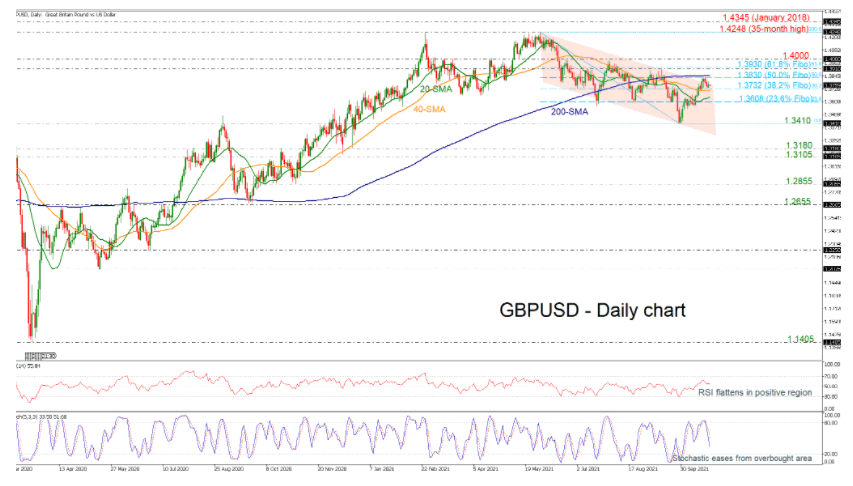
GBPUSD found a strong resistance at the 200-day simple moving average (SMA) currently at 1.3830, where the 50.0% Fibonacci retracement level of the down leg from 1.4248 to 1.3410 also happens to be. The price jumped slightly above the almost five-month-old descending channel but is retreating again in the very short-term.
Technically, the RSI indicator is moving sideways in the positive region, suggesting a weakening positive bias. The stochastic oscillator is also sending discouraging signals as it is diving towards the 20 level, confirming the recent downward move.
Failure to overcome the 200-day SMA could send the price down to the immediate support level of 1.3732, which is the 38.2% Fibonacci level, while not far below, the 40-day SMA may also be closely watched. Lower support could be next found near 1.3650, where the 20-day SMA is currently positioned, while a decisive close below this level could initially test the 23.6% Fibonacci of 1.3608 ahead of the 1.3410 number.
Alternatively, if 1.3830 proves easy to get through, the spotlight will turn to the 61.8% Fibonacci of 1.3930. On top of that, the bulls would need to clear the 1.4000 psychological level to push the rally towards the 35-month high of 1.4248.
In the medium-term picture, GBPUSD is maintaining a bearish outlook despite the insignificant violation of the downtrend channel. A drop below 1.3410 would endorse the negative outlook, though, a run above the 200-day SMA would shift the view back to neutral.
XAUUSD Is Possibly Bullish
Technical analysis
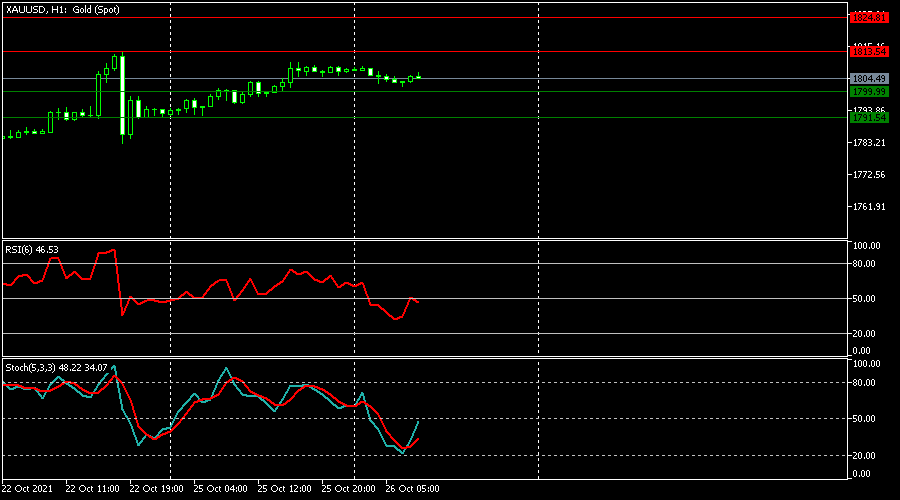
The RSI is above level 50.
The Stochastics left the oversold zone and headed upwards to level 50.
Most likely scenario – BUY
Target prices: 1,813.54 1,824.81
Alternative scenario – SELL
Target prices: 1,799.99 1,791.54
Key levels
Support 1,799.99 1,791.54
Resistance 1,813.54 1,824.81
The Upcoming ECB Meeting Is A Millstone Around The Neck Of The Euro
Markets
As one could have expected with so many key variables (including the ECB, US and EMU growth & inflation) looming on the horizon, trading was largely technically inspired yesterday. Stocks in Europe finished more or less flat while setting new highs in the US. Democratic Senator Manchin said his party should be able to reach a deal on Biden’s fiscal stimulus plans this week. Manchin’s support for it is crucial to get the package voted in Congress. Core bond yields fainted in early US dealings, leading to a bull flattening of the US curve. Changes ranged from -2.5 bps (3y) to 1.3 bps (30y). Changes in Germany amounted to -2.7 bps (2y) to +3 bps (30y). In both rising inflation expectations compensated for a decline in real yields. Gilt yields entered calmer waters after a volatile last week. The dollar traded a mixed pattern but still had the upper hand against a poorly shaped euro. EUR/USD struggled to keep the 1.16 dry. The trade-weighted DXY flipflopped around a second-degree technical reference of 93.73. A resilient sterling sent EUR/GBP below the 0.845 support again. This occurred even with BoE’s Tenreyro sticking to the view that the energy-driven inflation boost should fade soon, suggesting not everyone within the MPC is on board for a November rate hike. We also note the strong underperformance of Central-European currencies, especially against the USD.
The Japanese yen trades in the defensive in Asian dealings this morning. This causes Japanese equities to outperform. South Kora comes in second, even as GDP growth in Q3 disappointed (see below). USD/CNY hold steady near a four-month low after Chinese vice-premier Liu He and USTS Yellen had a “pragmatic, candid and constructive” phone call on economic and trade-related matters. Commodity-reliant currencies including AUD, NZD, CAD and NOK are among the better performers. The dollar (mixed) and the euro (overall weak) stick to yesterday’s trading path while core bonds lack triggers for trading. Unfortunately, there’s not a lot to change that. The economic calendar kicks off with US Conference Board consumer confidence (expected to ease one point from 109.3) but that’s basically it for today. The upcoming ECB meeting is a millstone around the neck of the euro and we hold our short-term bearish view for the common currency. EUR/USD 1.153/1.1495 is the first technical reference to the downside. In EUR/GBP we look whether recent support in the 0.842 area holds. Numerous tests since mid-October failed so far even as markets ramped up BoE rate hike bests. This suggests if the pair would force a break lower, it’ll have to come on the account of the euro.
News headlines
South Korean Q3 GDP growth slowed more than expected, from 0.8% Q/Q to 0.3% Q/Q (vs 0.6% forecasts). The annual growth figure declines from 6% to 4%. Contractions in consumption (-0.3% Q/Q) and fixed investment (-1.9% Q/Q) were the main culprit with a rebound in exports (+1.5% Q/Q with imports down 0.6% Q/Q) unable to completely erase the damage. Government spending rose 1.1% Q/Q. The softer GDP print isn’t expected to derail the Bank of Korea from a well-flagged November rate hike. The GDP slowdown should be a blip as the reopening of the economy and a significant advance in vaccination rates bodes well for (consumption in) Q4. The Korean won extends this month’s rebound with USD/KRW trading near the lowest level in a month (1165).
Turkish president Erdogan backed down on his treat to declare 10 western ambassadors persona non grata. The ten called for a release of a jailed businessman-turned-philanthropist which evoked Erdogan’s fury. A decision by the ten countries to restate their commitment to the Vienna Convention on diplomatic relations triggered the Turkish president’s U-turn. That and probably the umpteenth sell-off in Turkish assets including the lira following Erdogan’s initial decision. EUR/TRY came off a record high near 11.50 to currently trade around 11.15.
USD/CAD Buyers Could Prevail
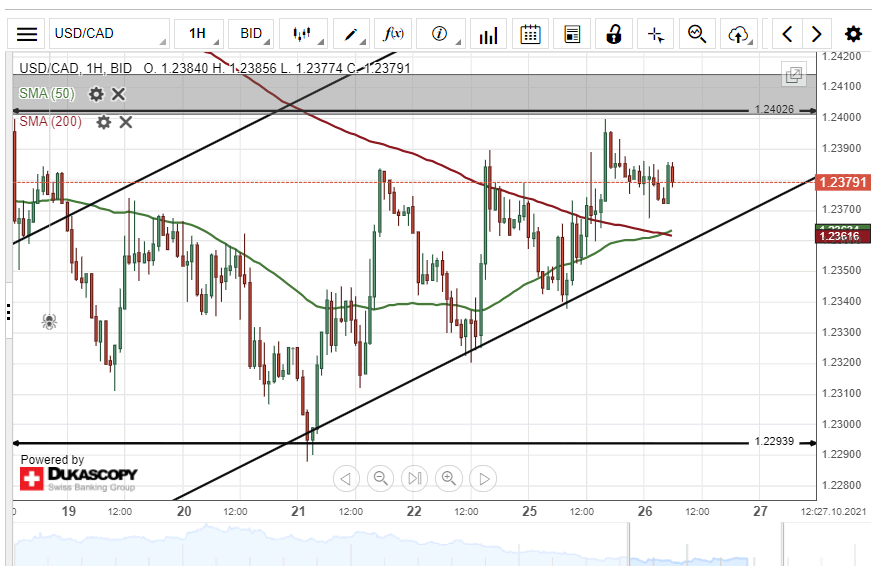
On Monday, the US Dollar rose by 52 pips or 0.42% against the Canadian Dollar. The currency pair breached the 200– hour simple moving average during Monday's trading session.
Technical indicators suggest buying signals on the 4H time-frame chart. Most likely, bullish traders could continue to drive the exchange rate higher during the following trading session.
However, the resistance line at 1.2402 could provide resistance for the USD/CAD currency exchange rate within this session.
GBP/JPY Breakout Occurs
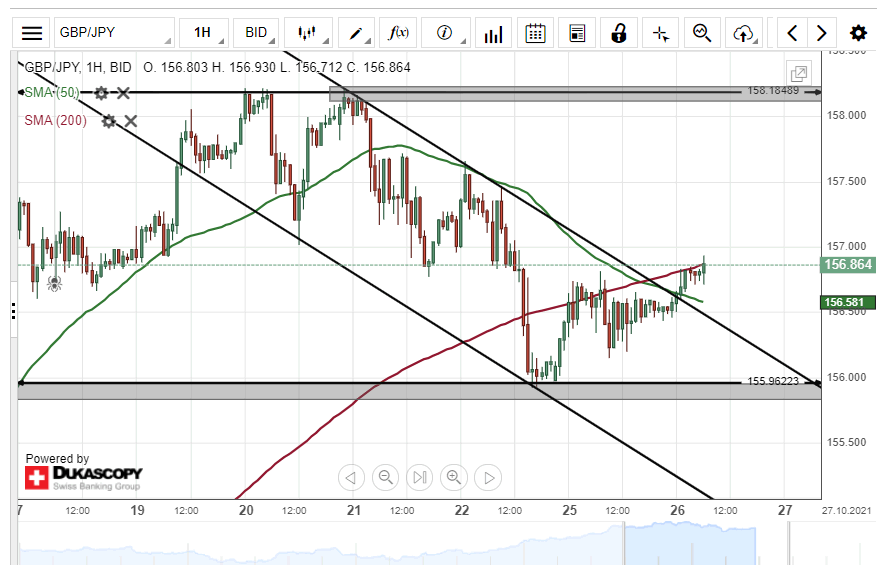
Since Monday's trading session, the British Pound has edged higher by 61 pips or 0.39% against the Japanese Yen. A breakout occurred through the upper line of a descending channel pattern during the Asian session on Tuesday.
Given that a breakout has occurred, buyers could continue to drive the exchange rate higher today. The potential target for the GBP/JPY currency pair will be near the 158.00 level.
However, the 200– hour simple moving average at 156.84 could provide resistance for the currency exchange rate within this session.
AUD/USD Bounces Off Support
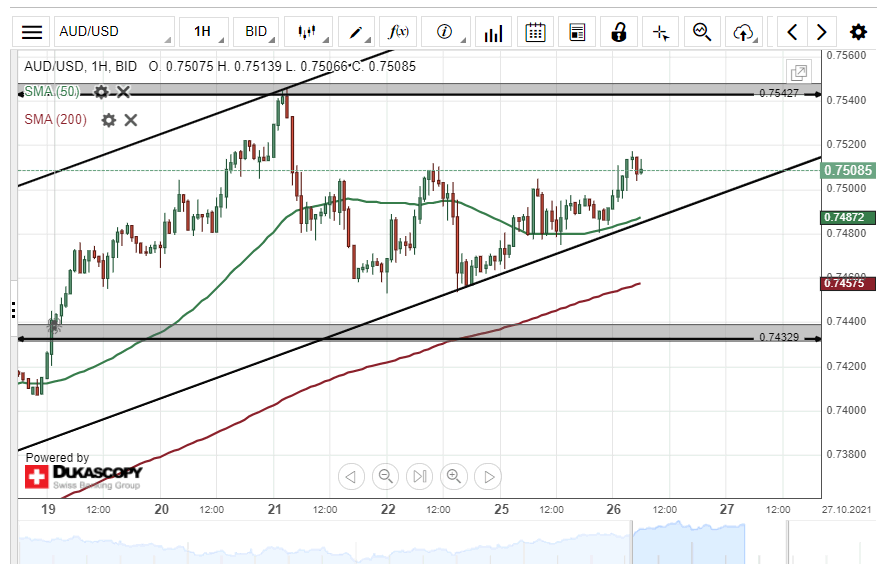
On Monday, the AUD/USD currency pair bounced off a support level at 0.7460. As a result, the Australian Dollar surged by 34 pips or 0.45% against the US Dollar during Monday's trading session.
Technical indicators suggest buying signals on the 4H and daily time-frame charts. Most likely, buyers could pressure the exchange rate higher during the following trading session.
However, the currency exchange rate could encounter resistance at 0.7540 within this session.
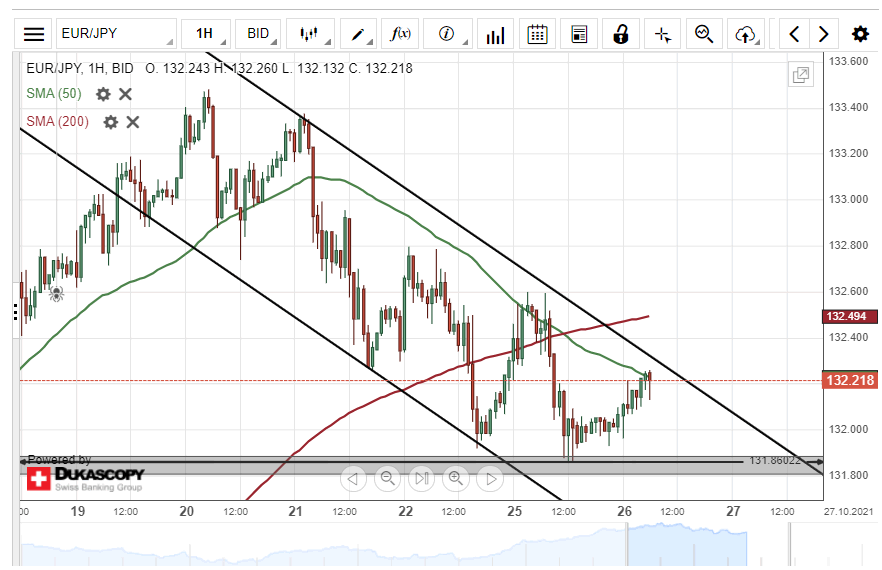
EUR/JPY Likley To Maintain Channel
On Monday, the common European currency declined by 67 pips or 0.50% against the Japanese Yen. The currency pair tested the 131.88 support level during yesterday's trading session.
All things being equal, the exchange rate is likely to continue to edge lower in a descending channel pattern within Tuesday's trading session. The potential target for sellers will be near the 131.60 level.
However, bearish traders may still encounter the support level at 131.88 within the following trading hours.