Sample Category Title
S&P 500 Index Soars To Record Highs As Tesla Soars
The price of crude oil jumped sharply in the overnight session as demand expectations continued rising. Brent, the international benchmark, rose to more than $86 while West Texas Intermediate (WTI) rose above $85 for the first time in seven months. The rally was triggered by an analyst note from Goldman Sachs. In their note, the analysts noted that demand had already recovered from last year’s collapse and that it was heading towards 100 million barrels per day. The bank also noted that the surging natural gas prices were pushing companies to buy oil for power generation.
The US dollar index rose in the overnight session as investors waited for key economic data from the United States. The Conference Board will publish the latest consumer confidence data later today. Economists expect that the data will show that consumer confidence declined from 109.3 to 108.3. This decline will mostly be because of the rising consumer prices. Recent data showed that prices rose by 5.4% in October. Other numbers that will be in the spotlight will be new home sales numbers. These numbers are expected to rise from 740k to 760k. Also, the US will release the latest house price index data.
The economic calendar will be relatively muted today. Therefore, investors will continue watching the rising crude oil and natural gas prices. At the same time, the market will be watching the ongoing earnings season. The companies that will be in the spotlight today will be S&P Global, Centene Corporation, Xerox, Raytheon, UPS, ADM, and Waste Management. Other companies to watch will be Microsoft, Invesco, and PulteGroup.
SPX500
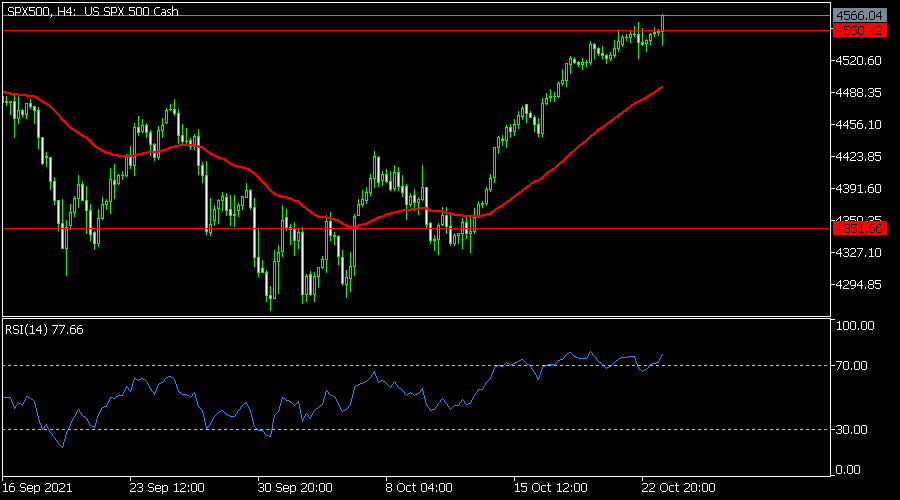
The S&P 500 index soared to an all-time high as investors remained optimistic about the strong earnings. The index soared to $4,565, which was the highest level on record. By doing so, it moved slightly above the previous all-time high of $4,550. It is still above the 25-day and 50-day moving averages while the Relative Strength Index and MACD have kept rising. Therefore, the index will likely keep rallying after the bullish breakout.
US30
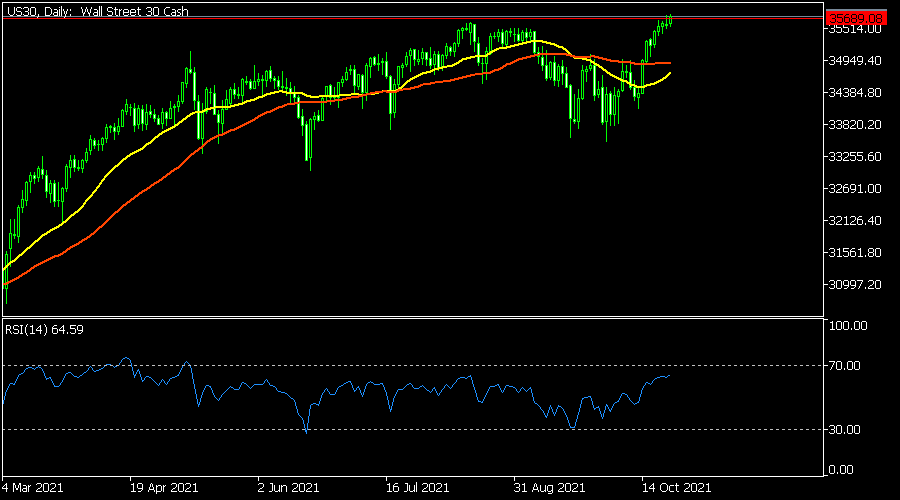
The Dow Jones index soared to an all-time high of $35,690 as investors cheered the strong results and rising oil prices. Like the S&P 500 index, the Dow Jones is above the short and long-term moving averages. On the daily chart, it is along the previous all-time high and it has formed a small cup and handle pattern. Therefore, the index will likely keep rising as bulls target the next key resistance at $36,000.
EURUSD
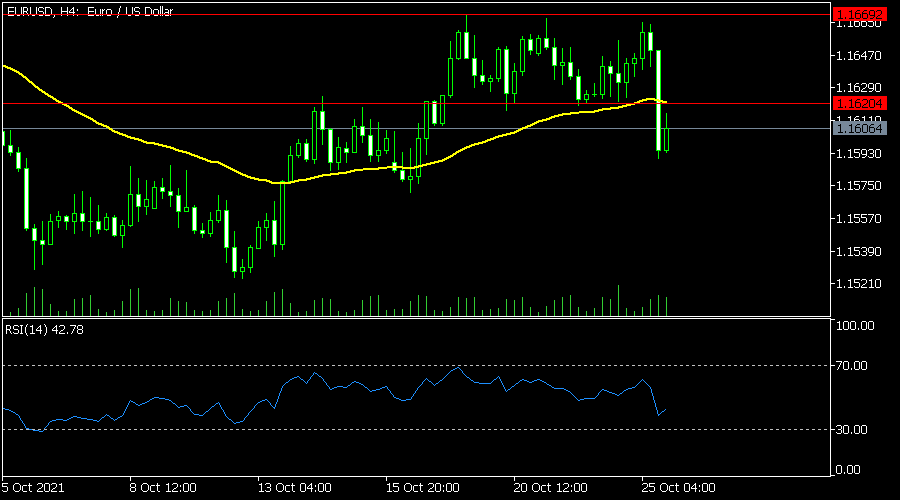
The EURUSD pair declined sharply in the overnight session as the US dollar bounced back. On the four-hour chart, the pair declined to a low of 1.1590. The price managed to move below the key support at 1.1620. It has moved below the 25-day moving average while the Relative Strength Index (RSI) has moved lower. Therefore, after the bearish breakout, the pair will likely keep falling as bears target the next key support at 1.1550.
German Ifo: Supply problems now impacts manufacturing export
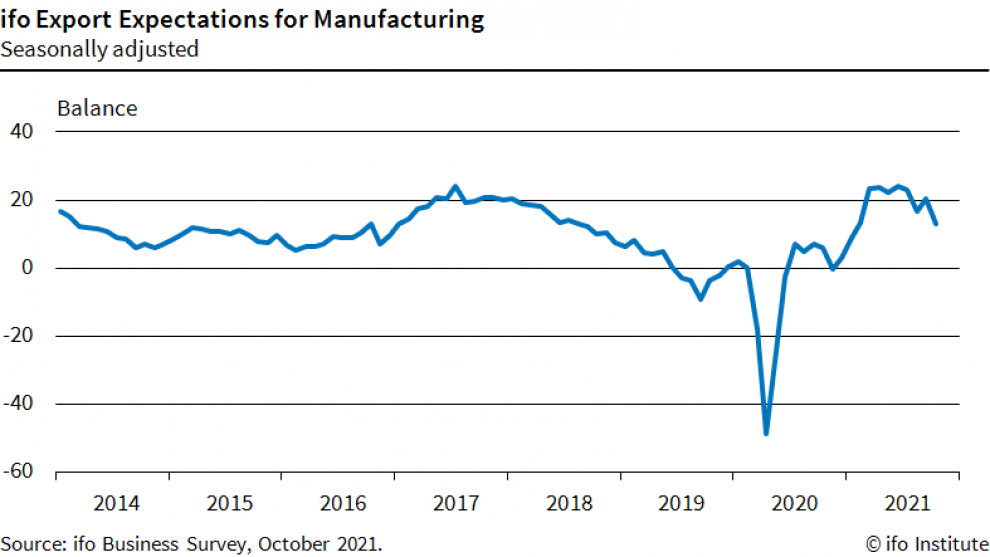
Germany's Ifo export expectations dropped sharply from 20.5 to 13.0 in October, hitting the lowest level since February. Ifo said, "supply problems in intermediate products are now having an impact on manufacturing export".
President of Ifo Clemens Fuest said: "In the electrical and electronics sector, export expectations have softened but remain at a high level, with companies continuing to expect good international business. However, the mood is bleaker in the chemical industry, where growth rates will be significantly slower. The situation is similar for the automotive industry. In the food and furniture industries, exports are expected to remain constant. The textile and leather industries are now preparing for declining international sales."
GBP/JPY Daily Outlook
Daily Pivots: (S1) 156.14; (P) 156.48; (R1) 156.91; More...
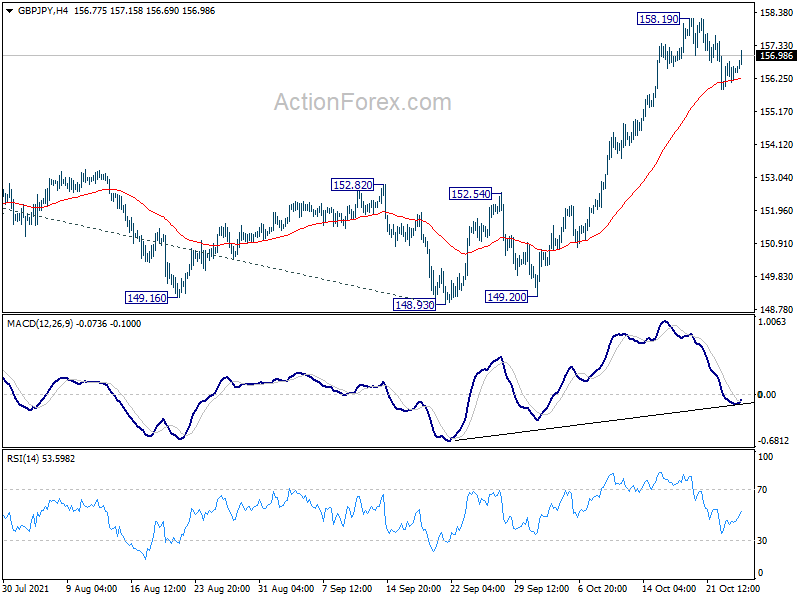
GBP/JPY recovered after drawing support from 4 hour 55 EMA and intraday bias is turned neutral first. On the upside, break of 158.19 will resume larger up trend from 123.94. Next target will be 61.8% projection of 136.96 to 156.05 from 148.93 at 160.72.
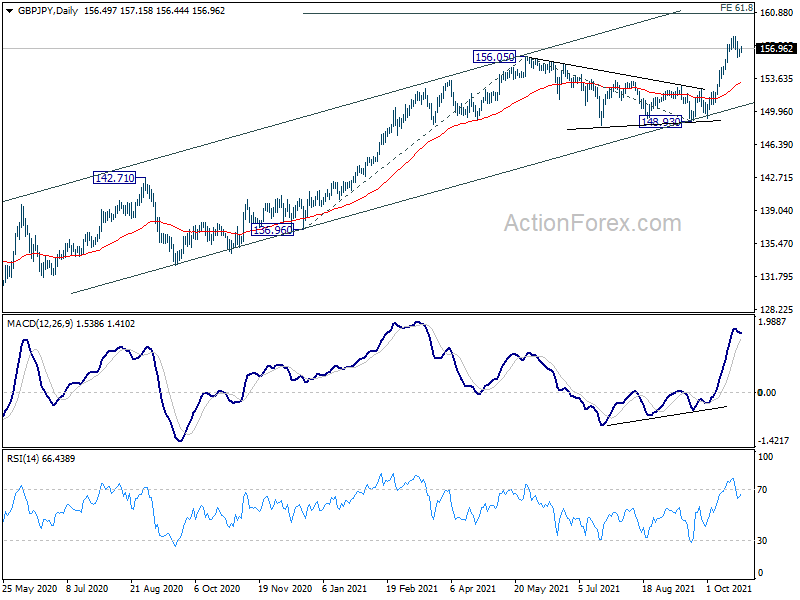
In the bigger picture, rise from 123.94 is seen as the third leg of the pattern from 122.75 (2016 low). The stay above 55 week EMA affirms medium term bullishness. Current rise should now target 61.8% retracement 195.86 (2015 high) to 122.75 at 167.93 next. In any case, outlook will remain bullish as long as 148.93 structural support hold, even in case of deep pull back.
EUR/JPY Daily Outlook
Daily Pivots: (S1) 131.73; (P) 132.17; (R1) 132.46; More....
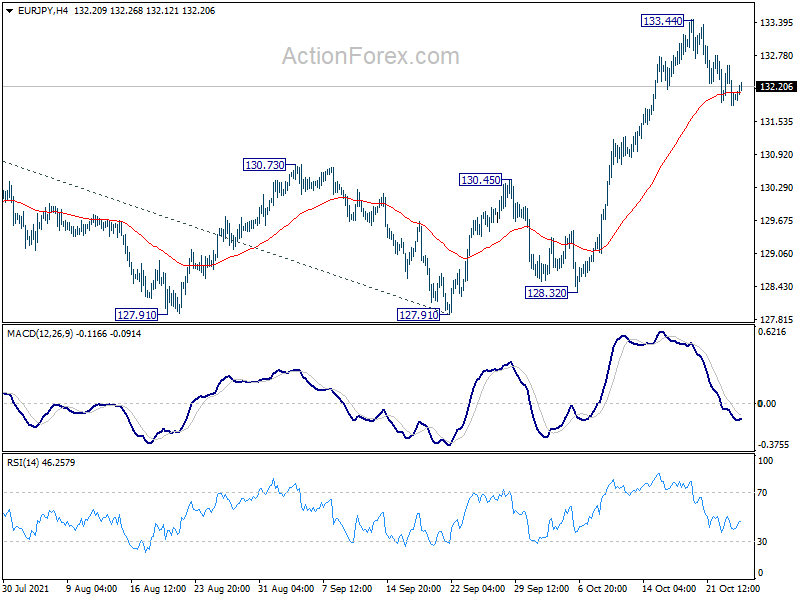
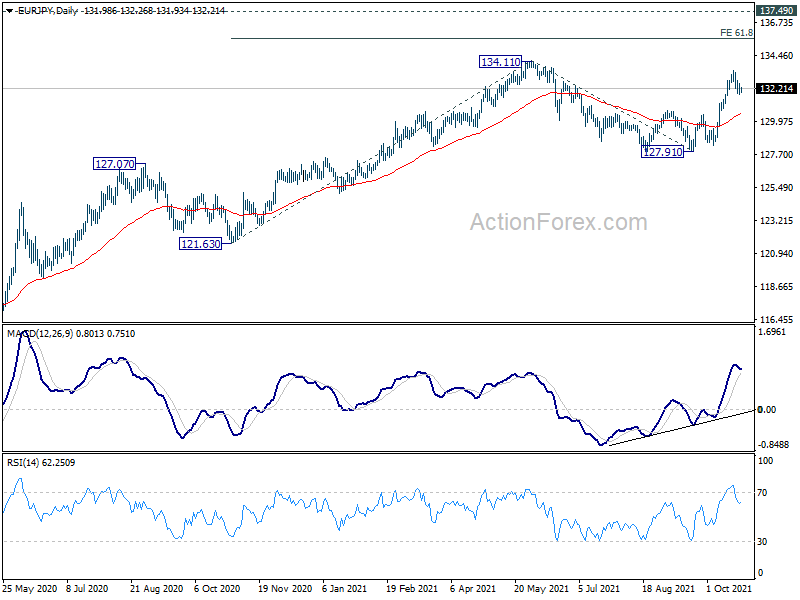
Intraday bias in EUR/JPY is turned neutral as it's trying to draw support from 4 hour 55 EMA. On the upside, break of 133.44 will target 134.11 high first. Firm break there will resume larger up trend from 114.42. Next target is 61.8% projection of 121.63 to 134.11 from 127.91 at 135.62.
In the bigger picture, rise from 114.42 (2020 low) is still in progress and the strong support support from 55 week EMA affirms medium term bullishness. Further rise would be seen to retest 137.49 (2018 high). Decisive break there will resume the whole long term rise from 109.03 (2016 low). Next target will be 100% projection of 109.03 to 137.49 from 114.42 at 142.88. This will now remain the favored case as long as 127.91 support holds.
EUR/GBP Daily Outlook
Daily Pivots: (S1) 0.8418; (P) 0.8443; (R1) 0.8458; More...
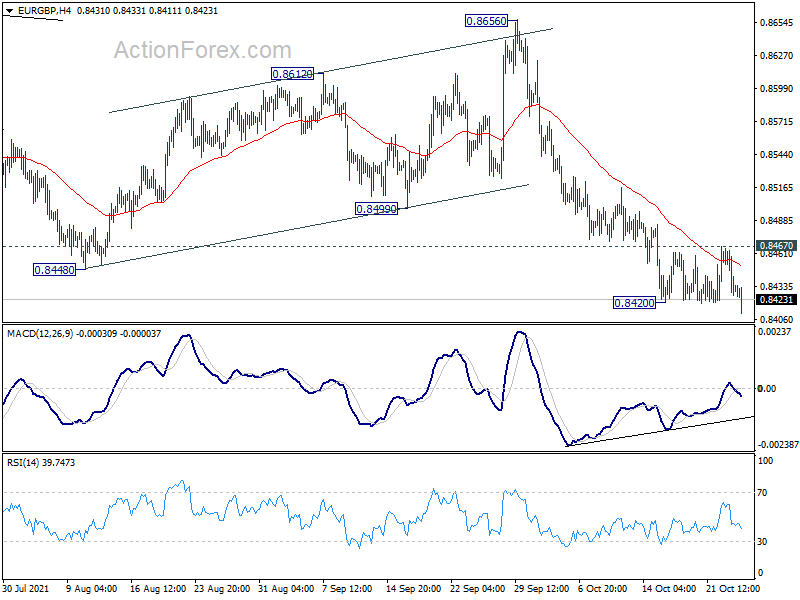
EUR/GBP's declined resumed by breaking 0.8420 and intraday bias is back on the downside. The current down trend from 0.9499 is in progress for 0.8276 key long term support next. On the upside, break of 0.8467 minor resistance will now indicate short term bottoming,and bring stronger rebound back to 55 day EMA (now at 0.8516).
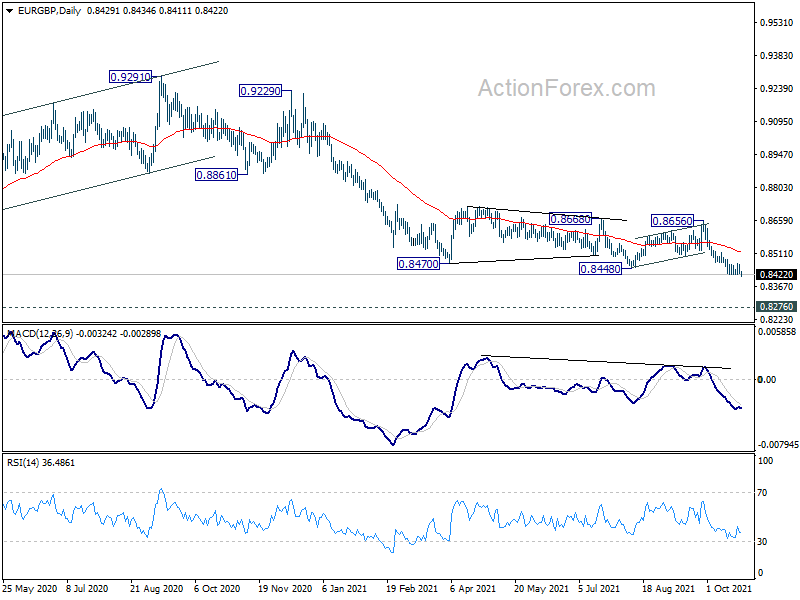
In the bigger picture, price actions from 0.9499 (2020 high) are still seen as developing into a corrective pattern. Deeper fall could be seen as long as 0.8656 resistance holds, towards long term support at 0.8276. However, firm break of 0.8656 resistance would argue that a medium term bottom was already formed. Stronger rise would be seen to 0.8861 support turned resistance to confirm completion of the corrective pattern.
EUR/AUD Daily Outlook
Daily Pivots: (S1) 1.5458; (P) 1.5527; (R1) 1.5567; More...
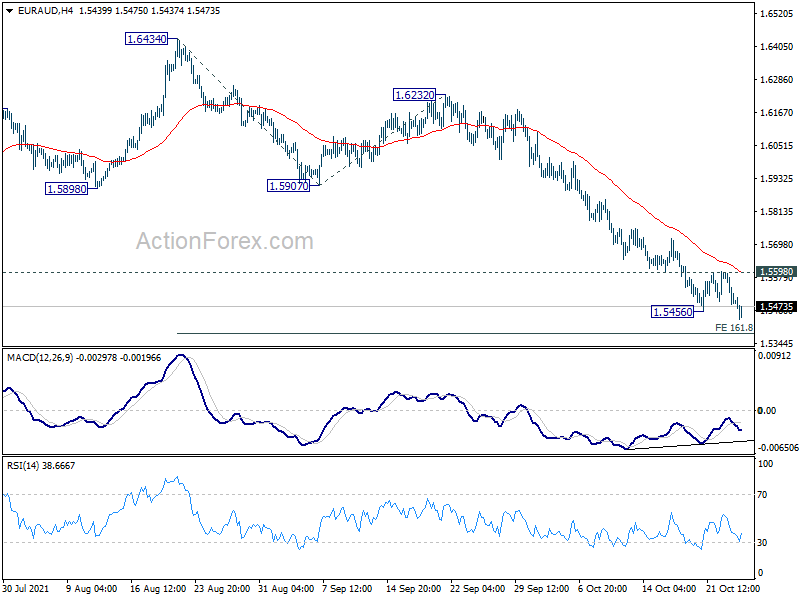
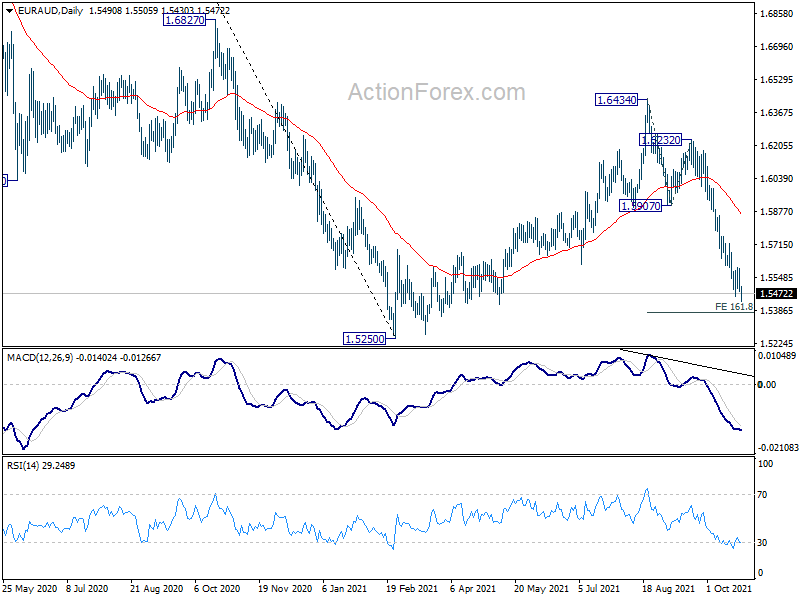
EUR/AUD's fall resumed by breaking 1.5456 and intraday bias is back on the downside for 161.8% projection of 1.6434 to 1.5907 from 1.6232 at 1.5379 Break there will target 1.5250 low. Nevertheless, break of 1.5598 minor resistance will turn bias to the upside for stronger rebound to 55 day EMA (now at 1.5878).
In the bigger picture, with 38.2% retracement of 1.9799 to 1.5250 at 1.6988 intact, the down trend from 1.9799 (2020 high) is expected to resume at a later stage. Firm break of 1.5250 will target 61.8% retracement of 1.1602 (2012 low) to 1.9799 at 1.4733. In any case, sustained break of 1.6988 fibonacci level is needed to indicate long term reversal.
EUR/CHF Daily Outlook
Daily Pivots: (S1) 1.0661; (P) 1.0677; (R1) 1.0695; More....
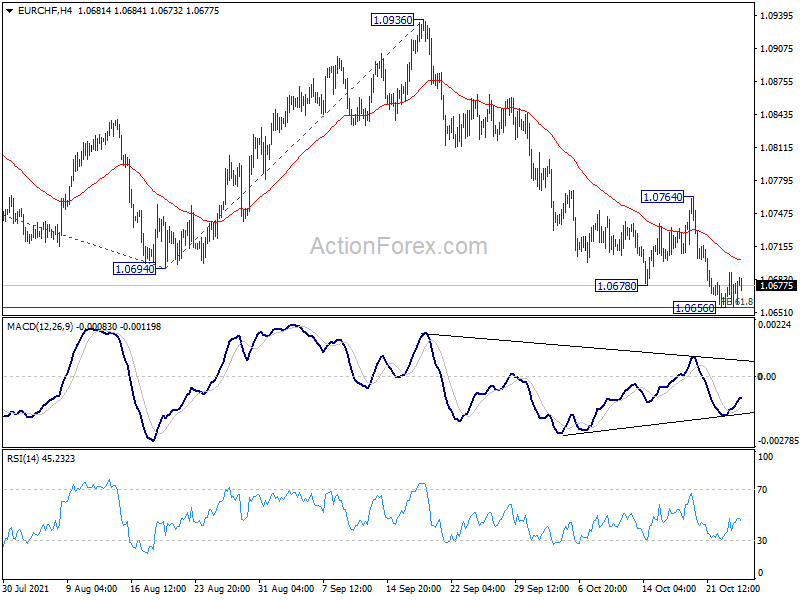
Intraday bias in EUR/CHF remains neutral for the moment. On the upside, break of 1.0764 resistance is needed to indicate short term bottoming. Otherwise, outlook will stay bearish. On the downside, break of 1.0656 will resume larger fall from 1.1149 to 100% projection of 1.1149 to 1.0694 from 1.0936 at 1.0481.
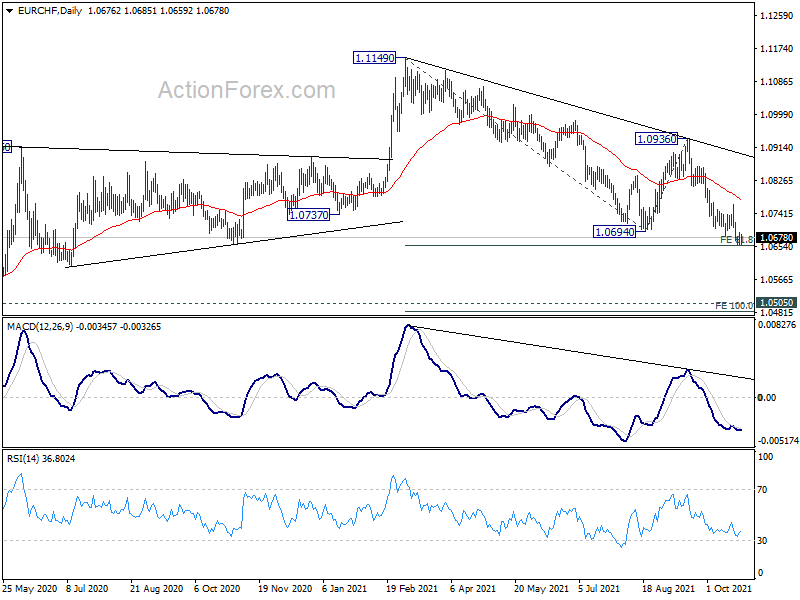
In the bigger picture, the rejection by 55 week EMA maintains medium term bearishness. Fall from 1.1149 (2021 high) is currently seen as the second leg of the patter from 1.0505 (2020 low) first. Hence, in case of deeper fall, we'd look for strong support from 1.0505 to bring rebound. However, sustained break of 1.0505 will resume the long term down trend from 1.2004 (2018 high). Also, medium term outlook will now be neutral at best as long as 1.0936 resistance holds.
EUR/USD Daily Outlook
Daily Pivots: (S1) 1.1579; (P) 1.1622; (R1) 1.1653; More...
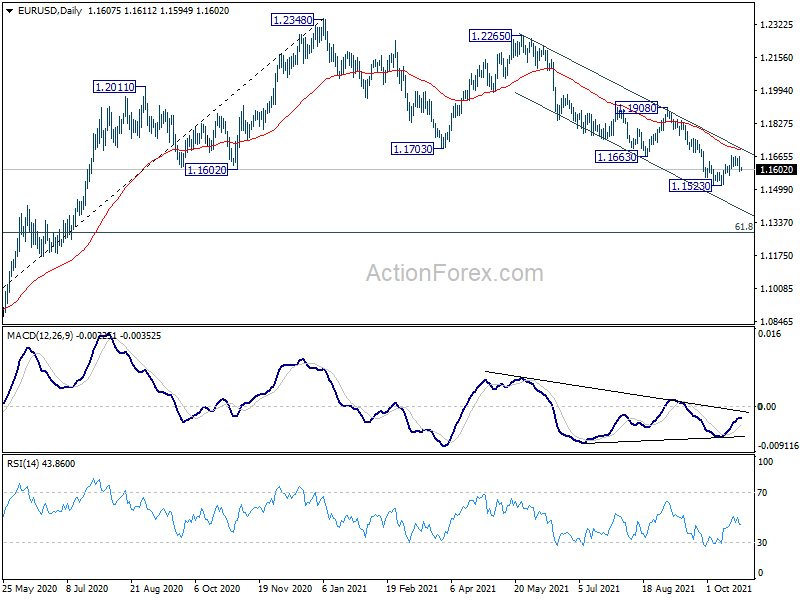
Intraday bias in EUR/USD remains neutral at this point. On the upside, break of 1.1668 will target 55 day EMA (now at 1.1695). Sustained break there will be a sign that larger correction from 1.2348 has completed. Stronger rally would be seen to 1.1908 resistance for confirmation. On the downside, though, break of 1.1571 minor support will turn bias back to the downside for 1.1523 support instead. Break there will resume larger fall from 1.2348.
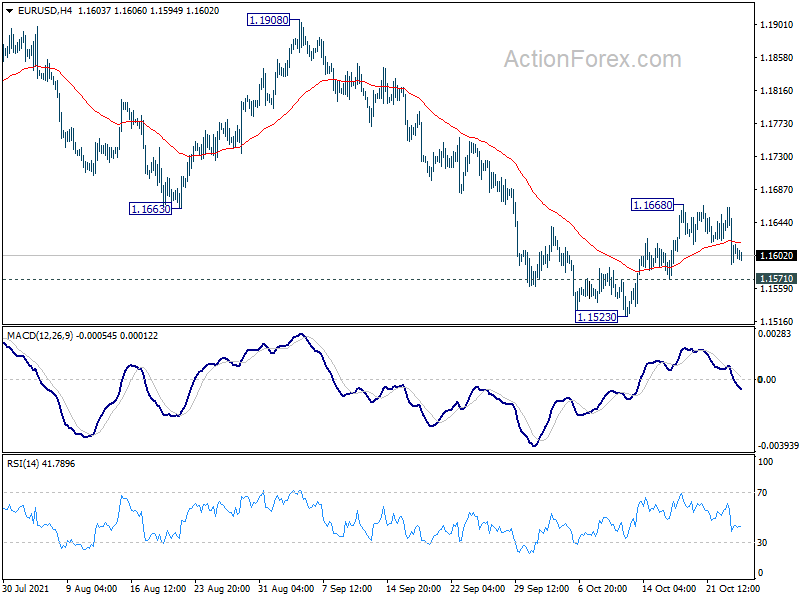
In the bigger picture, price actions from 1.2348 should at least be a correction to rise from 1.0635 (2020 low). As long as 1.1908 resistance holds, deeper fall would be seen to 61.8% retracement of 1.0635 to 1.2348 at 1.1289. Nevertheless break of 1.1908 resistance will revive medium term bullishness and turn focus back to 1.2348 high.
GBP/USD Daily Outlook
Daily Pivots: (S1) 1.3743; (P) 1.3767; (R1) 1.3793; More...
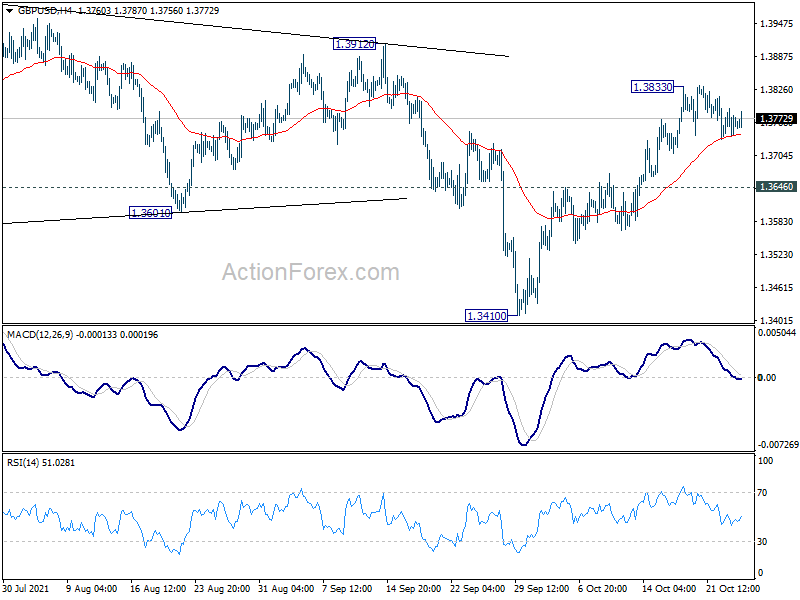
GBP/USD is staying in consolidation from 1.3833 temporary top and intraday bias remains neutral. Further rise is expected with 1.3646 support intact. On the upside, above 1.3833 will target 1.3912 key structural resistance. Firm break there will indicate that the correction from 1.4248 is complete with three waves down to 1.3410. Further rally would then be seen to retest 1.4248 high. However, break of 1.3646 will turn bias to the downside for retesting 1.3410 low.
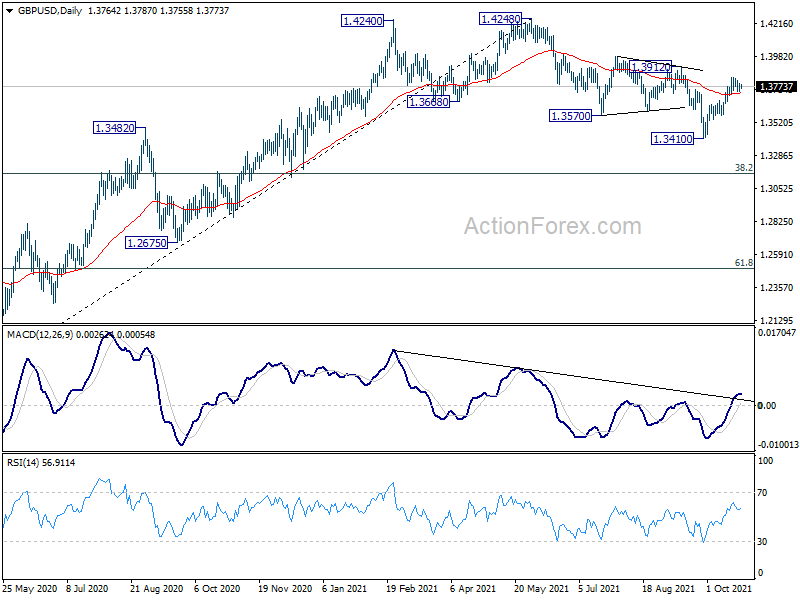
In the bigger picture, the structure of the fall from 1.4248 suggests that it's a correction to the up trend from 1.1409 (2020 low) only. While deeper fall cannot be ruled out yet, downside should be contained by 38.2% retracement of 1.1409 to 1.4248 at 1.3164, at least on first attempt, to bring rebound. On the upside, firm break of 1.4376 key resistance (2018 high) will add to the case of long term bullish reversal. However, sustained trading below 1.3164 will revive some medium term bearishness and target 61.8% retracement at 1.2493.
USD/CHF Daily Outlook
Daily Pivots: (S1) 0.9165; (P) 0.9184; (R1) 0.9218; More....
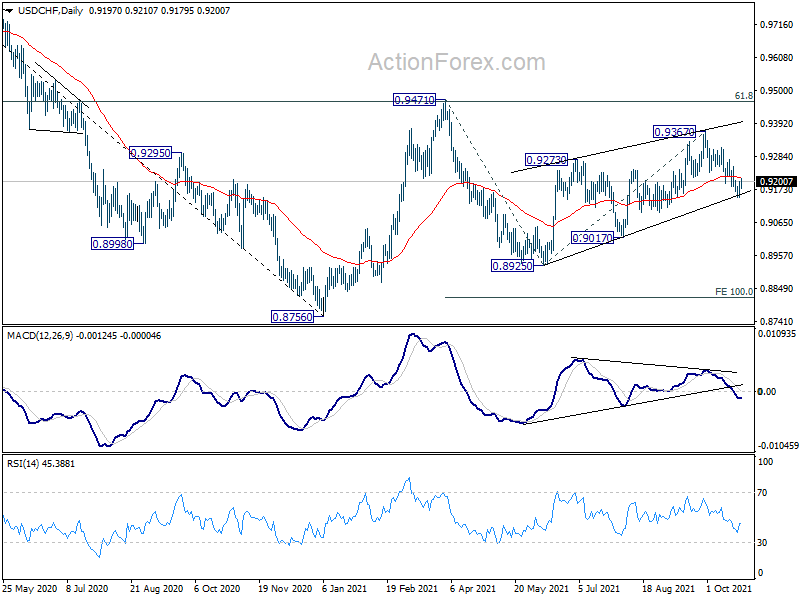
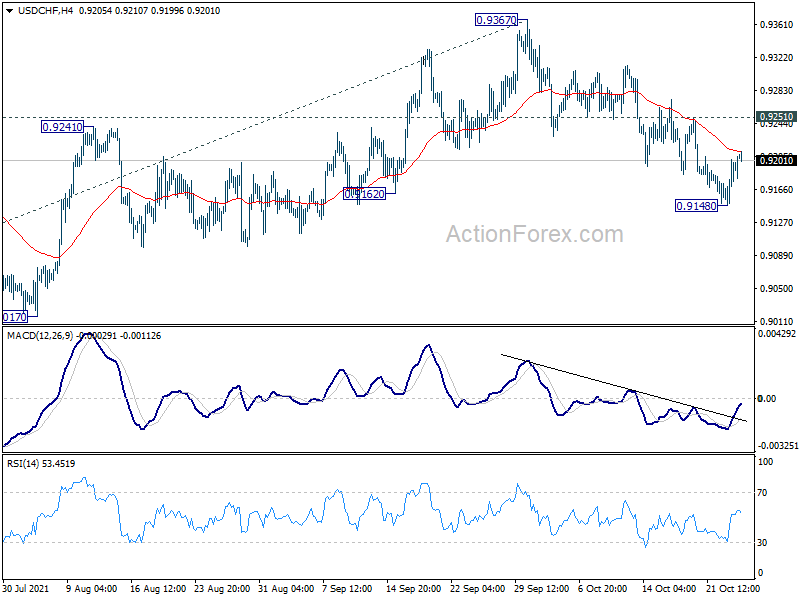
Intraday bias in USD/CHF remains neutral for the moment. Further decline is still in favor with 0.9251 minor resistance intact. Corrective rise from 0.8927 should be complete with three waves up to 0.9367, on bearish divergence condition in daily MACD. Below 0.9148 will target 0.9017 support first, and then 0.8925 support next. On the upside, however, break of 0.9251 minor resistance will turn bias back to the upside for retesting 0.9367 instead.
In the bigger picture, the corrective structure of the rebound from 0.8925 argues that fall from 0.9471 is not completed yet. It could either be the second leg of pattern from 0.8756 (2021 low), or resuming larger down trend from 1.0237 (2018 high). We'd pay attention to the downside momentum and assess the odds later. But for now, medium term outlook will be neutral at best as long as 0.9471 resistance holds.