Sample Category Title
GBP/JPY Daily Outlook
Daily Pivots: (S1) 157.08; (P) 157.57; (R1) 158.26; More...
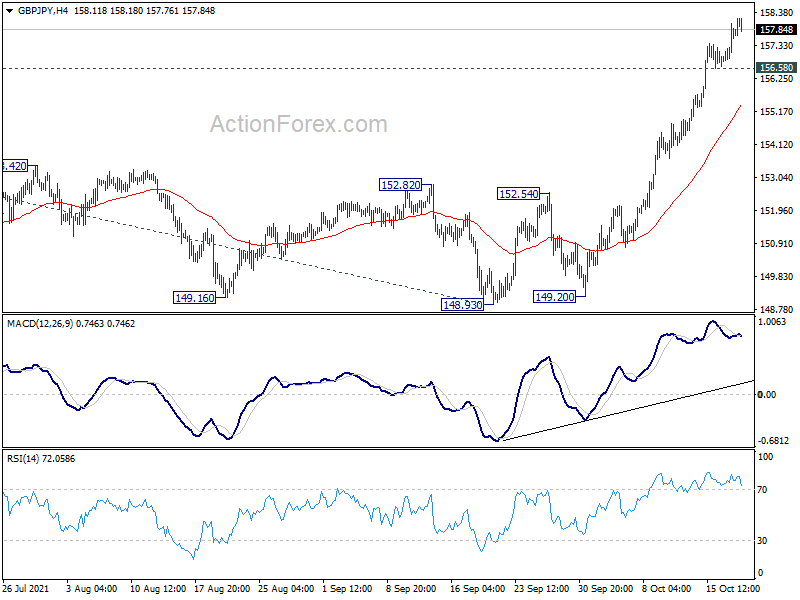
Intraday bias in GBP/JPY remains on the upside for the moment. Current up trend from 123.94 should target 61.8% projection of 136.96 to 156.05 from 148.93 at 160.72 next. On the downside, below 156.58 minor support will turn intraday bias neutral and bring consolidations first, before staging another rally.
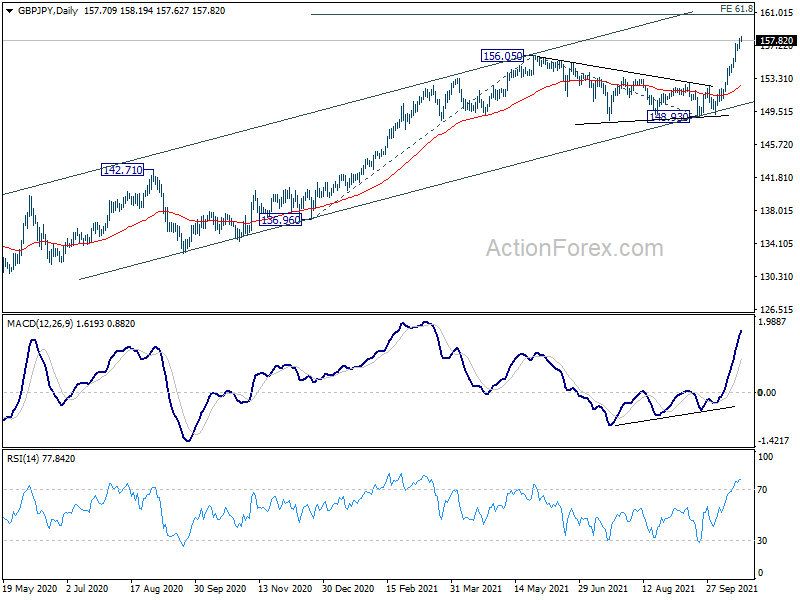
In the bigger picture, rise from 123.94 is seen as the third leg of the pattern from 122.75 (2016 low). The stay above 55 week EMA affirms medium term bullishness. Current rise should now target 61.8% retracement 195.86 (2015 high) to 122.75 at 167.93 next. In any case, outlook will remain bullish as long as 148.93 structural support hold, even in case of deeper pull back.
EUR/JPY Daily Outlook
Daily Pivots: (S1) 132.74; (P) 132.96; (R1) 133.30; More....
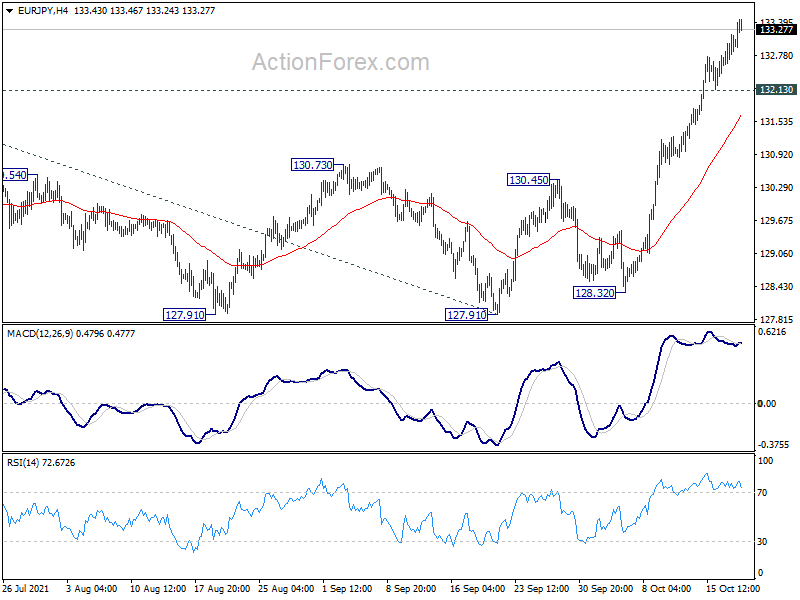
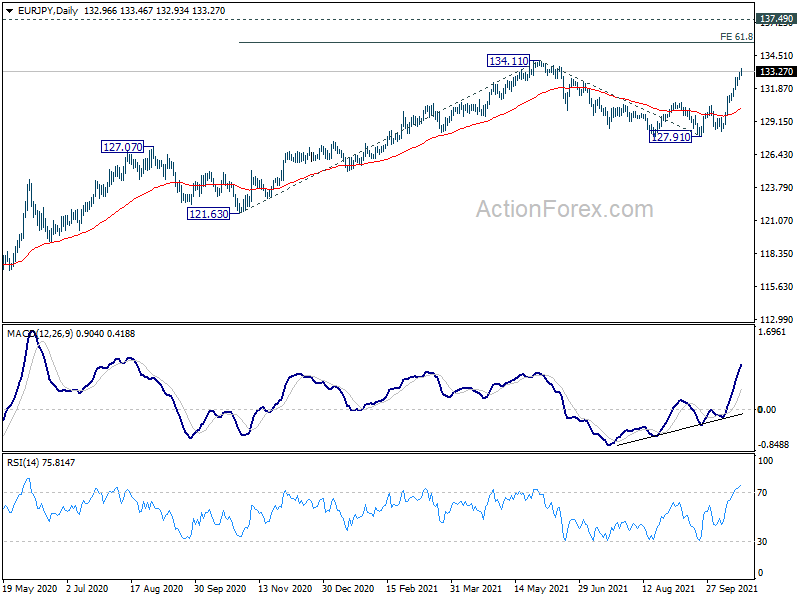
Intraday bias in EUR/JPY remains on the upside for 134.11 high. Firm break there will resume larger up trend from 114.42. Next target is 61.8% projection of 121.63 to 134.11 from 127.91 at 135.62. On the downside, below 132.13 minor support will turn intraday bias neutral and bring consolidation first, before staging another rally.
In the bigger picture, rise from 114.42 (2020 low) is still in progress and the strong support support from 55 week EMA affirms medium term bullishness. Further rise would be seen to retest 137.49 (2018 high). Decisive break there will resume the whole long term rise from 109.03 (2016 low). Next target will be 100% projection of 109.03 to 137.49 from 114.42 at 142.88. This will now remain the favored case as long as 127.91 support holds.
EUR/GBP Daily Outlook
Daily Pivots: (S1) 0.8418; (P) 0.8440; (R1) 0.8458; More...
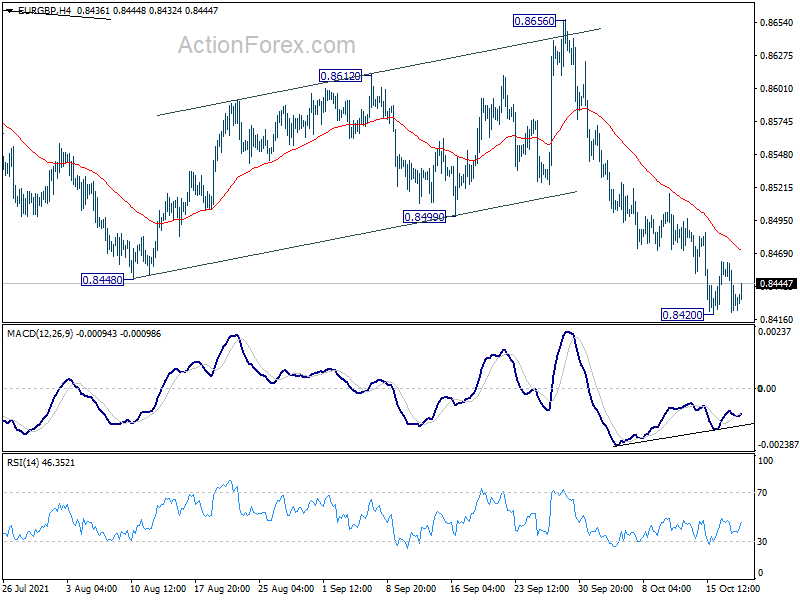
Intraday bias in EUR/GBP remains neutral as consolidation from 0.8420 temporary low is extending. On the downside, break of 0.8420 will resume the larger down trend from 0.9499 to 0.8276 key long term support next. On the upside, though, sustained break of 55 day EMA (now at 0.8529) will bring stronger rebound back to 0.8656 resistance.
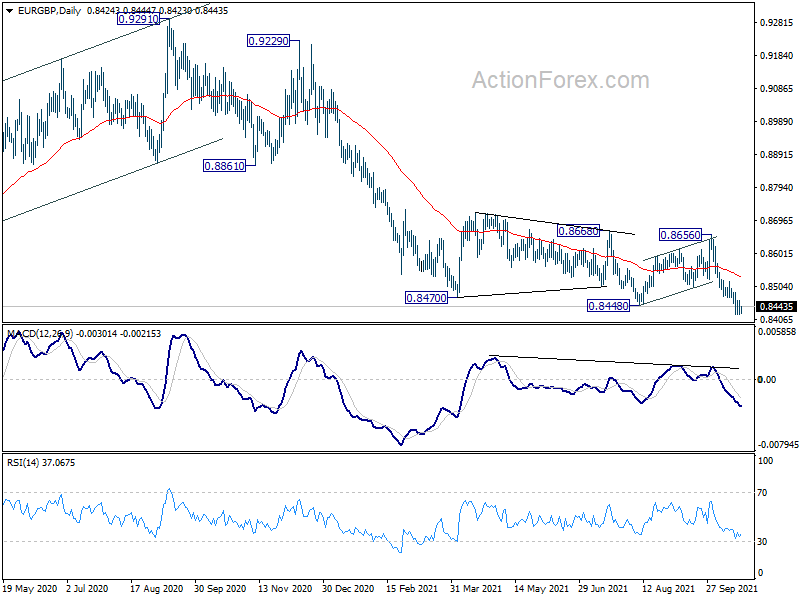
In the bigger picture, price actions from 0.9499 (2020 high) are still seen as developing into a corrective pattern. Deeper fall could be seen as long as 0.8656 resistance holds, towards long term support at 0.8276. However, firm break of 0.8656 resistance would argue that a medium term bottom was already formed. Stronger rise would be seen to 0.8861 support turned resistance to confirm completion of the corrective pattern.
EUR/AUD Daily Outlook
Daily Pivots: (S1) 1.5514; (P) 1.5594; (R1) 1.5642; More...
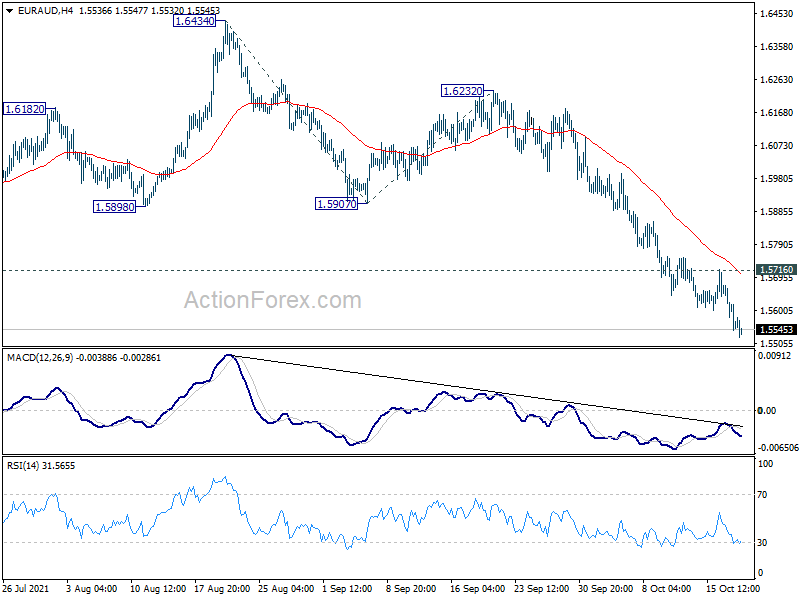
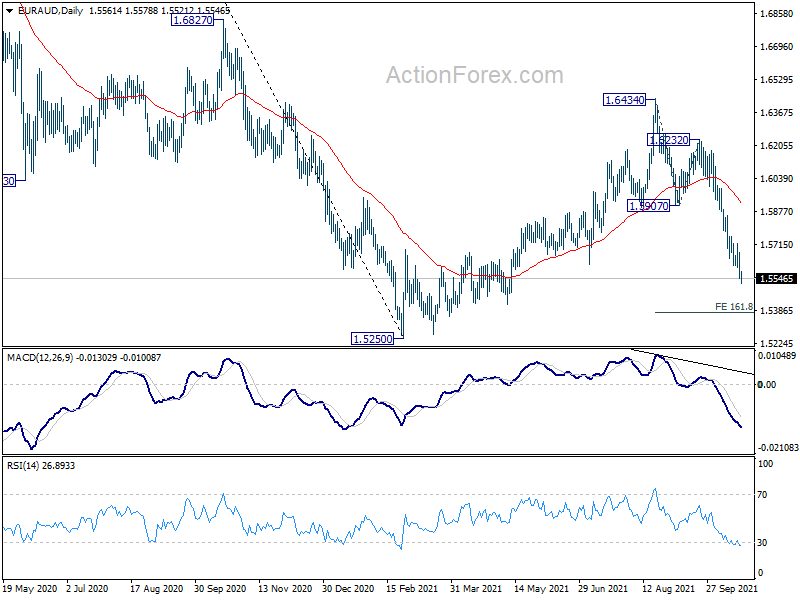
Intraday bias in EUR/AUD remains on the downside at this point. Current decline from 1.6434 is in progress for 161.8% projection of 1.6434 to 1.5907 from 1.6232 at 1.5379 next. On the upside, above 1.5716 minor resistance will turn intraday bias neutral and bring consolidations. But near term outlook will remain bearish as long as 1.5907 support turned resistance holds.
In the bigger picture, rise from 1.5250 medium term bottom is seen as a correction to the down trend from 1.9799 (2020 high) only. With 38.2% retracement of 1.9799 to 1.5250 at 1.6988 intact, such down trend is expected to resume at a later stage. Firm break of 1.5250 will target 61.8% retracement of 1.1602 (2012 low) to 1.9799 at 1.4733. In any case, sustained break of 1.6988 fibonacci level is needed to indicate long term reversal.
EUR/CHF Daily Outlook
Daily Pivots: (S1) 1.0718; (P) 1.0730; (R1) 1.0748; More....
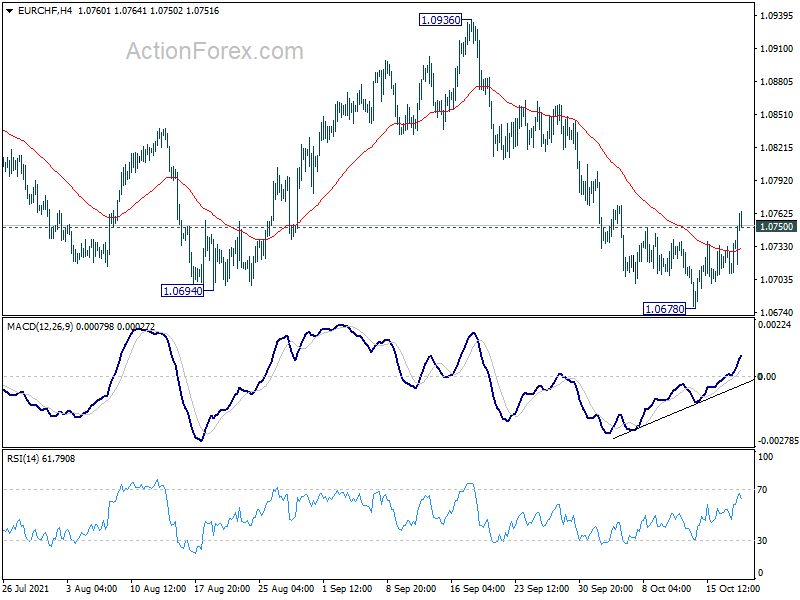
EUR/CHF's break of 1.0750 resistance suggests short term bottoming at 1.0678, on bullish convergence condition in 4 hour MACD. Stronger rebound could be seen to 55 day EMA (now at 1.0794). Sustained break there will target 1.0936 resistance. On the downside, break of 1.0678 will resume larger fall from 1.1149.
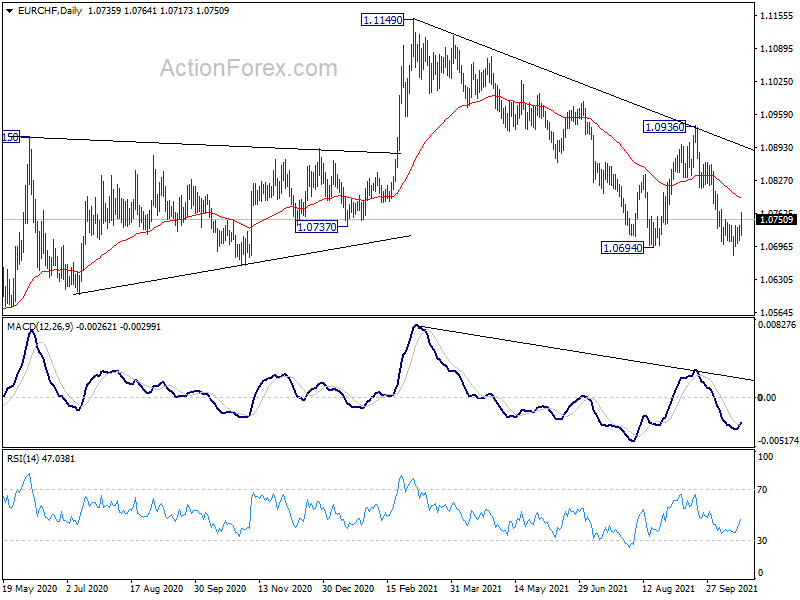
In the bigger picture, the rejection by 55 week EMA maintains medium term bearishness. Fall from 1.1149 (2021 high) is currently seen as the second leg of the patter from 1.0505 (2020 low) first. Hence, in case of deeper fall, we'd look for strong support from 1.0505 to bring rebound. However, sustained break of 1.0505 will resume the long term down trend from 1.2004 (2018 high). Also, medium term outlook will now be neutral at best as long as 1.0936 resistance holds.
The US 10-Yr Yield Reached A New Short-Term High At 1.67% This Morning
Markets
Core bonds can’t catch a break. Selling pressure focused on longer tenors yesterday. The US yield curve steepened with daily changes ranging between -2.9 bps (2-yr) and +5.1 bps (30-yr). The US 10-yr yield reached a new short-term high at 1.67% this morning. The YTD recovery high stands at 1.77%. The German yield curve bear steepened with yields adding up to 6 bps at the very long end. The German 10-yr yield (-0.10%) again closes in on the YTD recovery high of -0.07% which is the first reference of a resistance zone stretching via -0.05% (50% retracement on 2018-2020 decline) to the psychologic 0% barrier. Real yields were responsible for the lion share of yesterday’s action even as central bankers push back against the aggressive repositioning on money markets. The German 10y real yield bounced 5 bps off the all-time low near -2.1%. These underlying dynamics help explain the euro’s performance against an overall weak dollar. EUR/USD closed at 1.1633 from an 1.1609 open after a failed intraday test of first support at EUR/USD 1.1664. The pair this morning seems on its way for a second attempt. The trade-weighted dollar closed narrowly above 93.73/67 first support, but is losing the threshold as we near the start of European dealings. USD weakness and CNY strength caused a strong move lower in USD/CNY with the pair diving sub-6.40 for the first time since June and escaping the 6.42-6.50 trading range of the past months. USD/JPY remains exception to the rule as JPY can’t battle both rising (real) yields and a neutral/slightly positive risk climate. USD/JPY is currently testing the 2018 top (114.55) with next big resistance at the end of 2016 high of 118.66. EUR/JPY (133.43) is rapidly closing in on the YTD high at 134.13. Sterling outperformed the euro as the UK currency continued to receive (ST) interest rate support in the wake of this weekend’s hawkish BoE Bailey comments. EUR/GBP’s attempt to recapture 0.8450 fails so far. This morning’s softer than expected UK CPI numbers (0.3% M/M & 3.1% Y/Y vs 0.4% M/M & 3.2% Y/Y) might trigger a new attempt.
Today’s eco calendar can’t inspire with only final September EMU CPI numbers. Focus again shifts to speeches by ECB governors who reluctantly witness markets discounting a 2022 inaugural rate hike. The US Treasury sells $24bn of 20-yr bonds. The outcome will be telling for sentiment at the very long end of the (US) curve. The Fed’s Beige Book provides anecdotic evidence about the state of the US economy. Inflation pressures are a given, but how about (future?) growth. Will it add to stagflation worries? While interesting, we don’t expect a big market impact. Focus remains on the sell-off in core bonds, which this week doesn’t spill into stress on other markets (eg stocks; peripheral debt; FX) yet.
News headlines
Chinese home prices declined 0.08% in September, the first drop since April 2015. Only 27 cities reported monthly prices gains, compared to 46 in September, the lowest since February 2020. Prices for existing homes in the secondary market fell for a second consecutive month (0.19%). The decline comes amid attempts of local authorities to reign in real estate speculation by tightening borrowing conditions for real estate transactions. Compared to the same month last year, price growth for new homes eased to 3.8% in September from 4.2% in August. As the sector was an important contributor to overall growth for the Chinese economy, further price declines might complicate the broader picture on growth. It also might add to financial stability issues with respect to big developers.
US housing data disappointed as well. Housing starts declined by 1.6% M/M. The August figure was downwardly revised to 1.2% from 3.9%. Building permits even unexpectedly fell by 7.7% M/M, bringing the absolute level to the lowest since September last year. Shortages both in materials and in the labour market are mentioned as the main reason behind the slowdown. Housing completions dropped 4.6%, reaching the lowest level since August last year. At the same time the stock of housing under construction increased further, resulting in a record gap between finished houses and housing under construction.
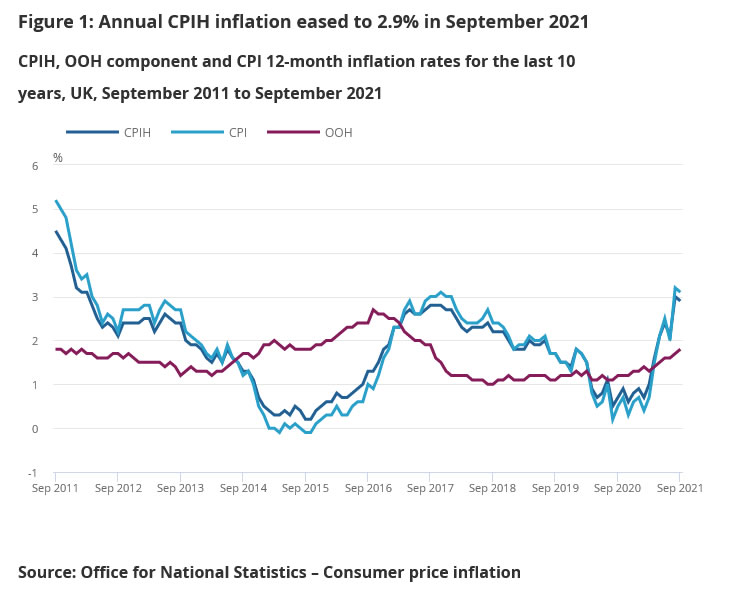
UK CPI slowed to 3.1% in Sep, core CPI dropped to 2.9% yoy
UK CPI slowed to 3.1% yoy in September, down from 3.2% yoy, below expectation of 3.2% yoy. Core CPI also dropped to 2.9% yoy, down from 3.1% yoy, below expectation of 2.9% yoy. RPI, on the other hand rose to 4.9% yoy, up from 4.8% yoy, above expectation of 4.7% yoy.
Also released, PPI input came in at 0.4% mom, 11.4% yoy, versus expectation of 0.8% mom, 11.6% yoy. PPI output was at 0.5% mom, 6.7% yoy, versus expectation of 0.9% mom, 6.8% yoy. PPI output core was at 0.5% mom, 5.9% yoy, versus expectation of 0.9% mom, 5.8% yoy.
XAUUSD Is Possibly Bullish
Technical analysis
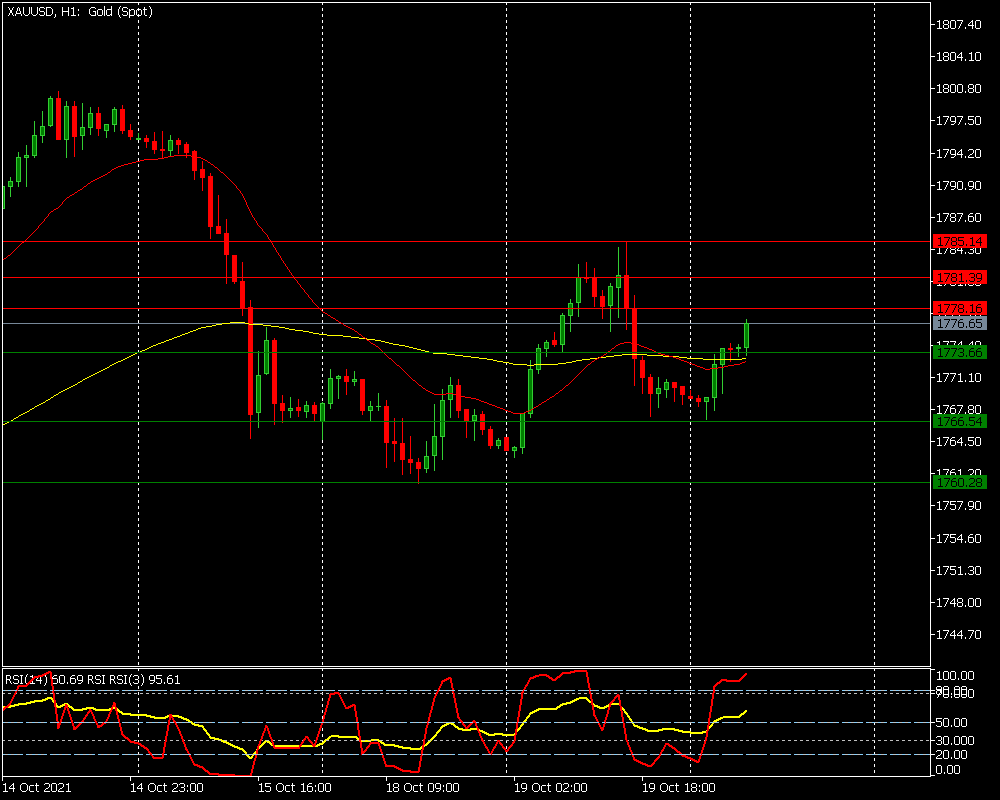
The RSI(14) and the RSI(3) both suggest an upwards movement.
The price is above EMA(120) and EMA(24) which is advantageous for bulls
Most likely scenario - BUY
Target prices: 1,778.16 1,781.39 1,785.14
Alternative scenario - SELL
Target prices: 1,773.66 1,766.54 1,760.28
Key levels
Support 1,773.66 1,766.54 1,760.28
Resistance 1,778.16 1,781.39 1,785.14
GBPUSD Holds Steady Ahead Of UK Inflation Data
The AUDUSD pair soared to the highest level in more than two months as economists cast doubt on the Reserve Bank of Australia (RBA) rate hike target. The minutes of the October meeting showed that officials believe that the bank will hike interest rates in 2024. However, most analysts believe that the bank will move earlier than that. Besides, the unemployment rate is expected to retreat as the country reopens while inflation is rising. The prices of most items, especially energy, have risen in the past few weeks. Also, home prices have soared to a record high and there are concerns that a prolonged period of low rates will lead to a bubble.
The GBPUSD pair held steady in early trading as investors waited for the latest UK consumer inflation data that will come in the morning session. Analysts expect the data will show that the headline consumer price index (CPI) rose from 3.2% in August to 3.4% in September. Similarly, the core CPI is expected to have eased slightly from 3.1% to 3.0%. Still, in the near term, the UK inflation will keep rising as the country goes through its worst energy crisis in years The country is also going through major supply chain disruptions that have led to higher prices.
The USDCAD price is hovering near its lowest level since July as investors react to the rising oil prices. The price of crude oil has risen to more than $84 and there is a likelihood that the trend will continue. Higher oil prices tend to support the Canadian dollar due to the volume that the country exports. At the same time, the pair is falling ahead of the latest Canadian inflation data that will come out in the afternoon. Analysts expect the data to show that Canadian inflation rose from 4.1% in August to 4.3% in September.
USDCAD
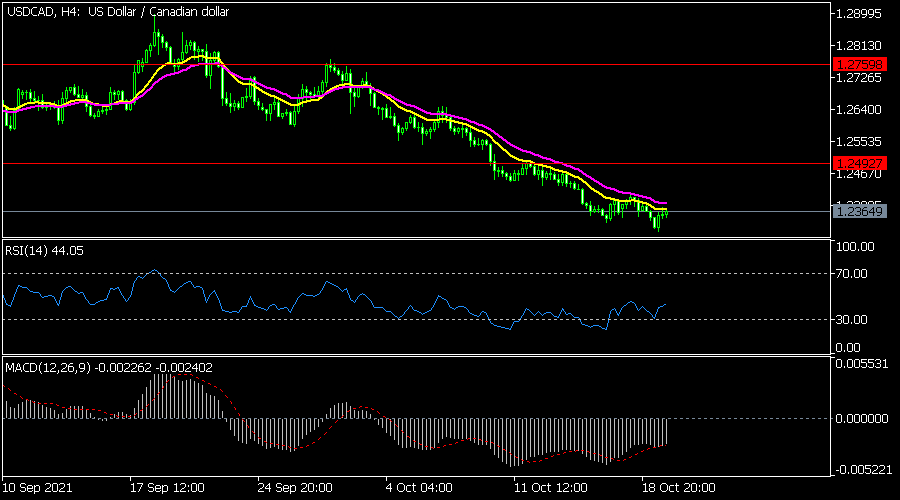
The USDCAD pair declined to a low of 1.2300 in the overnight session. The pair is now trading at 1.2365. On the four-hour chart, the pair is still substantially below the 25-day and 50-day moving averages. The MACD has also moved below the neutral level while the price is substantially below the key resistance level at 1.2492. Therefore, the pair will likely continue dropping as bears target the key support at 1.2400.
EURUSD
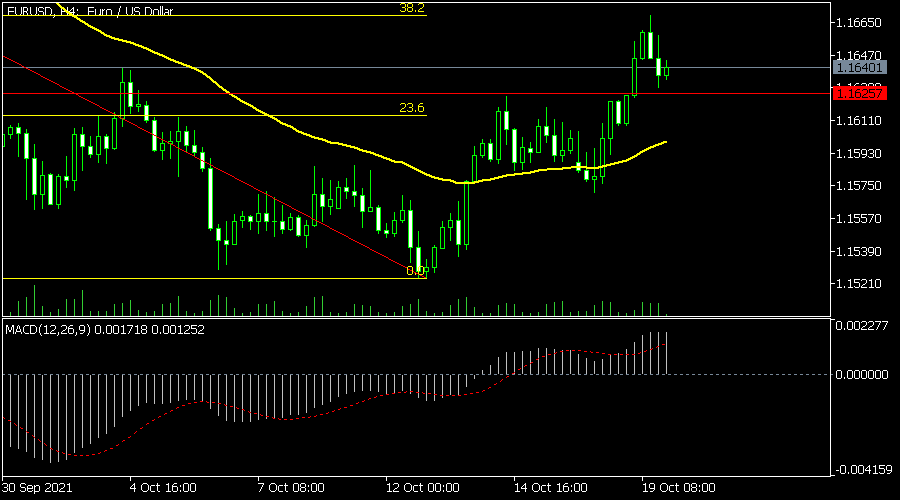
The EURUSD pair made a small pullback overnight. It is trading at 1.1640, which is slightly below this week’s high of 1.1670. This price was along with the 38.2% Fibonacci retracement level. It has also moved above the 25-day moving average and the support at 1.1625. The MACD is comfortably above the neutral level. Therefore, the pair will likely continue rising as bulls target the 50% retracement at 1.1720.
GBPUSD
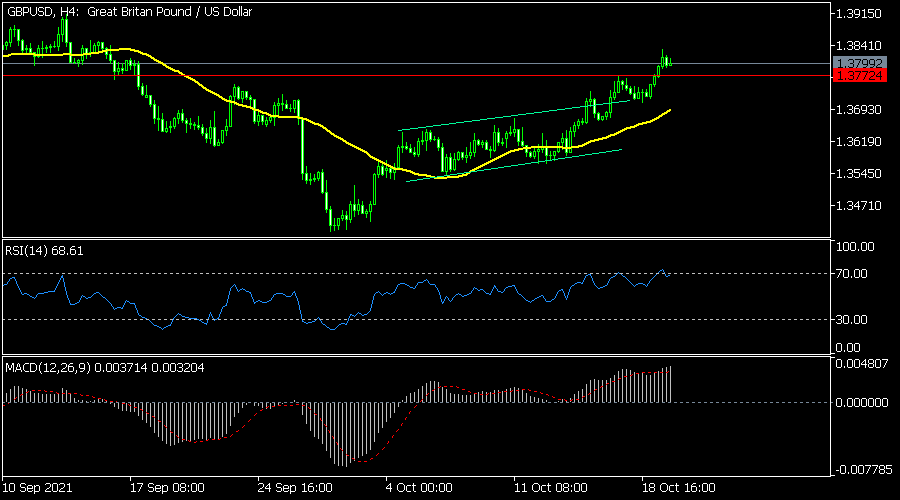
The GBPUSD held steady as traders wait for the upcoming UK inflation data. The pair is trading at 1.3800, which is a few points below this week’s high of 1.3837. The pair is being supported by the short and long-term moving averages while the Relative Strength Index (RSI) and MACD have been rising. Therefore, the pair will likely keep rising as bulls target the key resistance at 1.3950.
AUD/USD Daily Report
Daily Pivots: (S1) 0.7427; (P) 0.7456; (R1) 0.7505; More....
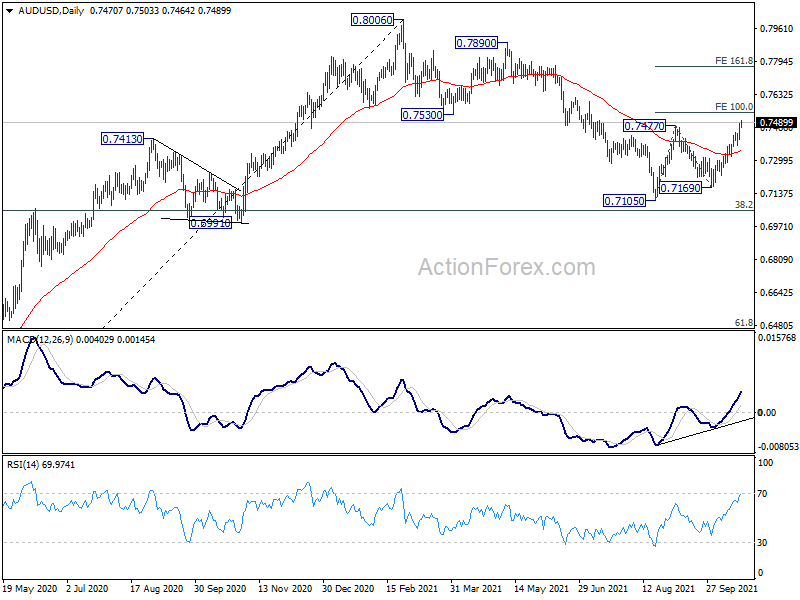
AUD/USD rises to as high as 0.7503 so far today and intraday bias remains on the upside. Break of 0.7477 resistance indicates resumption of the rebound form 0.7105. Current development also suggest that larger decline from 0.8006 has completed. Next target is 100% projection of 0.7105 to 0.7477 from 0.7169 at 0.7541, and then 161.8% projection at 0.7771. On the downside, break of 0.7377 minor support will turn intraday bias neutral first.
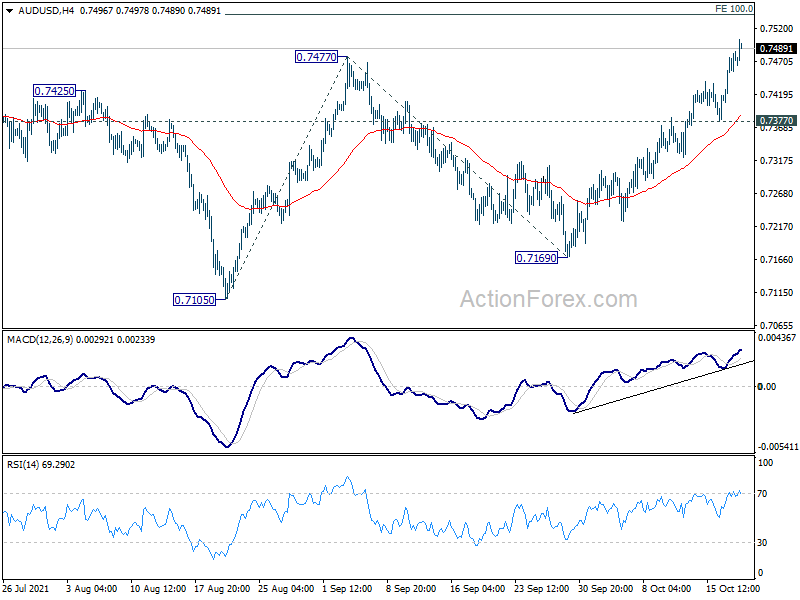
In the bigger picture, with 0.6991 cluster support (38.2% retracement of 0.5506 to 0.8006 at 0.7051) intact, we're seeing price action from 0.8006 as a correction only. That is, up trend from 0.5506 low would resume after the correction completes. In that case, main focus will be 0.8135 key resistance (2018 high). Sustained break there will carry larger bullish implications. However, sustained break of 0.6991 will argue that the whole medium term trend has indeed reversed.