Sample Category Title
EUR/USD Mid-Day Outlook
Daily Pivots: (S1) 1.1605; (P) 1.1637; (R1) 1.1665; More...
With 1.1571 minor support intact, further rise is expected in EUR/USD. Sustained break of 55 day EMA (now at 1.1707) will be a sign that larger correction from 1.2348 has completed. Stronger rally would be seen to 1.1908 resistance for confirmation. On the downside, though, break of 1.1571 minor support will turn bias back to the downside for 1.1523 support instead.
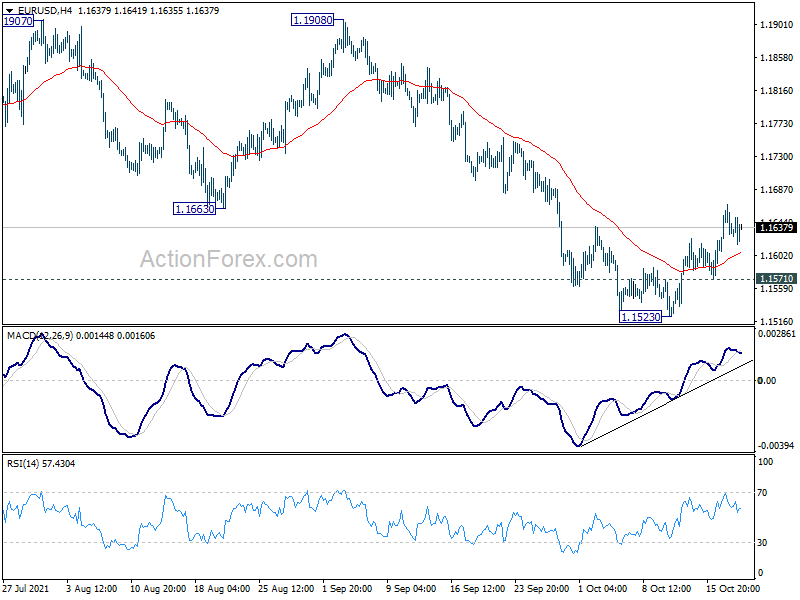
In the bigger picture, price actions from 1.2348 should at least be a correction to rise from 1.0635 (2020 low). As long as 1.1908 resistance holds, deeper fall would be seen to 61.8% retracement of 1.0635 to 1.2348 at 1.1289. Nevertheless break of 1.1908 resistance will revive medium term bullishness and turn focus back to 1.2348 high.
GBP/USD Mid-Day Outlook
Daily Pivots: (S1) 1.3733; (P) 1.3783; (R1) 1.3842; More...
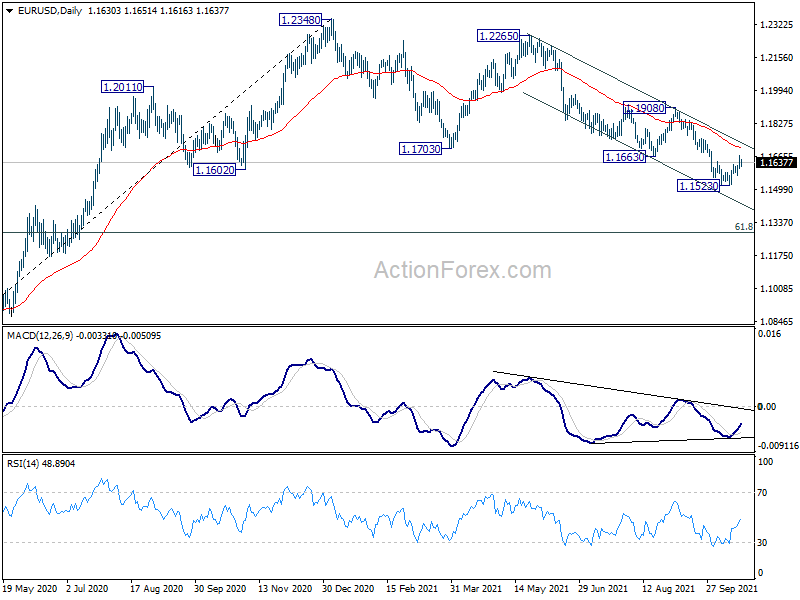
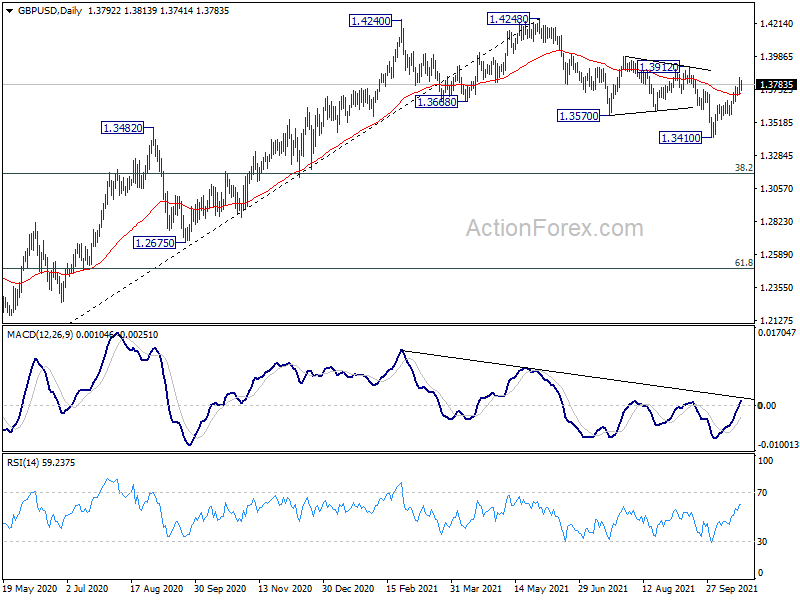
A temporary top is formed at 1.3833 in GBP/USD with current retreat and intraday bias is turned neutral first. Some consolidations could be seen. But further rise is in favor as long as 1.3646 support holds. Above 1.3833 will resume the rebound from 1.3410 to 1.3912 key structural resistance. Firm break there will indicate that the correction from 1.4248 is complete with three waves down to 1.3410. Further rally would then be seen to retest 1.4248 high. However, break of 1.3646 will turn bias to the downside for retesting 1.3410 low.
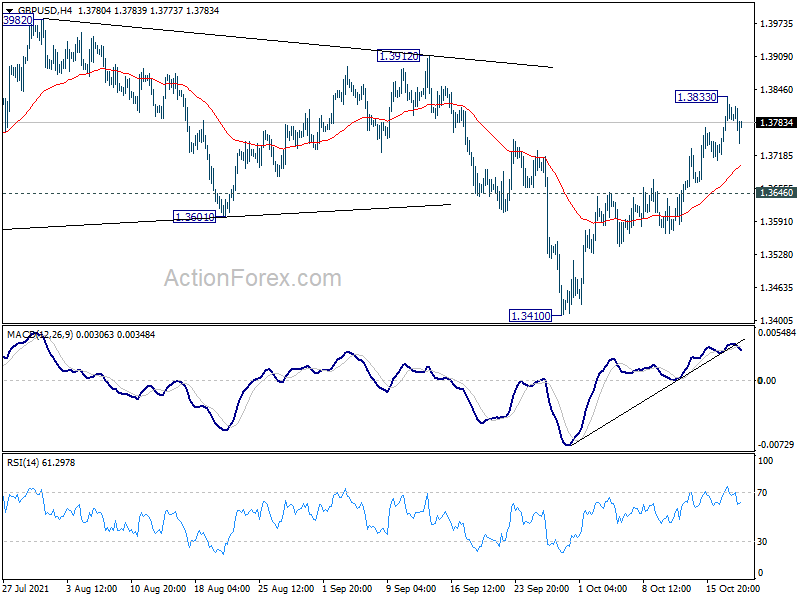
In the bigger picture, the structure of the fall from 1.4248 suggests that it's a correction to the up trend from 1.1409 (2020 low) only. While deeper fall cannot be ruled out yet, downside should be contained by 38.2% retracement of 1.1409 to 1.4248 at 1.3164, at least on first attempt, to bring rebound. On the upside, firm break of 1.4376 key resistance (2018 high) will add to the case of long term bullish reversal. However, sustained trading below 1.3164 will revive some medium term bearishness and target 61.8% retracement at 1.2493.
Sterling Retreats after CPI, Euro and Swiss Franc Lower Too
European majors turn generally softer today, in particular, with Sterling paring some gains after strong but lower than expected consumer inflation data. Dollar also weakens with treasury yield dipping slightly while Yen is trying to recover. But overall, Kiwi and Aussie maintain their position as the best performer. US futures are pointing to a flat open but buyers could jump in again later in the day. Development in the stock markets should continue to lead currencies.
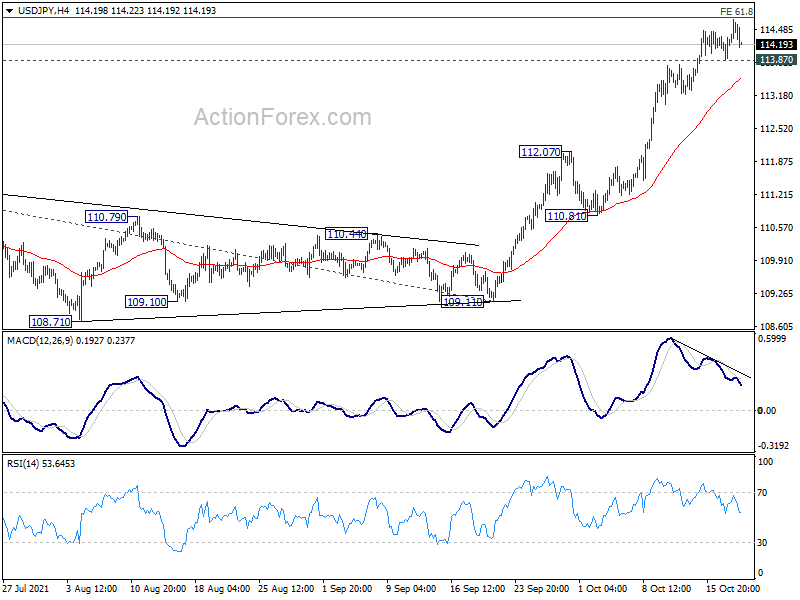
Technically, USD/JPY continues to lose upside momentum just ahead of 114.71 fibonacci projection level. Break of 113.87 minor support should indicate short term topping and bring deeper pull back to 4 hour 55 EMA (now at 113.49) and below. If that happens, we'll see if EUR/JPY and GBP/JPY would break 132.13 and 156.58 support levels together. Together, they would signal that Yen crosses are generally turning into near term consolidations after recent strong rallies.
In Europe, at the time of writing, FTSE is down -0.07%. DAX is down -0.11%. CAC is down -0.01%. Germany 10-year yield is down -0.0205 at -0.123. Earlier in Asia, Nikkei rose 0.14%. Hong Kong HSI rose 1.35%. China Shanghai SSE dropped -0.17%. Singapore Strait Times dropped -0.03%. Japan 10-year JGB yield rose 0.0048 to 0.095.
Canada CPI rose to 4.4% yoy in Sep, highest since 2003
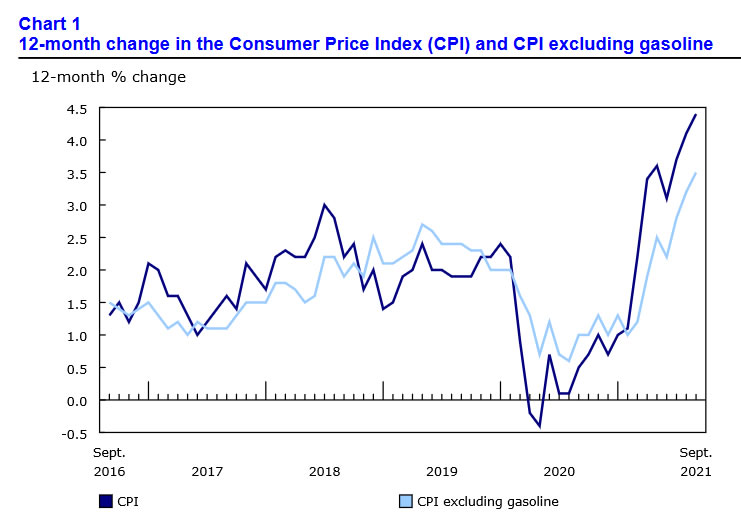
Canada CPI accelerated to 4.4% yoy in September, up from August's 4.1% yoy, above expectation of 4.3% yoy. That's the fastest pace since 2003. Excluding gasoline CPI rose 0.3% yoy.
CPI common was unchanged at 1.8% yoy, below expectation of 1.9% yoy. CPI median rose to 2.8% yoy, up from 2.6% yoy, above expectation of 2.6% yoy. CPI trimmed rose to 3.4% yoy, up from 3.3% yoy, above expectation of 3.3% yoy.
Bundesbank Weidmann: It's crucial not to lose sign of prospective inflationary dangers
Bundesbank President Jens Weidmann warned, "it will be crucial not to look one-sidedly at deflationary risks, but not to lose sight of prospective inflationary dangers either." The comment came as Weidmann announced he's stepping down from the post on December 31, as "more than 10 years is a good measure of time to turn over a new leaf – for the Bundesbank, but also for me personally."
ECB President Christine Lagarde said in statement, "I respect Jens Weidmann`s decision to step down from his position as President of Deutsche Bundesbank at the end of this year after more than 10 years of service, but I also immensely regret it."
Eurozone CPI finalized at 3.4% yoy in Sep, EU at 3.6% yoy
Eurozone CPI was finalized at 3.4% yoy in September, up from August's 3.0% yoy. The highest contribution to the annual euro area inflation rate came from energy (+1.63 percentage points, pp), followed by services (+0.72 pp), non-energy industrial goods (+0.57 pp) and food, alcohol & tobacco (+0.44 pp).
EU CPI was finalized at 3.6% yoy, up from August's 3.2% yoy. The lowest annual rates were registered in Malta (0.7%), Portugal (1.3%) and Greece (1.9%). The highest annual rates were recorded in Estonia, Lithuania (both 6.4%) and Poland (5.6%). Compared with August, annual inflation fell in one Member State, remained stable in one and rose in twenty-five.
Also released, Eurozone current account surplus came in at EUR 13.4B, versus expectation of EUR 24.3B. Germany PPI was at 2.3% mom, 14.2% yoy in September, versus expectation of 1.0% mom, 12.7% yoy.
UK CPI slowed to 3.1% in Sep, core CPI dropped to 2.9% yoy
UK CPI slowed to 3.1% yoy in September, down from 3.2% yoy, below expectation of 3.2% yoy. Core CPI also dropped to 2.9% yoy, down from 3.1% yoy, below expectation of 2.9% yoy. RPI, on the other hand rose to 4.9% yoy, up from 4.8% yoy, above expectation of 4.7% yoy.
Also released, PPI input came in at 0.4% mom, 11.4% yoy, versus expectation of 0.8% mom, 11.6% yoy. PPI output was at 0.5% mom, 6.7% yoy, versus expectation of 0.9% mom, 6.8% yoy. PPI output core was at 0.5% mom, 5.9% yoy, versus expectation of 0.9% mom, 5.8% yoy.
Australia Westpac leading index turned negative, but rebound expected ahead
Australia Westpac-MI Leading Index dropped from 0.5% to -0.5% in September. That's the first negative reading since September 2020, which was the followed by strong surge after the economy moved out of lockdown. Westpac expects another strong rebound in the economy ahead as both Sydney and Melbourne are reopening this time too. It also expects the Australia economy to growth by 1.6% in Q4, building towards a 5.6% growth in H2 of 2022.
Westpac expects RBA to maintain current policy setting at the November 2 meeting, followed by tapering in February. The most important aspect of the November meeting will be whether RBA has lifted its inflation forecasts.
Japan exports rose 13% yoy in Sep, imports rose 38.6% yoy
Japan's exports rose 13.0% yoy to JPY 6481B in September, above expectation of 11.0% yoy. Imports rose 38.6% yoy to JPY 7464B, above expectation of 34.4% yoy. Trade balance reported JPY -623B deficit, versus expectation of JPY -519B.
The weakening in exports could be partly attributed to the -40.3% yoy decline in car shipments, first in seven months. But the situation is expected to improve as supply bottlenecks are solved. Shipment to China grew 10.3% yoy, led by semiconductors and plastic materials. Shipment to the US dropped -3.3% yoy, on cars and airplanes.
In seasonally adjusted terms, exports dropped -3.9% mom to JPY 6750B. Imports rose 0.2% mom to JPY 7375B. Trade deficit came in at JPY -625B.
GBP/USD Mid-Day Outlook
Daily Pivots: (S1) 1.3733; (P) 1.3783; (R1) 1.3842; More...
A temporary top is formed at 1.3833 in GBP/USD with current retreat and intraday bias is turned neutral first. Some consolidations could be seen. But further rise is in favor as long as 1.3646 support holds. Above 1.3833 will resume the rebound from 1.3410 to 1.3912 key structural resistance. Firm break there will indicate that the correction from 1.4248 is complete with three waves down to 1.3410. Further rally would then be seen to retest 1.4248 high. However, break of 1.3646 will turn bias to the downside for retesting 1.3410 low.
In the bigger picture, the structure of the fall from 1.4248 suggests that it's a correction to the up trend from 1.1409 (2020 low) only. While deeper fall cannot be ruled out yet, downside should be contained by 38.2% retracement of 1.1409 to 1.4248 at 1.3164, at least on first attempt, to bring rebound. On the upside, firm break of 1.4376 key resistance (2018 high) will add to the case of long term bullish reversal. However, sustained trading below 1.3164 will revive some medium term bearishness and target 61.8% retracement at 1.2493.
Economic Indicators Update
| GMT | Ccy | Events | Actual | Forecast | Previous | Revised |
|---|---|---|---|---|---|---|
| 23:30 | AUD | Westpac Leading Index M/M Sep | 0.00% | -0.30% | ||
| 23:50 | JPY | Trade Balance (JPY) Sep | -0.62T | -0.53T | -0.27T | -0.34T |
| 06:00 | EUR | Germany PPI M/M Sep | 2.30% | 1.00% | 1.50% | |
| 06:00 | EUR | Germany PPI Y/Y Sep | 14.20% | 12.70% | 12.00% | |
| 06:00 | GBP | CPI M/M Sep | 0.30% | 0.40% | 0.70% | |
| 06:00 | GBP | CPI Y/Y Sep | 3.10% | 3.20% | 3.20% | |
| 06:00 | GBP | Core CPI Y/Y Sep | 2.90% | 3.10% | 3.10% | |
| 06:00 | GBP | RPI M/M Sep | 0.40% | 0.20% | 0.60% | |
| 06:00 | GBP | RPI Y/Y Sep | 4.90% | 4.70% | 4.80% | |
| 06:00 | GBP | PPI Input M/M Sep | 0.40% | 0.80% | 0.40% | 0.50% |
| 06:00 | GBP | PPI Input Y/Y Sep | 11.40% | 11.60% | 11.00% | 11.20% |
| 06:00 | GBP | PPI Output M/M Sep | 0.50% | 0.90% | 0.70% | |
| 06:00 | GBP | PPI Output Y/Y Sep | 6.70% | 6.80% | 5.90% | 6.00% |
| 06:00 | GBP | PPI Core Output M/M Sep | 0.50% | 0.90% | 1.00% | 0.90% |
| 06:00 | GBP | PPI Core Output Y/Y Sep | 5.90% | 5.80% | 5.30% | 5.40% |
| 08:00 | EUR | Eurozone Current Account (EUR) Aug | 13.4B | 24.3B | 21.6B | |
| 09:00 | EUR | Eurozone CPI Y/Y Sep F | 3.40% | 3.40% | 3.40% | |
| 09:00 | EUR | Eurozone CPI Core Y/Y Sep F | 1.90% | 1.90% | 1.90% | |
| 12:30 | CAD | CPI M/M Sep | 0.20% | 0.10% | 0.20% | |
| 12:30 | CAD | CPI Y/Y Sep | 4.40% | 4.30% | 4.10% | |
| 12:30 | CAD | CPI Common Y/Y Sep | 1.80% | 1.90% | 1.80% | |
| 12:30 | CAD | CPI Median Y/Y Sep | 2.80% | 2.60% | 2.60% | |
| 12:30 | CAD | CPI Trimmed Y/Y Sep | 3.40% | 3.30% | 3.30% | |
| 14:30 | USD | Crude Oil Inventories | 2.1M | 6.1M | ||
| 18:00 | USD | Fed's Beige Book |
Canada CPI rose to 4.4% yoy in Sep, highest since 2003
Canada CPI accelerated to 4.4% yoy in September, up from August's 4.1% yoy, above expectation of 4.3% yoy. That's the fastest pace since 2003. Excluding gasoline CPI rose 0.3% yoy.
CPI common was unchanged at 1.8% yoy, below expectation of 1.9% yoy. CPI median rose to 2.8% yoy, up from 2.6% yoy, above expectation of 2.6% yoy. CPI trimmed rose to 3.4% yoy, up from 3.3% yoy, above expectation of 3.3% yoy.
Will Canadian CPI Shake Up Loonie?
The Canadian dollar has had an uneventful week, but that could change later in the day, as Canada releases CPI data for September.
CPI expected to accelerate
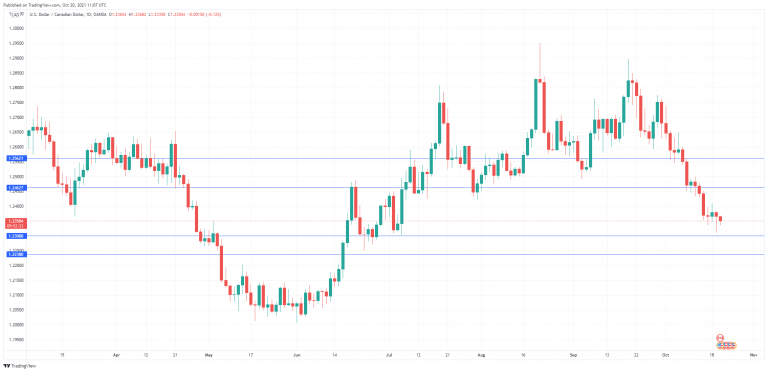
Things are looking rosy for the Canadian dollar. It’s been an outstanding October, with the currency gaining 2.57%.On Tuesday, USD/CAD dropped to 1.2311, its lowest level since July 6th. Oil prices have been booming, which has lifted the commodity-based currency, and stronger risk sentiment has also supported the upswing.
Inflation has surged as the economy emerges from the Covid pandemic and manufacturers struggle to keep up with pent-up demand. CPI for September is expected to increase to 4.3% from 4.1% (YoY), which would be the highest level of inflation since 2003. Core CPI is also projected to rise, from 3.5% to 3.6%.
The markets will be keeping a close eye on today’s inflation release. If the data shows that inflation is accelerating, the Bank of Canada could respond by scaling back its bond purchase programme. This would make next week’s policy meeting most interesting, as policy makers may provide details of an exit strategy, ahead of a possible rate hike in 2022.
The US dollar received a lift overnight, as the 30-year yield rose higher. The dollar index tested support at 93.50, but has clawed higher and is at 93.82 in Europe. If US Treasuries continue to rise, I would expect the dollar to respond with gains. A Federal Reserve tapering appears imminent, and several Fed officials sounded hawkish about a taper in remarks on Tuesday. The Federal Reserve has insisted that a taper is not linked to an interest rate hike, and even with the surge in inflation, a rate hike does not seem likely before 2023.
.
USD/CAD Technical
- There are support lines at the round number of 1.2300 and 1.2238
- There is resistance at 1.2462, followed by 1.2562
Could Eurozone Flash PMIs Hinder Euro’s Bullish Breakout?
As supply crunches hit global economies and inflation perks up, investors will look for any red economic signals in the Eurozone when flash Markit PMI figures for October come out on Friday at 08:00 GMT. The data are expected to provide a bitter taste on the matter, reflecting a fading economic recovery for another month, with the euro likely facing fresh headwinds against its recent bullish attempts.
Euro aims for weekly gains, but fundamentals are discouraging
The latest rebound in global bond yields knocked down the safe-haven Japanese yen, allowing the euro to mark its longest rally against the currency in many years after four months of declines.
Progress has also been made against the US dollar over the past two weeks after the plunge to a 15-month low. On this front, however, monetary policy divergence will probably remain a core drawback for the euro as the ECB is not aiming to depart from an ultra-loose policy settings in the foreseeable future unlike the Fed, which is on track to start tapering its massive bond purchase program later this year.
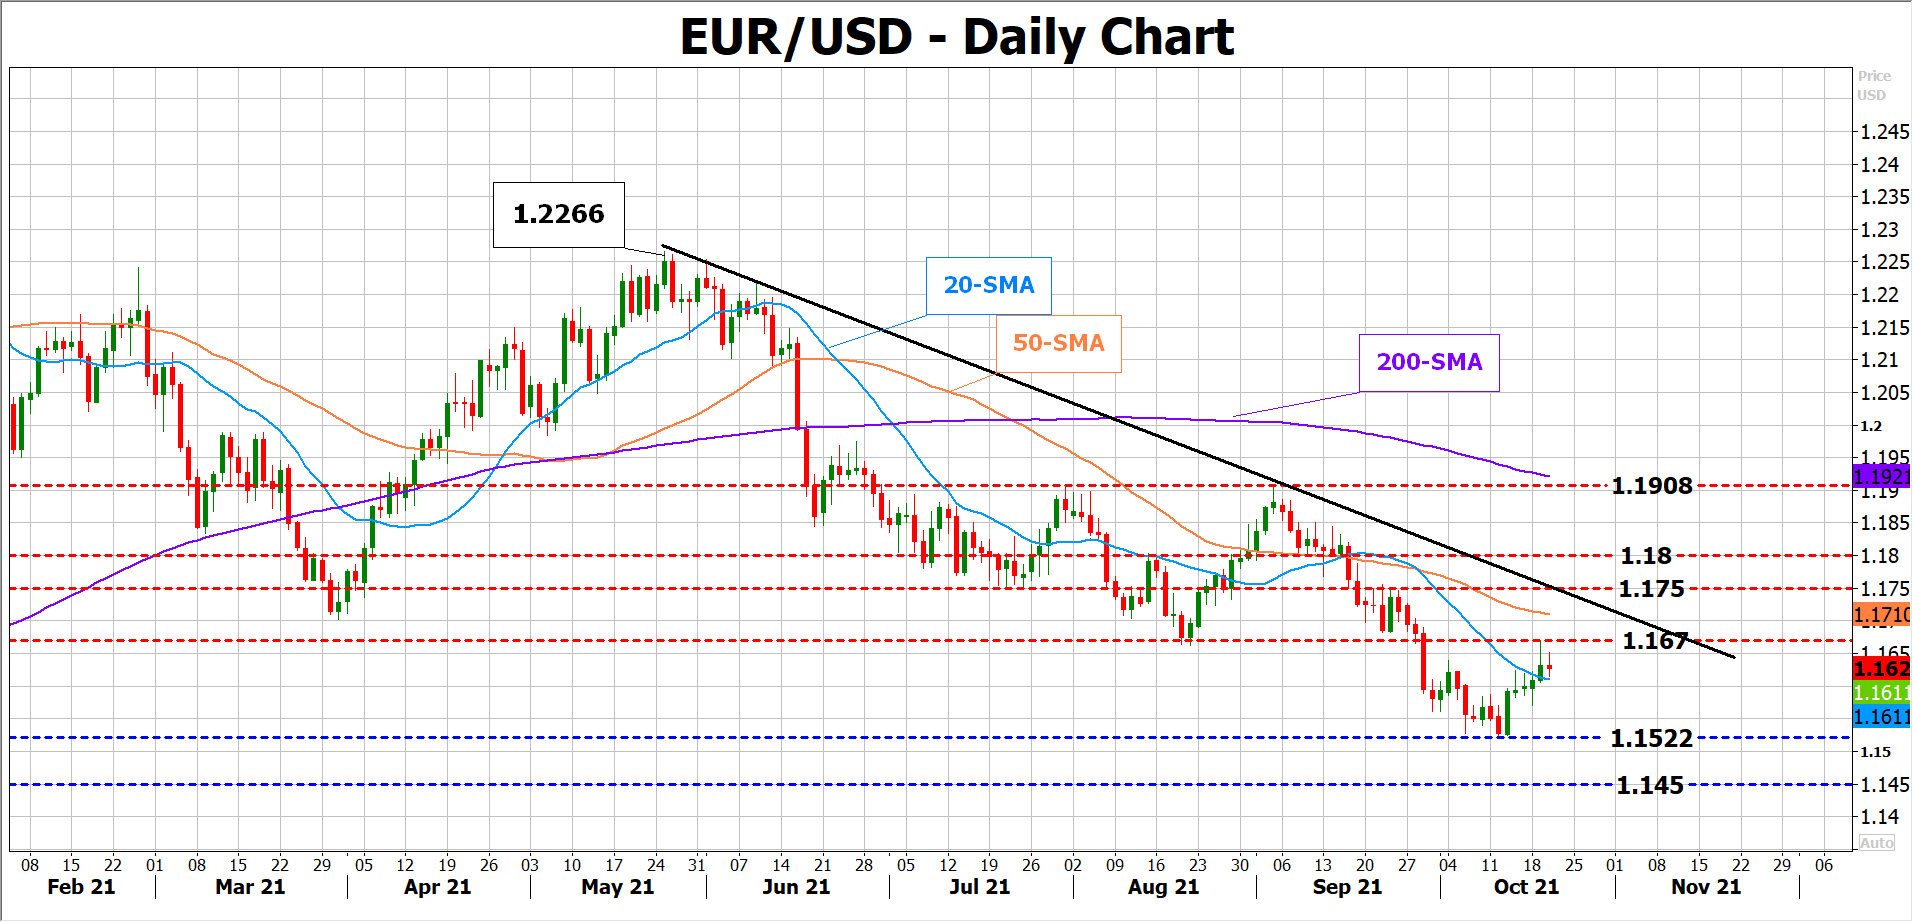
Having now conveniently distanced itself above the 1.1600 level and the 20-day simple moving average (SMA), euro/dollar is poised to meet the 1.1700 level, but the path could become rocky in the week ahead as the Eurozone flash Markit PMI for October will likely remind investors that fundamentals are currently not in favor of the single currency.
Eurozone flash PMI to reflect more pronounced struggles
Particularly, the manufacturing PMI index is expected to keep decelerating for the fourth consecutive month, falling from 58.6 to a seven-month low of 57.0, whilst the services equivalent is also forecast to experience another notable pullback to 55.5 from 56.4 previously. Consequently, the composite PMI index could retreat to 55.2 from 56.2 in September.
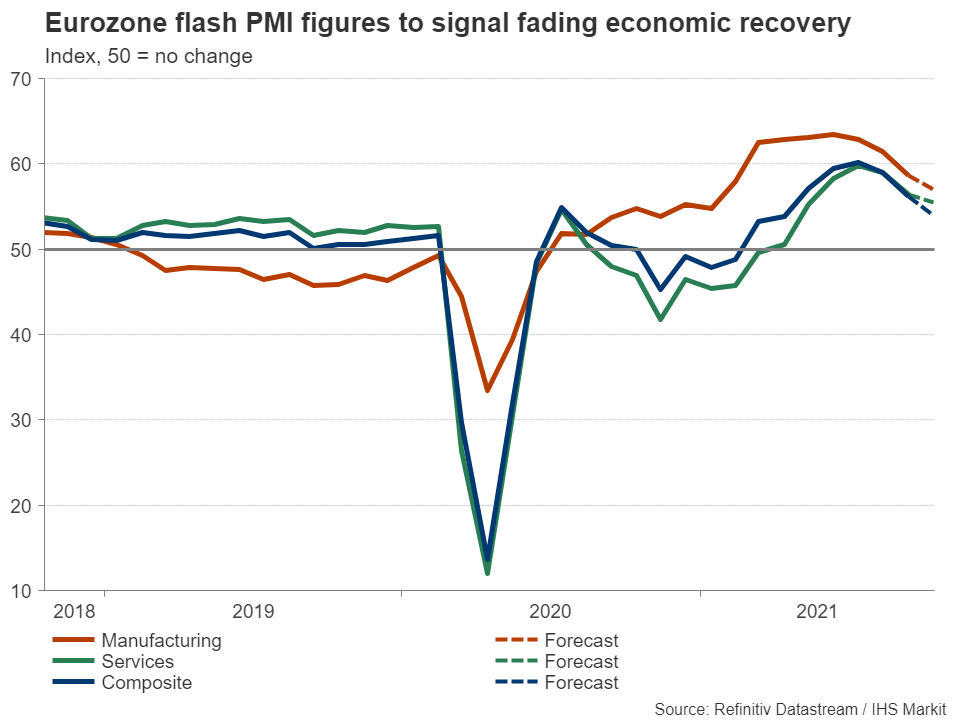
Undoubtedly, any reading above 50, and more importantly above the 2019 - 2020 ugly levels, is a sign of healthy expansion, though a continuous deterioration in PMI stats might lead investors to assume the impressive annual double-digit growth in the past three quarters has matured before the pandemic entirely takes halt.
The business PMI survey will probably reveal more pronounced struggles among companies to source materials and pay for higher energy costs, as well as find qualified workers at a time when demand remains resilient. Unless Eurozone governments hedge the sharp oil and gas price fluctuations through tax cuts or/and subsidies for grappling suppliers, consumers could see their utility bills skyrocketing during the coming winter months.
More industries could join the energy crisis
Perhaps the time for the Eurozone members to show more fiscal unity has arrived once again, but given previous prolonged debates in securing immediate solutions, someone could say this may become a long-term project instead. The problem is the longer inflation pressures persist in energy and utility sectors, the more impact will be felt in other industries and ultimately in the food-processing sectors.
Numerous nitrogen fertilizer plants have already temporarily shut down in Europe in the face of soaring gas prices, with Fertilizers Europe recently sending warnings of permanent closures as the solutions proposed by the European Commission are not enough to address the problem.
The European automaker association, which is being squeezed by the global semiconductor shortage, facing double-digit declines in car registrations during the past few months, has also admitted that supply constraints will linger well into next year.
Euro/dollar
Apparently, attempting to solve inflation and supply imbalances which are beyond national borders, is a hard task to accomplish in a short period. Hence, in a nutshell, business challenges could worsen in the coming months before getting better, causing some negative shockwaves in markets.
As regards the euro, negative surprises in Eurozone PMI data have been common during the past three months. Therefore, investors may not aggressively sell the euro if another miss happens despite the energy chaos intensifying. Nevertheless, if euro/dollar slides back below the 1.1600 mark, the door would open for the 15-month low of 1.1522.
Otherwise, investors could cheer on stronger-than-expected PMI figures, pushing euro/dollar above the nearby 1.1670 resistance and towards the key resistance trendline seen around 1.1750.
EUR/USD Bounces Off 1.1670
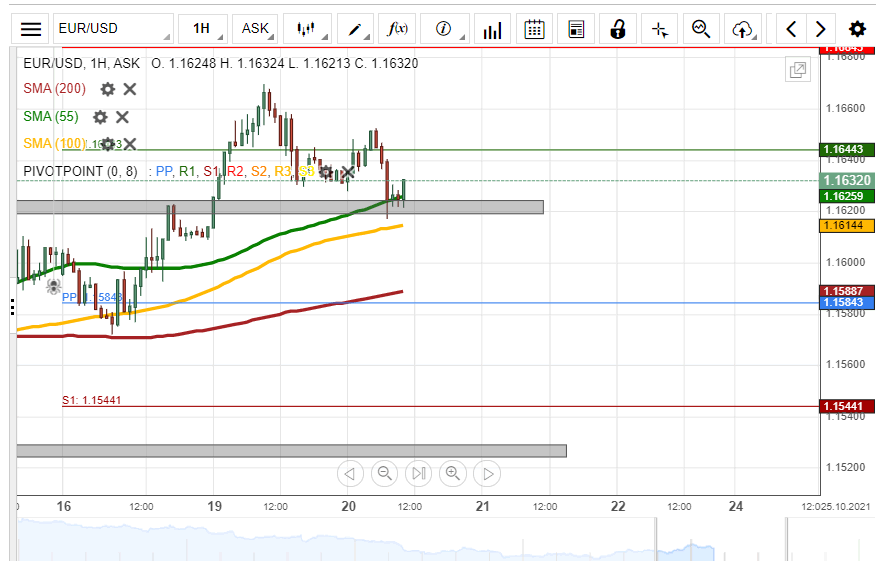
On Tuesday, the EUR/USD failed to surge, as the 1.1670 appeared to have provided the rate with resistance, which caused a decline. By the middle of Wednesday's trading, the pair had reached the last week's high level zone, which provided support.
If the rate passes the support of the 1.1620/1.1625 zone, it could aim at the 1.1600 level before reaching the 200-hour SMA at 1.1588 and the weekly simple pivot point at 1.1584. In addition, take into account that the 1.1620/1.1625 zone is being strengthened by the 55 and 100-hour simple moving averages.
However, a recovery of the EUR/USD might find resistance in the weekly R1 simple pivot point at 1.1644. Above the pivot point, the 1.1670 might once again act as resistance.
GBP/USD Respects Pivot Point
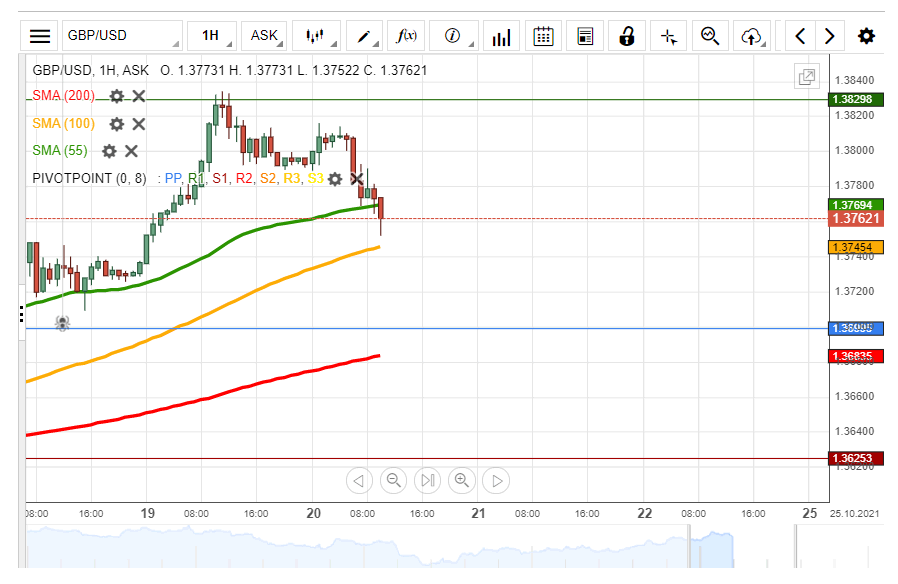
On Tuesday, the GBP/USD surged and reached the resistance of the weekly R1 simple pivot point at the 1.3830 level. The pivot point's resistance held and caused a decline. By the middle of Wednesday's European trading hours, the decline had passed the support of the 55-hour SMA at 1.3769 and was heading to the 1.3750 mark.
In the case that the 1.3750 mark, which could be supported by the 100-hour SMA, holds, the EUR/USD would recover. A potential recovery might find resistance first in the 55-hour SMA at 1.3770. Afterwards, the weekly R1 simple pivot point at 1.3830 might serve as resistance.
On the other hand, a decline below the 1.3750 mark would highly likely result in a decline to the weekly simple pivot point at the 1.3700 mark. Note that the round exchange rate of 1.3700 can provide support and resistance on its own.
USD/JPY Retraces To SMA’S Support
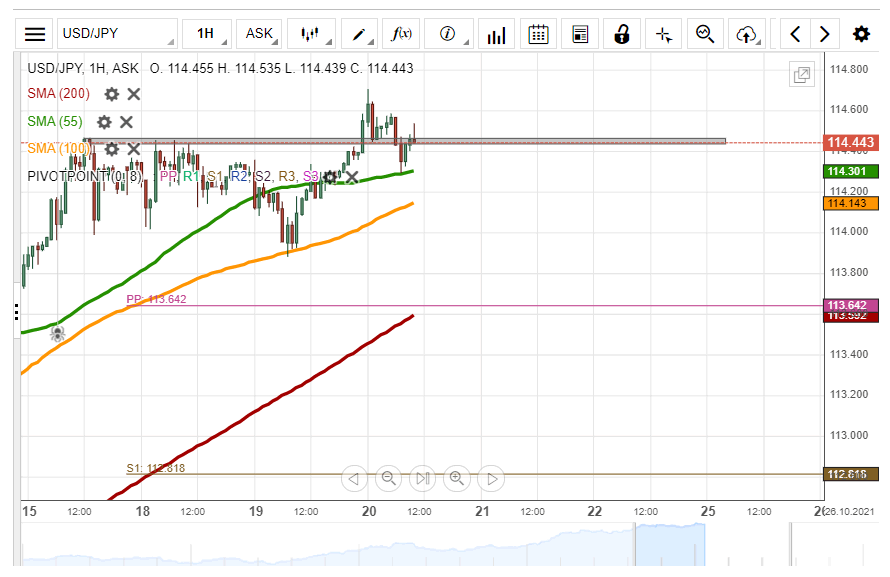
After touching the 114.70 level, the USD/JPY currency exchange rate began a decline. On Wednesday morning, the pair found support in the 55-hour simple moving average near 114.30. The event resulted in an apparent recovery of the USD/JPY, which could once again test the resistance of the 114.70 mark.
If the USD/JPY surges above the 114.70 level, it would most likely encounter resistance at the 115.00 mark. The round exchange rate level is bound to serve as a resistance. Above the 115.00 level, the weekly R1 simple pivot point could stop a surge at 115.11.
Meanwhile, a decline would again look for support in the 55-hour simple moving average near 114.30. Below the 55-hour SMA, the 100-hour SMA might provide additional support.
GOLD Reveals Channel Pattern
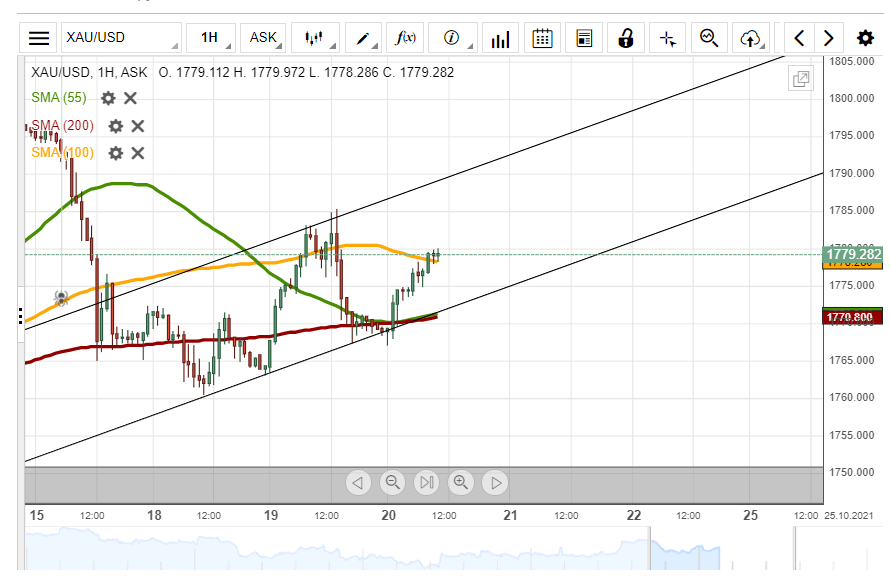
The sharp recovery of the yellow metal's price turned into a sharp decline, as the price touched the 1,785.00 level. The following decline ended at GMT midnight to Wednesday. During these recent moves a channel up pattern was revealed. The pattern can be drawn by connecting the October 18, 19 and 20 low levels and setting the parallel line at the Tuesday's high levels.
Meanwhile, note that it was already revealed on Monday that the bullion's price is ignoring the support and resistance of the 55, 100 and 200-hour simple moving averages despite the SMAs impacting the price throughout history.
On Wednesday. in the near term future, the metal's price was expected to continue to surge in the borders of the channel up pattern. Potential resistance to the price could be provided by the 1,780.00, 1,785.00 and 1,790.00 levels. Above these levels, the pair is more likely going to encounter the resistance line of the channel pattern.
Meanwhile, a decline of the metal could find support in the 1,775.00 mark before reaching the lower trend line of the channel up pattern. In addition, note that the previously ignored 55 and 200-hour simple moving averages were located at the trend line near 1,770.00.