Sample Category Title
Equities In Asia Give Back Early Gains
Chinese markets drop, but Hong Kong climbs
Equities in Asia, except for China, were higher across the board earlier today, but a combination of factors, notably a soft China session, has seen most of those early gains unwound. Overnight, US earnings and recovery package hopes kept the music playing on Wall Street, which shook of higher US yields and posited another positive finish. The S&P 500 rose 0.74%, the Nasdaq climbed by 0.71%, with the Dow Jones finishing 0.57% higher.
Mainland China markets are hovering in negative territory, despite the PBOC adding liquid via the repo today. That hasn’t stopped the yuan rallying to five-month highs versus the US dollar, or 5½ year highs on a trade-weighted basis, weighing on exporters. But most importantly, China state media said this morning that expectations for a RRR cut in Q4 have fallen. That is not my base case, but it appears to have been enough to take the wind from the sails of local markets. The Shanghai Composite is 0.25% lower, while the CSI 300 is down 0.20%. None of this has affected Hong Kong though, with the Hang Seng leaping 1.45% higher today. The rally has been led by a 7.0% rise in Ali Baba shares after it was announced Jack Ma had been allowed to travel to Europe, raising hopes the tech clampdown was easing.
In Japan, the eruption of Mt Aso has tempered earlier gains, leaving the Nikkei 225 up just 0.15% now. In South Korea, the Kospi has moved back to unchanged. Singapore and Taipei are up just 0.10% now with Kuala Lumpur falling 0.15% while Bangkok is 0.30% higher. Indonesia is closed today. Australian markets, though, continue to hold their early gains with both the ASX 200 and All Ordinaries content to follow New York 0.70% higher today.
European equity markets will take their cue from New York as usual given the lack of Eurozone data today. That should mean a positive start to trading. US earnings will continue to drive sentiment globally ex-China, and as long as they remain upbeat, so should equity markets this week.
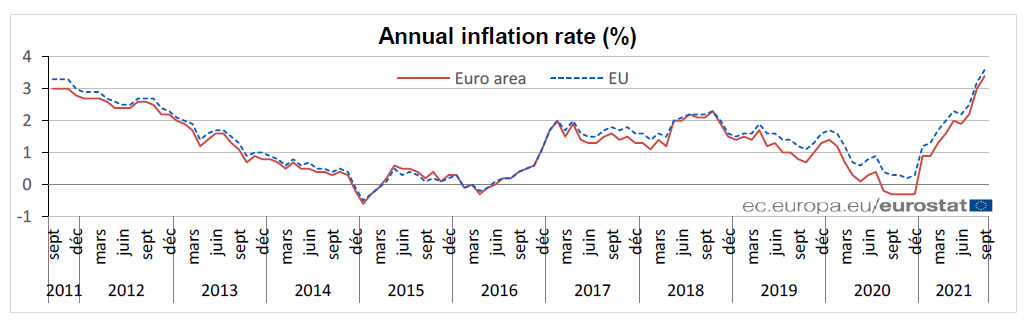
Eurozone CPI finalized at 3.4% yoy in Sep, EU at 3.6% yoy
Eurozone CPI was finalized at 3.4% yoy in September, up from August's 3.0% yoy. The highest contribution to the annual euro area inflation rate came from energy (+1.63 percentage points, pp), followed by services (+0.72 pp), non-energy industrial goods (+0.57 pp) and food, alcohol & tobacco (+0.44 pp).
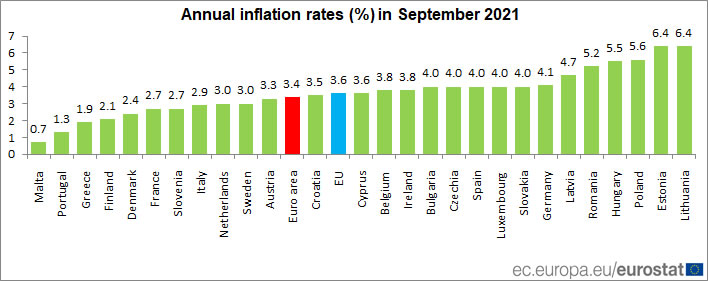
EU CPI was finalized at 3.6% yoy, up from August's 3.2% yoy. The lowest annual rates were registered in Malta (0.7%), Portugal (1.3%) and Greece (1.9%). The highest annual rates were recorded in Estonia, Lithuania (both 6.4%) and Poland (5.6%). Compared with August, annual inflation fell in one Member State, remained stable in one and rose in twenty-five.
USDJPY Advances Stumble At Near 4-Year Highs
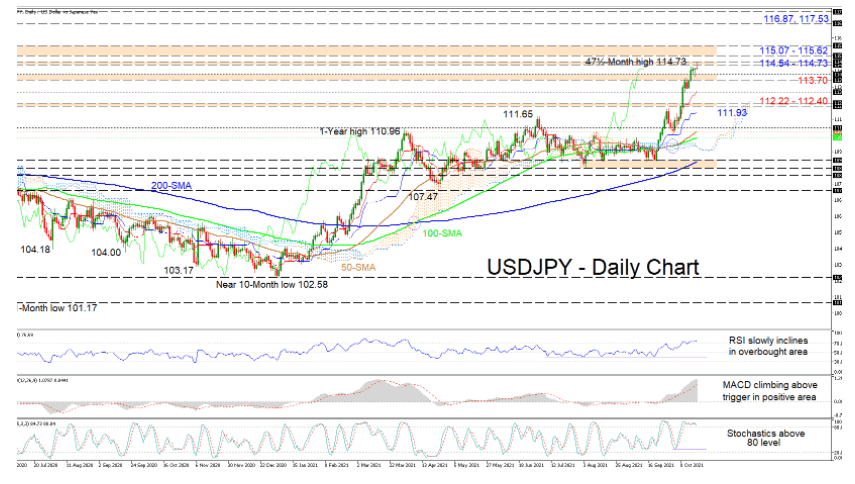
USDJPY’s one-month rally off 109.19 may be running out of steam in the vicinity of the resistance band of 114.54-114.73, formed between the October 2018 and November 2017 rally peaks. Nonetheless, the climbing simple moving averages (SMAs) are endorsing the bullish picture.
The Ichimoku lines are indicating that positive momentum is growing, while the short-term oscillators are still leaning towards the upside. The MACD, deep in the positive region, is persisting above its red trigger line, while the RSI, which is in overbought territory, is demonstrating a tendency to push higher. Currently, the stochastic lines are tangled above the 80 overbought level, not providing a clear price preference.
In the positive scenario, an immediate obstacle impeding the extension of the one-month rally is the 114.54-114.73 barrier. However, if buyers successfully overstep this slender resistance, upside limitations could arise from the neighbouring boundary of 115.07-115.62, involving multiple highs from mid-January to mid-March of 2017. Should bullish impetus intensify, the price may then propel for the 116.87 and 117.53 highs, identified in January of 2017.
Alternatively, if price gains become capped ahead of the 115.00 handle, preliminary support could develop around the 113.70 - 114.00 region. Dropping below this, upside defences could stem from the 113.00 hurdle, and the 112.22-112.40 boundary, moulded between the highs from April 2019 and February 2020. From here, a deeper price retracement could get snagged around the blue Kijun-sen line at 111.93 before challenging the zone of support between the 111.00 level and the 100-day SMA at 110.46.
Summarizing, USDJPY is sustaining a bullish tone above the 113.00 barrier and the SMAs. For positive forces to flourish, the price would need to pilot past the 115.62 threshold, while a drop beneath the 113.00 handle could start to feed negative price movements.
GBP/USD Pair Is Correcting Lower From The 1.3838 High
The British Pound started a fresh increase from the 1.3500 zone against the US Dollar. The GBP/USD pair broke the 1.3600 resistance level to move into a positive zone.
The pair even cleared the 1.3750 resistance and the 50 hourly simple moving average. The pair traded as high as 1.3838 and it is now correcting lower. An initial support on the downside is near the 1.3780 level.
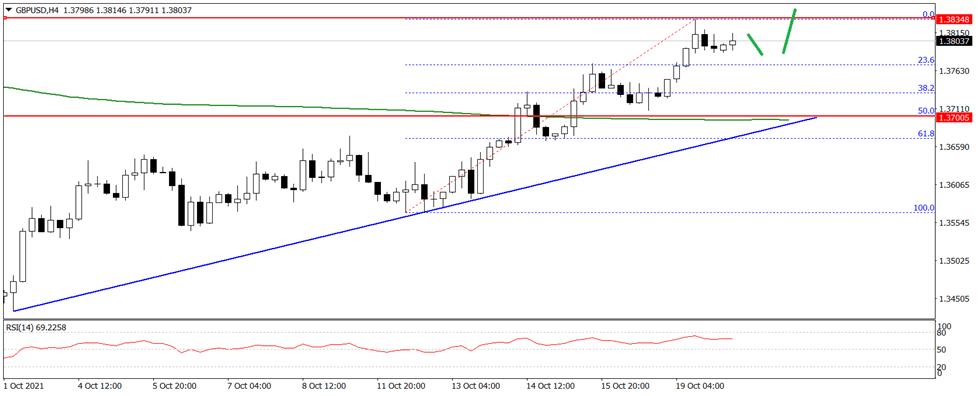
The main support is forming near the 1.3720 level. There is also a major bullish trend line forming with support at 1.3720 on the hourly chart. A break below the 1.3720 support level could even push the pair below the 1.3650 support.
An initial resistance on the upside is near the 1.3820 on FXOpen. The main resistance is now forming near the 1.3840 level. If there is a clear break above the 1.3820 and 1.384 resistance levels, the pair could climb higher towards 1.3900 or even 1.3920.
China Holds Loan Prime Rates
China held its one and five-year Loan Prime Rates steady for the 18th month in a row this morning in a completely expected outcome. Easing from the PBOC is more likely to come in the form of more MLF’s or via a RRR cut for mainland banks. Far more attention is being focused on the commodity and property space instead. China threatened to intervene in onshore coal markets yesterday to cap prices which sent mainland coal futures plummeting by a limit-down 10%. Hong Kong coal futures have dived by 8.50% so far today. Oil prices have reacted only modestly though, and like its threats in other commodity spaces, as a price taker and importer, its rhetoric is likely to only have a passing effect.
Evergrande deadlines loom
Evergrande and the China property developer sector have fallen off the radar in the past week or so, but the issues there have not gone away. We may see more Evergrande headlines weighing on China markets into the end of the week as the first 30-day grace period on unpaid offshore bonds approaches. This Saturday is D-Day for the first grace period to expire which I assume will trigger a formal default if no funds appear. That will be followed by another due date early next week. The silence from Evergrande and the government is deafening, and as other developers default or struggle to pay offshore debts, this story may make its way back to the front pages.
Elsewhere though, market sentiment remains decidedly positive, despite an ominous rise in long-dated US yields overnight. That sentiment is being supported on several fronts. US earnings continue to perform very well with very little in the way of downbeat 2022 forecasts. Progress appears to be being made on President Biden’s double-header multi-trillion-dollar in Washington DC, amongst the Democrats at least. The social spending side looks to be going on a severe diet though which was not entirely unexpected. Lastly, tightening monetary policy expectations are rising in a number of developed economies around the world, which is taking the heat out of the Fed taper trade. A plethora of Fed officials was on the hawkish side of the taper last night, and I expect many of tonight’s list to be of the same mind. We haven’t heard the last of the Fed taper trade by any means.
Another risk point is the rise in energy and commodity prices as well as the ongoing supply chain challenges around the world. Japan’s trade balance deteriorated today to JPY 622.8 billion. Although exports were healthy, including those to China, imports rose sharply. Much of that increase was due to material costs and most especially, a 105% jump in energy costs. Transitional versus embedded inflation is like having a vaxxer/anti-vaxxer conversation. Both parties are left with a headache and no discernible progress. But either way, with most of the world’s international commerce priced and transacted in US dollars, it’s hard to see the dollar falling materially in an environment of constantly rising input prices.
The data calendar is a blank slate in Asia now, leaving markets to happily ride the optimism wave washing in from New York. In fact, Asia’s calendar for the rest of the week is lightweight. German PPI and UK PPI and CPI will probably reveal the challenges the Japan trade balance hinted at earlier today. Noises around inflation and trimming the ECB’s ultra-easy QE forever monetary policy are rising, despite some officials trying to dampen it. K markets are already on a trigger happy hiking watch from the BOE next month. A high print from the CPI and PPI will add to that noise and probably see another jump by sterling. Likewise, a firm German PPI could have a similar, if more sedate, effect on the euro.
The US calendar is a sleeper as well, with only crude inventories to relieve the monotony. US markets will continue to be driven by US earnings, which will drown out another round of multi-character Fed-speak this evening. The recovery trade probably has another few days in the sun.
Lastly, bitcoin’s rally continues as trading started in the first bitcoin futures ETF overnight. A dig under the bonnet shows that most of the very healthy volume on its first day came from legalised front-runners, I mean high-frequency traders (HFTs), and retail punters, I mean retail investors. Institutional volume was thin on the ground. Although a regulated ETF based on regulated futures does fit nicely into the mandates of many in the institutional space, I suspect they may wait a while before dipping their toes in the water.
For one, they probably want to see what the liquidity is like when bitcoin aggressively retraces, as it will do at some stage in the future (don’t hate me crypto-nista’s, I’m not dissing your “mainstream asset” story. It’s just that markets go up and down, that physical nature.) Secondly, as Reuters rightly observed, bitcoin futures markets trade on a contango curve. That is longer-dated contracts are more expensive than the front month. That means you lose money rolling expiring contracts into the new front month. They probably want to see an orderly roll with decent two-way liquidity and a shallower contango.
I can’t believe I am into a third paragraph on cryptos, but life is funny in 2021. Directionally, in the spirit of it being a tradeable versus an investible asset, and with the launch of the first exchanged-traded hype-fund (EThF sounds very “DeFi,” yes?), Bitcoin remains a bull market very much. From a technical perspective, a series of higher daily lows, and a 4.5% gain overnight to USD 64,000.00, has left the crypto Dutch tulip poised to test all-time highs around USD 64.900.00. A close above USD 65,000.00 opens the road to USD 80,000.00. I respect the momentum and the price action, not the concept readers. Only a fall through USD 56,500.00 implies the mindless hype of the emperor’s new clothes, I mean the bitcoin as a mainstream investible asset class, rally, is over for now. On that note, I am off to buy a used car with genuine low mileage and three previous lady doctor owners.
NZDUSD Snaps Descending Channel, Bias Cautiously Bullish
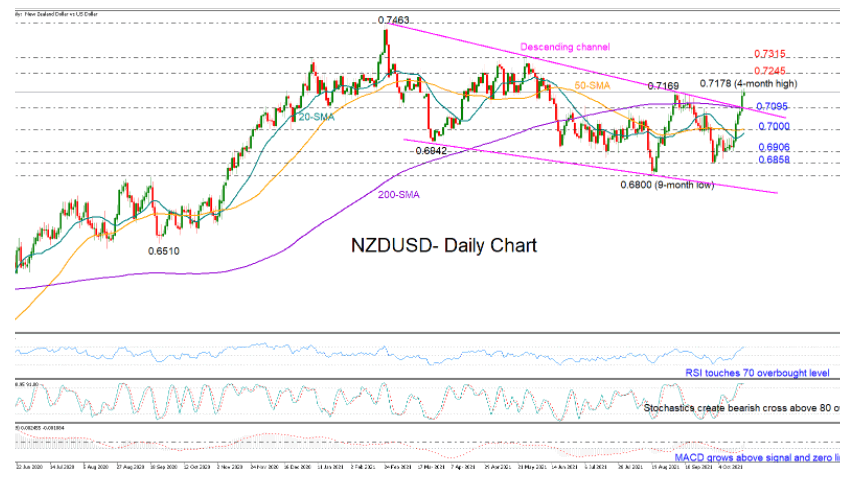
NZDUSD inched to a four-month high of 0.7178 on Thursday following the advance above the eighth-month-old descending channel and the 200-day simple moving average (SMA) on Wednesday.
Although the bullish breakout still requires confirmation and a downside correction cannot be excluded, as the RSI and the Stochastics move in overbought waters, the growing momentum in the MACD suggests buying forces could dominate in the short term.
Should the bulls successfully clear September’s peak of 0.7169, the rally could initially stabilize around the 0.7245 barrier before stretching towards the 0.7315 high from May 26. If the latter gives way, the spotlight will immediately fall on the 2021 top of 0.7463, where any violation would invite long-term bulls into play, likely pushing resistance up to the 2017 peak of 0.7557.
A downside reversal would not be a big burden unless the price dips back below the channel and the 200-day SMA at 0.7095. In this case, selling forces could strengthen towards the 50-day SMA at 0.7000, while lower, some consolidation could take place around the 0.6909 support area before September’s low of 0.6857 comes under examination.
Summarizing, NZDUSD is looking cautiously bullish in the short-term picture. A decisive close above 0.7169 may reduce downside risks, bringing the 0.7245 handle next into view.
Daily Technical Analysis
EUR/USD
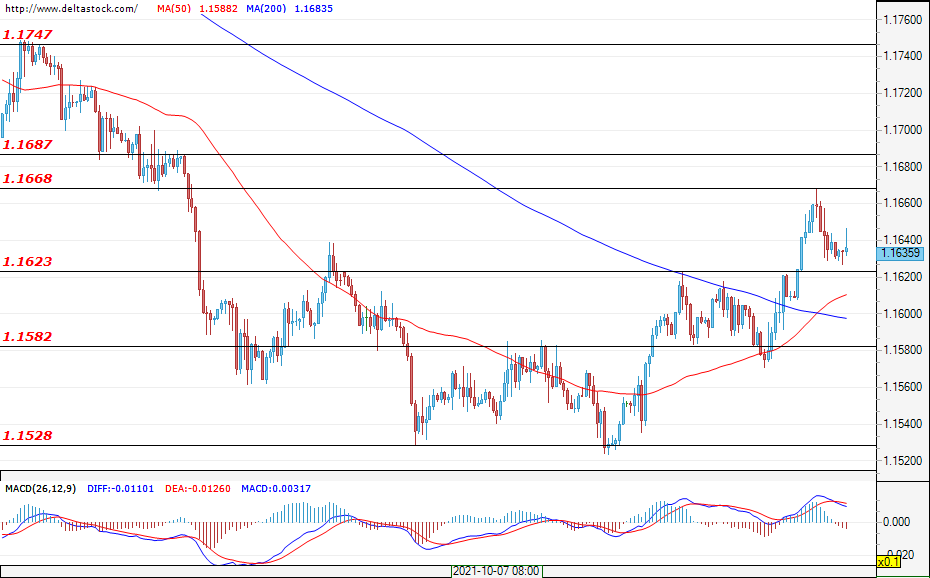
Current level - 1.1638
After the successful breach of the resistance at around 1.1623, there is a reversal of the trend in the currency pair. The sentiment remains positive – for continued growth and an attack of the resistance zone between 1.1668 and 1.1687. If this zone is successfully breached, the next target for the bulls would likely be the area at around 1.1750. The first daily support for the bulls is 1.1623, followed by the key level of 1.1582. Today, an increase in activity can be expected around the announcement of the consumer price index data for the euro area at 09:00 GMT.
| Resistance | Support | ||
| intraday | intraweek | intraday | intraweek |
| 1.1640 | 1.1750 | 1.1582 | 1.1410 |
| 1.1687 | 1.1800 | 1.1528 | 1.1280 |
USD/JPY
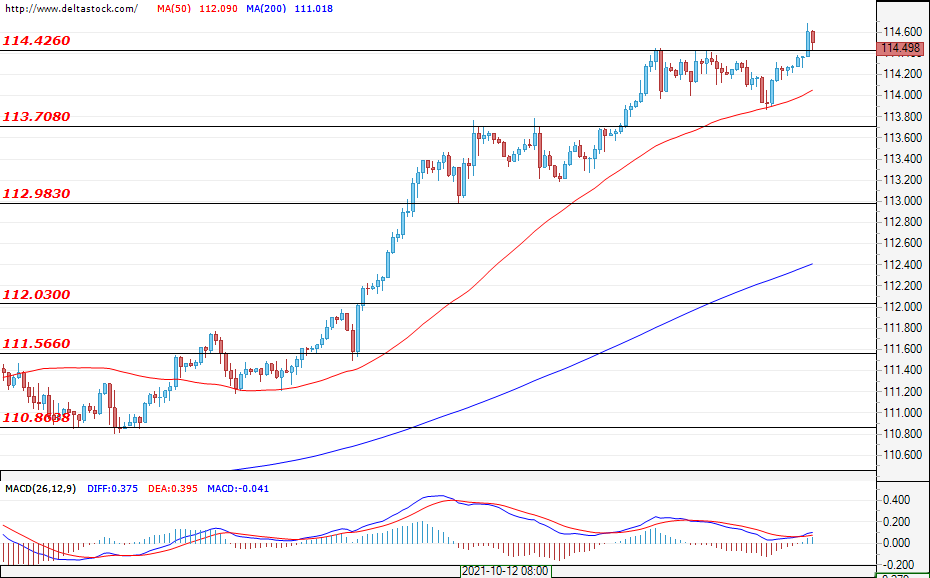
Current level - 114.49
The uptrend here is strong and any corrective movements are being reduced to consolidations in the price movement. The pair managed to breach the resistance of 114.42 and it seems that the bulls are preparing for their next assault, with their goal possibly being 115.50. As long as the momentum of the trend is maintained, prices may even reach 118.60. The first support for the buyers is 114.42, followed by the already confirmed one at 113.70.
| Resistance | Support | ||
| intraday | intraweek | intraday | intraweek |
| 114.34 | 117.90 | 113.64 | 112.00 |
| 115.60 | 118.50 | 113.00 | 111.56 |
GBP/USD
Current level - 1.3801
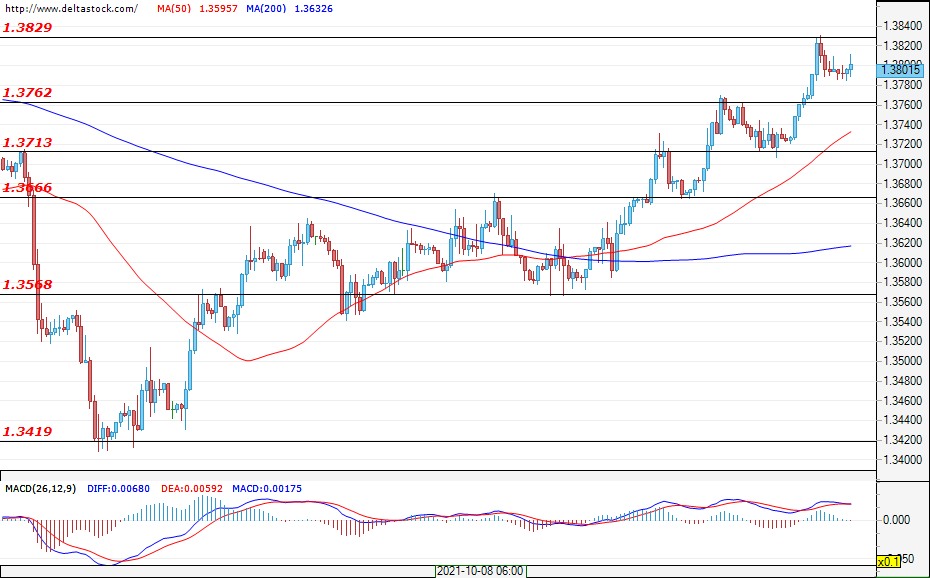
The sterling managed to reach the resistance of 1.3830. However, the strength of the bulls was not enough for a breach and the market entered a pullback phase. It is possible that a test of the support of 1.3762 will follow, but in the early hours of today, the pair holds steady above 1.3800. The 1.3830 level comes from the higher time frames, so the market may need more time to break through. If the zone is conquered, an attack of the next resistance at around 1.3890 can be expected. The key support for the current trend is 1.3720.
| Resistance | Support | ||
| intraday | intraweek | intraday | intraweek |
| 1.3762 | 1.3830 | 1.3713 | 1.3570 |
| 1.3830 | 1.3900 | 1.3666 | 1.3420 |
US 30 Recovers To Previous Peak
The Dow Jones rallies as investors look past macro concerns and focus on earnings instead.
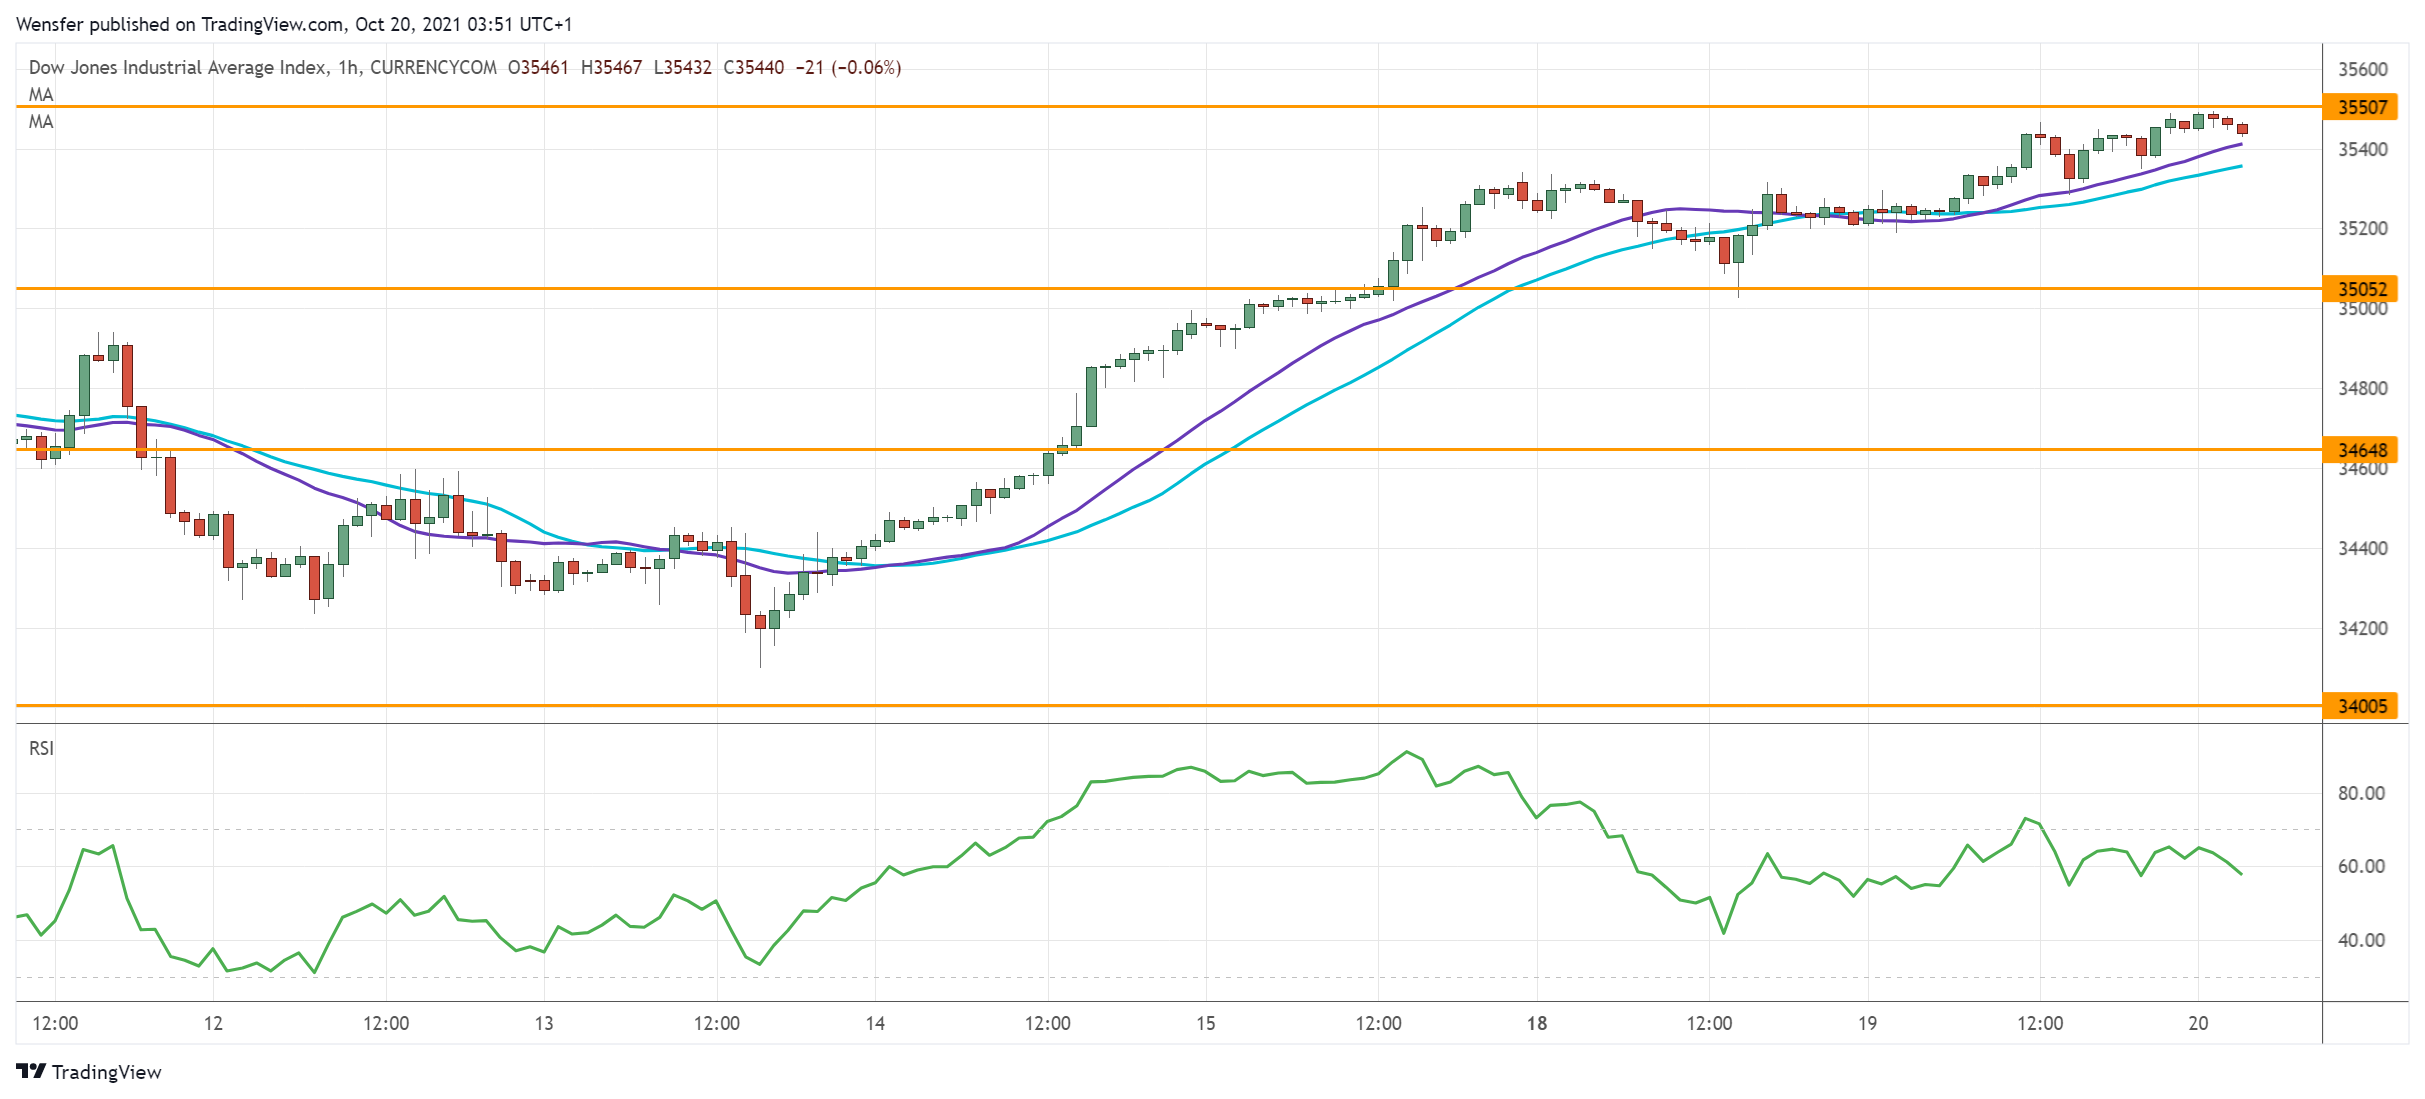
The break above the supply zone around 35000 has prompted the bears to cover. The index then went on to recoup most losses from the September sell-off. With the short-side out of the picture, sentiment might have turned around.
35500 is a major resistance and a bullish breakout would resume the uptrend for new all-time highs. As the RSI suggests an overextension, 35050 is fresh support in case of retracement.
EUR/GBP Breaks Below Support
The sterling soared after BOE Governor Bailey said that the central bank may act to contain inflation.
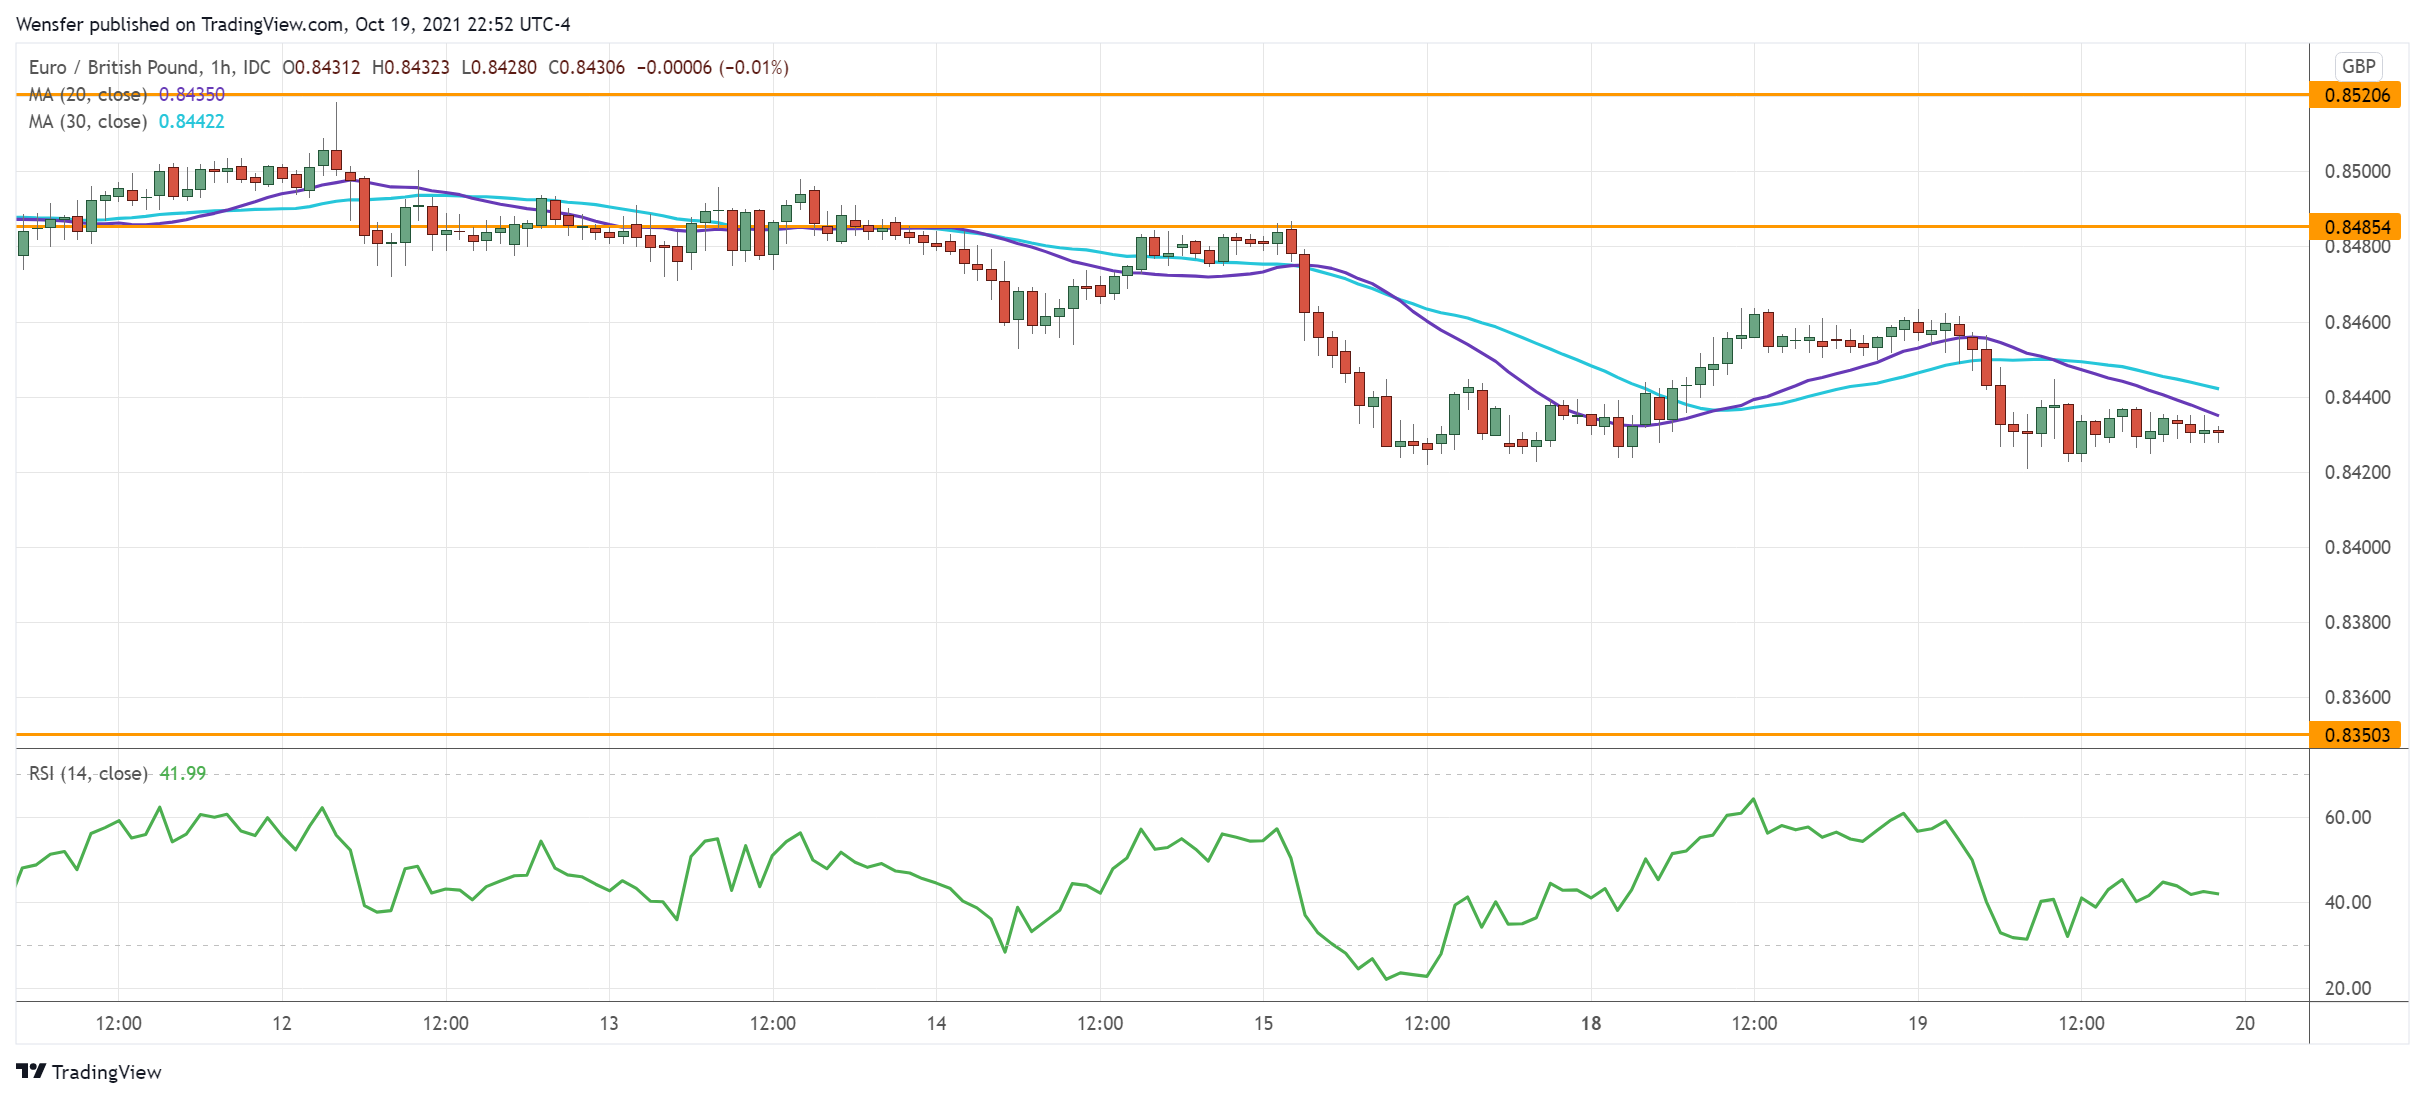
Sentiment has become increasingly bearish over the euro after its break below August’s low at 0.8450. A bearish MA cross on the daily chart indicates an acceleration to the downside.
An oversold RSI has led to a limited rebound towards 0.8485, which may turn out to be an opportunity to sell into strength. 0.8350 near February 2020’s lows would be the next target when momentum traders jump in to bid up the pound.
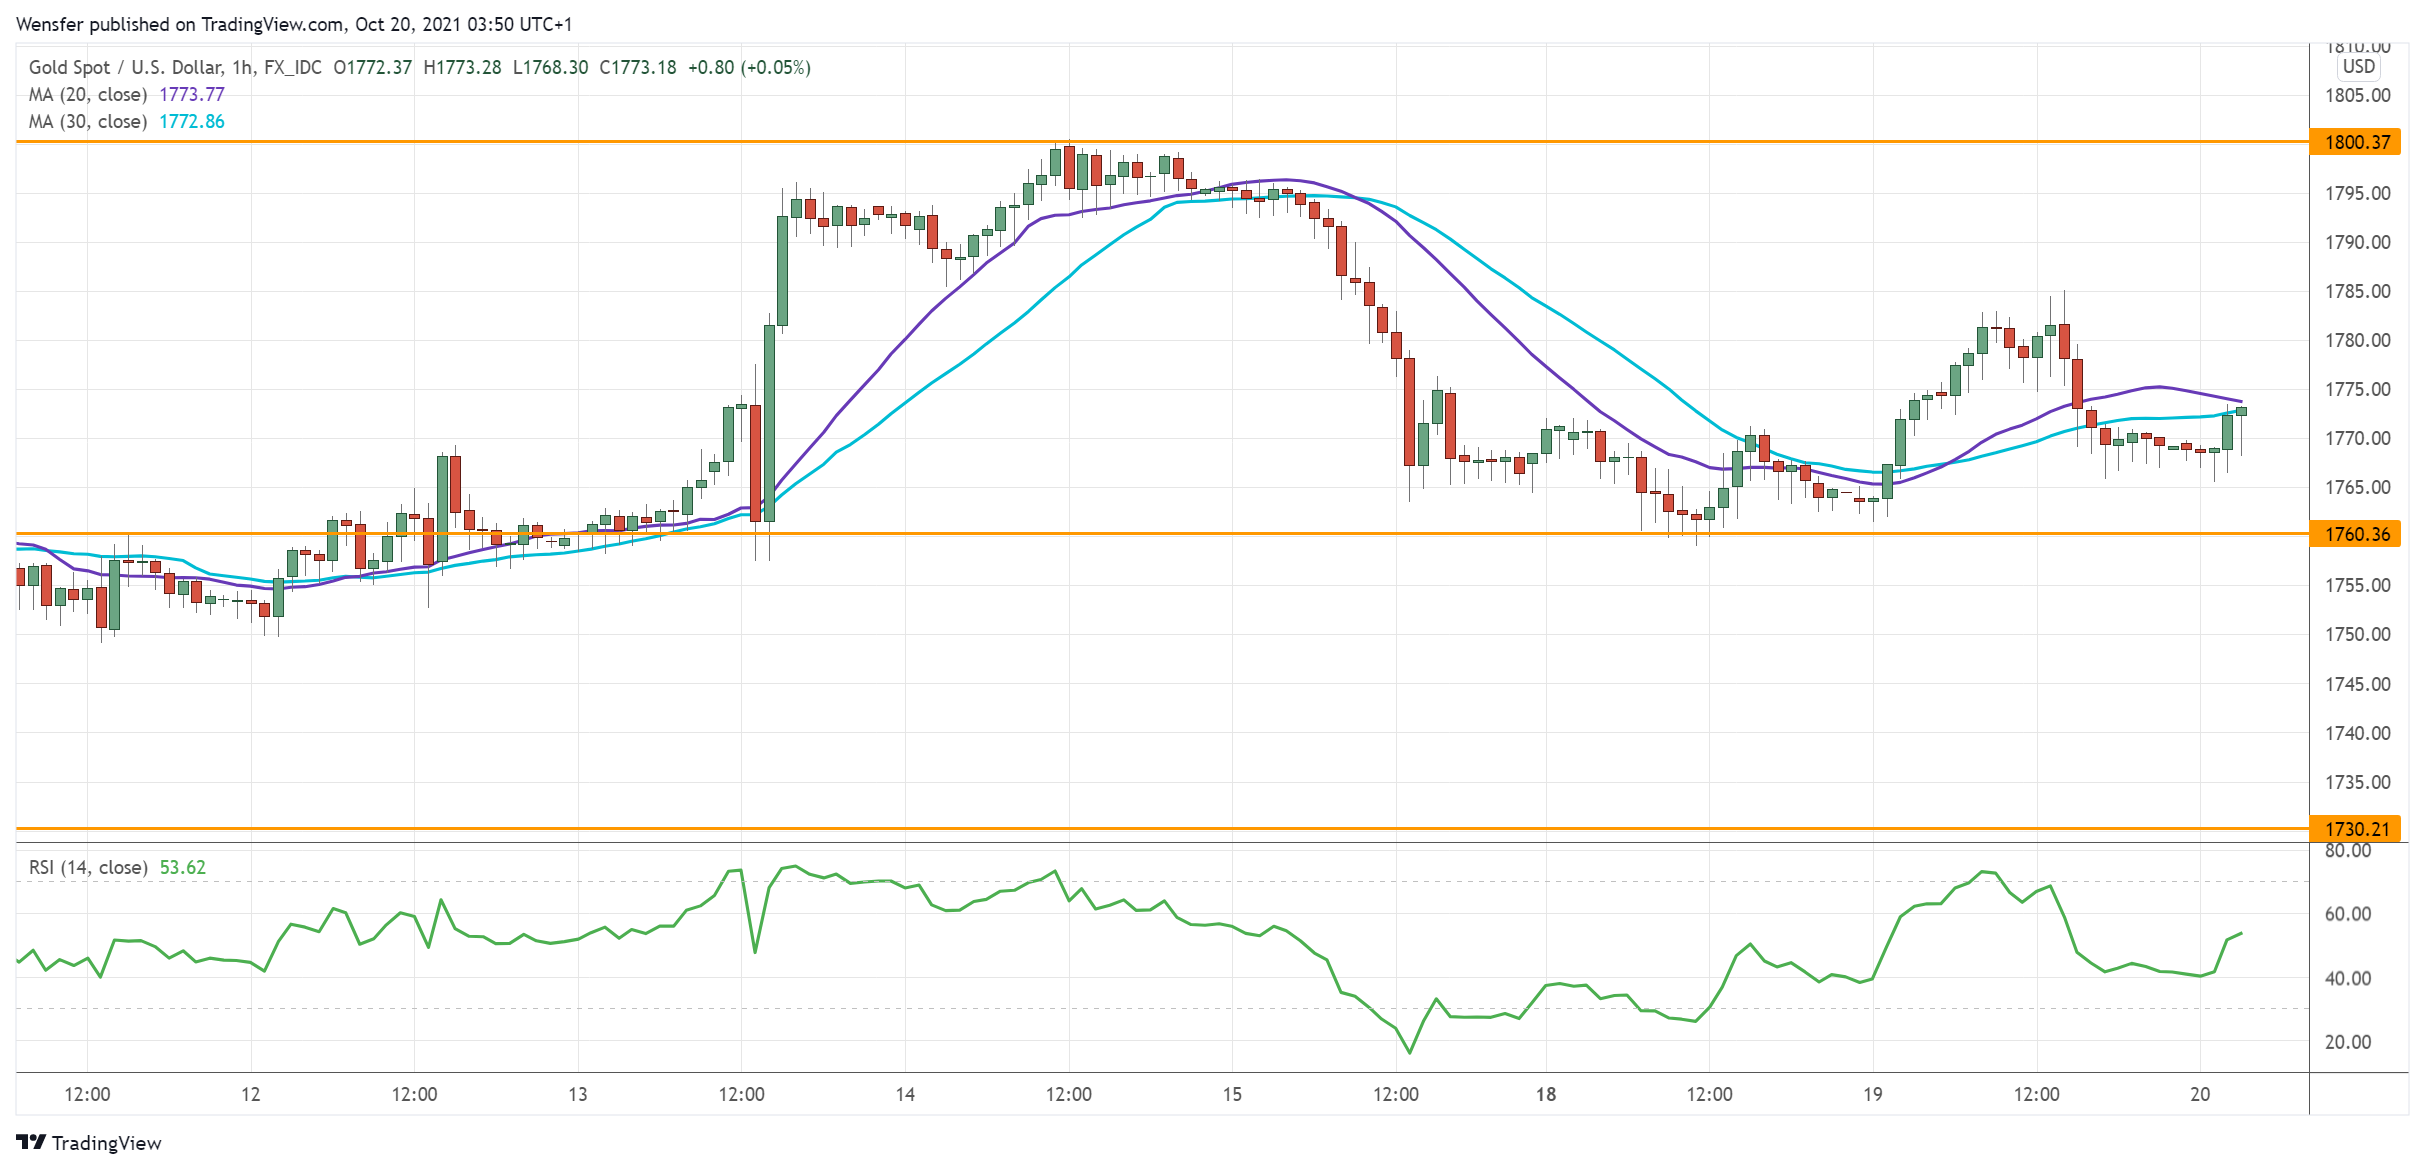
XAU/USD Awaits Breakout
Gold inched higher as the dollar index hit a two-week low.
The latest rebound has been checked by the psychological level of 1800. With the RSI showing an overbought situation, short-term buyers were swift in taking profit from this resistance on the daily chart.
The pullback has met buying interest over 1760. There is an expectation for sideways action in the next few hours as traders wait for a breakout. A deeper correction would test the floor at 1730, while a higher high may send the precious metal to the triple top at 1830.