Sample Category Title
Streaking NZD Hits 5-Week High
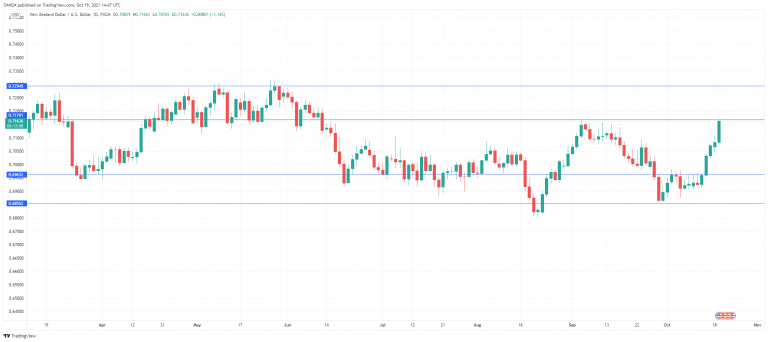
The New Zealand dollar has posted four straight winning sessions and is flying high in the Tuesday session. NZD/USD is currently trading at 0.7162, up 1.11% on the day and at its highest level since September 6th.
RBNZ geared to hike, but by how much?
The New Zealand dollar is red-hot, having climbed 3.74% in the month of October. Another item that is soaring is the country’s inflation. Annual inflation rose 4.9% in the third quarter, higher than the forecast of 4.2%. This was the highest inflation rate since 2011 and is almost 2 per cent above the top of the RBNZ’s target band of 3.0%. ASB Bank is projecting that inflation will run above 5% by the end of the year. CPI for Q3, which was released on Monday, rose 2.2%, which was higher than expected.
It is practically a given that the RBNZ will continue to raise interest rates into 2022, but the size of the hikes remains unclear. Last month, RBNZ Assistant Governor Christian Hawkesby signalled that the central bank would move carefully and in small steps. This appears to suggest incremental hikes of 25 basis points, and the bank raised rates from 0.25% to 0.50% earlier this month. However, with inflation running at such high levels and no indications of a drop anytime soon, the bank may have to reconsider its stance and next raise by 50 basis points in order to curb inflation before it poses a threat to the recovery. The RBNZ holds its next policy meeting on November 24th, and the markets have fully priced in a hike of 0.25%, as well as a 50% chance of a 0.50% hike. With some policymakers at the RBNZ in favour of a 0.50% raise, it will be interesting to follow the comments of bank officials ahead of next month’s meeting.
NZD/USD Technical
- NZD/USD is closing in on resistance at 0.7170. Above, there is resistance at 0.7293
- There are support lines at 0.6963 and 0.6855
US: Housing Starts Pull Back in September
U.S. housing starts fell by 1.6% to 1.56 million (annualized) units in September, falling short of market expectations for a flat print near the 1.6-million mark. Starts were revised up 7k in July and down 35k in August to 1.58 million.
The decline was a multifamily story, with the latter falling 5.0% (or 25k), giving back half of the gain in the month prior. Starts in the single-family segment, meanwhile, remained unchanged at 1.08 million.
Permitting activity fell 7.7% (or 132k) to 1.59 million, erasing the gains made in the two months prior. The pullback was concentrated in the multifamily market, where permits fell 18.3% (or 123k). The single-family market fared better, with permits falling only 0.9% (or 9k) on the month.
Homebuilding activity was mixed across the regions. Starts fell 27.3% in the Northeast and 6.3% in the South, but were up 6.9% in the Midwest and 19.3% in the West.
Key Implications
The pullback in starts, together with the downward revision to the month prior are disappointing, but the underlying picture for homebuilding is better than meets the eye. Given the series' volatile nature, it is worth pulling back the lens and looking at the trend. Starts have trended near the 1.6 million (annualized) mark since December 2020, with this level of activity marking the best 10-month streak since 2006.
Underneath the relatively flat homebuilding trend, single-family starts have generally headed lower, while multifamily starts have headed higher thanks to improving public health conditions and better prospects for urban living. An improved sentiment among single-family homebuilders in recent months suggests that this larger segment may soon transition to more positive trend.
The fundamentals for homebuilding remain solid, thanks to exceptionally low inventory levels and expectations for a continued healing of the labor market as the pandemic moves further into the rear-view mirror. Nonetheless, ongoing challenges with supply chains and the sourcing of labor on the production side, along with affordability challenges on the demand side, are likely to keep a lid on a still-healthy level of activity.
Stocks Buoyant, Dollar Slips and Gold Improves
Sentiment upbeat and US Yields retreat; FOMC speakers to draw focus
The US stock futures recent climb appears supported by gains in the technology and communication service sectors. Moreover, expectations of strong earnings and the stabilization in longer-term yields, after a drop, are not aiding the greenback. Despite the pickup in sentiment, inflationary concerns and the energy crisis seem to be risks that may drag on for a while longer.
The dollar index surrendered ground from the 94.00 mark down to 93.50, and this weakness in the reserve currency has extended over the broader forex arena. Surprisingly, the USD/JPY pair is holding above the 114.00 mark as the antipodean currencies improve and the dollar falters. The euro has climbed to $1.1660, while the pound has surpassed the $1.3800 mark.
A miss in US housing data may keep dollar strength subdued before FOMC speeches later on in the day. US building permits in September dropped to 1.59M, from 1.72Min the previous month, while the number of new houses that were being built eased a little from last month’s numbers, coming in at 1.56M.
Investor’s ears will be locked on FOMC Members speaking later on for clues validating anticipated November tapering. No deviation from tapering is expected, and should rhetoric of this nature surface, the dollar could receive extra damage.
Britain and the Eurozone continue to be hit by risks around price pressures from rising fuel prices more so than other regions as well as supply chain shortages. The euro seems to be guided by dollar strength mainly, while upcoming inflation and PMI data in the following days could exacerbate price moves. This is the scenario for the common currency as the ECB’s accommodative stance provides the euro with limited upside. On the other hand, although the UK is delivering data on inflation, PPI, retail sales and Manufacturing PMI over the next days, Wednesday’s inflationary figures will likely be the data that fuels to a large extent the Bank of England’s rate hike expectations by the end of the year, especially as BoE Governor Bailey highlighted that action was needed to contain inflation from running away.
Antipodeans outperform and commodities hold firm
WTI futures are holding around the highs at $82.80 per barrel. Commodity prices remain elevated with the drop in the US 10-year yield seeming to have also assisted gold in reaching $1,781/oz levels.
The antipodean currencies were among the top gainers today, with the kiwi and aussie improving by 0.94% and 0.75% respectively. The RBA minutes were dovish, conveying the message that hiking rates would be counterproductive towards the labour market in attempts to cool the housing sector. The central bank has repeated that it will not hike until inflation holds within the 2-3% bracket.
Later on today FOMC Members Daly, Bowman, Bostic and Waller are speaking at 15:00, 17:15, 18:50, and 19:00 GMT respectively.
Then at 23:50 GMT, Japan will release its trade balance results.
Sunset Market Commentary
Markets
Yesterday’s UK-led violent sell-off at the short end of the curve eased – but not really reversed – today. In a pretty dull trading session lacking trading opportunities in the form of economic data or others, the UK yield curve stayed pretty much stable in tenors ranging from 2-7 years. Long maturities were mixed with the back of the curve outperforming (30y: -1.5 bps). Turning to Germany, the yield curve there bear steepened with the long end (30y: +4.5bps) undoing yesterday’s remarkable outperformance. The 10y (-0.12%, +3.1 bps) yield erased early morning weakness in technical trading, finding support at the lower bound of the upward sloping trend channel. Changes at the short-to-middle end ranged from +1 bp to +3 bps even as ECB’s Villeroy pushed back against market expectations of a first (small) rate hike already next year. Expressing similar views, ECB’s Rehn said inflation is expected to moderate next year and that there’s no evidence of wage pressures yet. The US curve steepens as well but is the only one to give up some of the yield gains in the 2y (-3 bps) to 5y (-2.3 bps) segment but with the long end underperforming (30y: +2.5 bps). The divergence on the curves’ front end might explain today’s dollar weakness despite an otherwise fragile equity environment (marginal gains up to 0.1-0.3%). It is performing poorly against all majors, including the euro. EUR/USD tested first meaningful resistance around 1.1664 (August interim low) but fails to push through (1.1648 currently). Technical indicators do suggest EUR/USD bullish/USD bearish momentum has returned. The trade-weighted DXY finds itself below the parallel August temporary high of 93.73. The dollar trades in the defensive vs sterling too. Cable surpassed/tests the 1.38(1) barrier where the 100dMA acts as resistance. This is also the result of an overall solid pound too though. EUR/GBP slips back below important support at 0.845 at the time of writing. It did so last Friday as well but the break wasn’t confirmed yesterday. If it does after all, the technical picture drastically improves for the UK currency with EUR/GBP 0.84 the only intermediate support zone standing in the way for a return to 0.8277/82 (2019/2020 low).
News Headlines
Average gross wages in Poland in September were reported at 0.0% M/M and 8.7% Y/Y compared to a rise of 9.5% in August. Employment eased 0.1% M/M to be up 0.6% Y/Y. Both series were marginally softer than expected. The National Bank of Poland last week changed course on its inflation strategy and raised the policy rate 40 bps to 0.5% to address an acceleration in inflation. At the same time, the row between Poland and the EU on the ruling of the Constitutional Court of Poland that parts of EU law were incompatible with the Polish Constitution was subject of an intense debate at the European Parliament. EU Commission President Ursula von der Leyen said the Polish ruling calls into question the foundations of the European Union. She said the EU as three options: a legal challenge to the Polish decision, potentially ending up with fines. A second option is withholding EU funds for Poland. A third option could be applying Article 7 of the EU’s Treaties, suspending the rights of the members state, including the right to vote on a EU decisions. At least for now, the debate didn’t cause any further damage for the zloty. EUR/PLN even declined slightly to 4.57.
In line with its policy decision last month, the National Bank of Hungary (MNB) today continued its hiking cycle with another 15 bps rate hike, bringing the policy rate to 1.8%. At the start of the rate hike cycle, the MNB in June, July and August initially hikes rates at a 30 bp pace. In its policy statement, the MNB reiterated that ‘In the decision-makers’ assessment, the inflation outlook continues to be surrounded by upside risks which might prove to be more persistent than earlier expected. For this reason, the Council considers it necessary to continue the monthly interest rate tightening cycle’. The forint lost modest ground after the MNB policy decision with EUR/HUF trading at 361.
ECB Preview – The Prelude to December
Next week's ECB meeting is largely a prelude to the December meeting, where new staff projections will base the foundation for the exact calibration of its instruments.
We expect ECB to flag risks to the outlook and as such not deviate from the current baseline and send new policy signals already now but wait for a new projections round in December. The September projections are already outdated given the recent spike in energy and slowing growth outlook. That means that we still expect ECB to repeat that they believe that the current inflation outlook is largely transitory, as Lagarde also said this weekend, but that narrative will be tested until the December meeting.
We believe that ECB will attempt to make the meeting as uneventful as possible. From a market perspective the euro area rates have been driven by the BoE's change in tunes as well which have also raised concerns about the transitory narrative ECB is conveying. We expect significant pushbacks against the current rate hike pricing in December 22.
What if: Markets are already testing ECB on its narrative. For ECB to 'give in' to the current market pricing (with rate hike priced for Dec22), we would need to see ECB acknowledging upside risks to underlying inflation and risk of inflation expectations being entrenched already next week as a first step. That will later open the possibility for APP and change of forward guidance in reasonable time (H1 next year) for a rate hike to materialise. In our extreme scenario (5%) we can see an ECB hike in mid-2023, see more in COTW: What if inflation is coming. Can ECB hike in 2023?
US 500 Index Returns to Gains; More Bullish Outlook is Expected
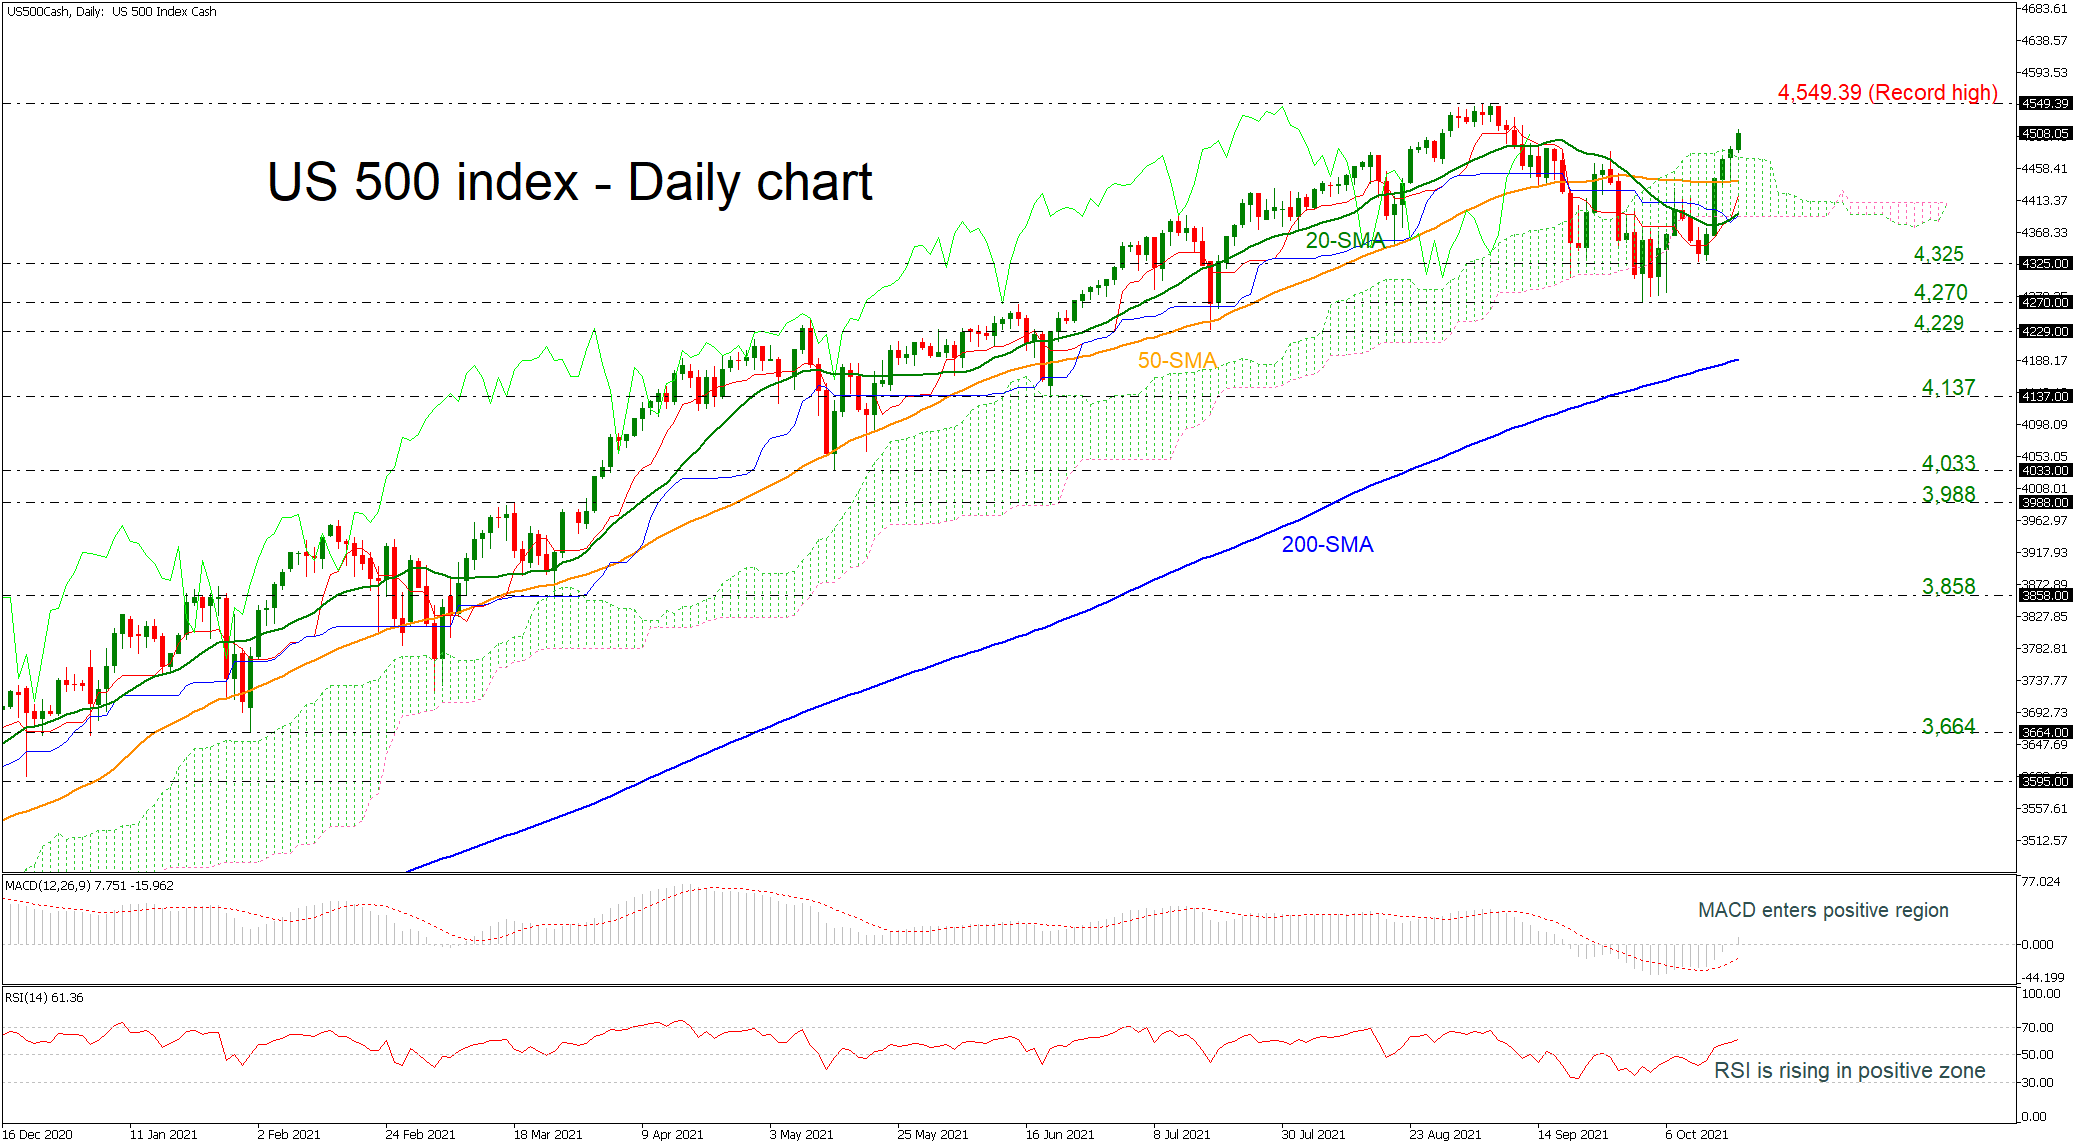
The US 500 (Cash) index has strongly rebounded off the 4,270 barrier and the momentum indicators now suggest that the market sentiment is back to bullish as the MACD is entering the positive region, holding above its trigger line. Also, the RSI is pointing northwards above the 50 level and the price has surpassed the upper boundary of the Ichimoku cloud, indicating more positive movements.
Should bullish dynamics dominate, the market might revisit the all-time high of 4,549.39 before getting into uncharted levels. The next targets could come from 4,600 to 4,700 and 4,800.
On the flip side, if there is a slip below the Ichimoku cloud and the 20- and 40-day simple moving averages (SMAs), immediate support could come from the 4,325 barrier. In case of steeper declines, the price may overcome that point to test 4,270 and 4,229.
To summarize, the US 500 stock index bias looks positive both in the short and the long term.
USD/JPY Mid-Day Outlook
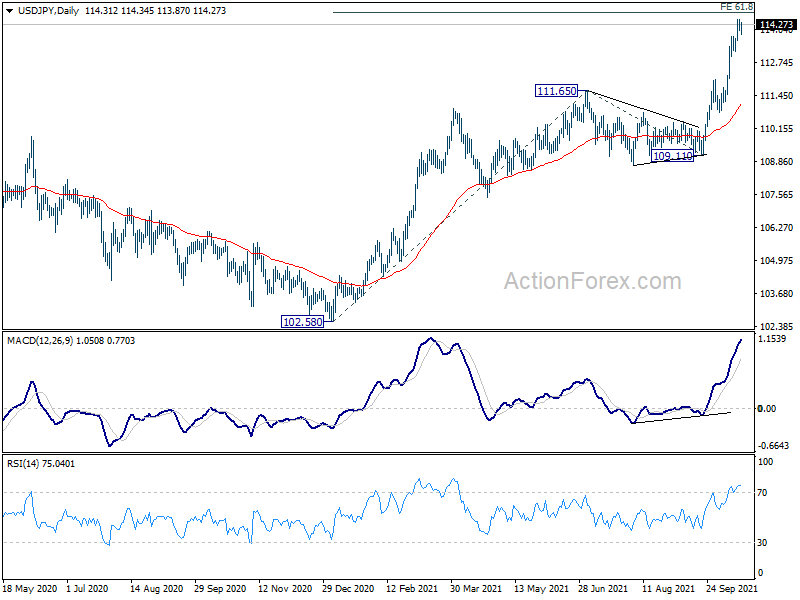
Daily Pivots: (S1) 114.08; (P) 114.26; (R1) 114.51; More...
With 113.20 minor support intact, further rise is still in favor in USD/JPY. Firm break of 61.8% projection of 102.58 to 111.65 from 109.11 at 114.71 will pave the way to 100% projection at 118.18 next. On the downside, break of 113.20 minor support will turn bias back to the downside for deeper pull back first.
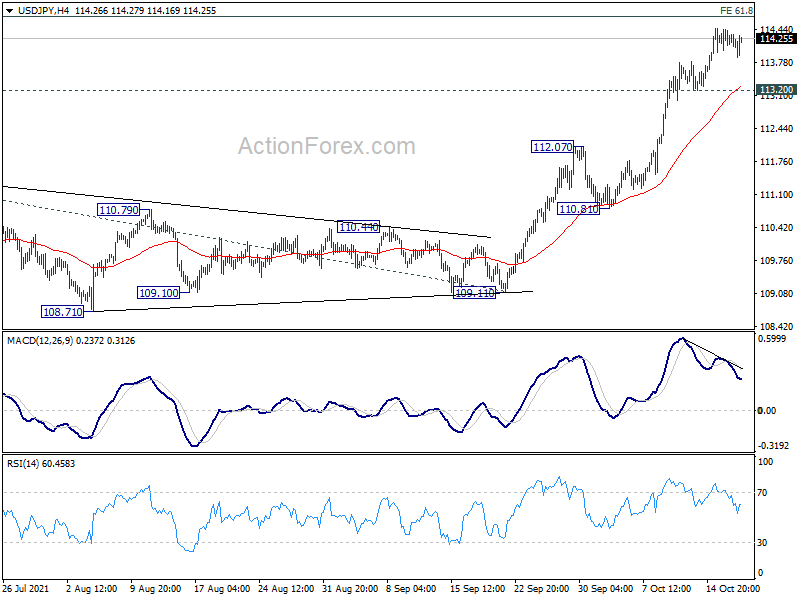
In the bigger picture, corrective decline from 118.65 (2016 high) should have completed at 101.18 already. Rise from the 102.58 is seen as the third leg of the up trend from 101.18. Next target is 114.54 resistance and then 118.65 high. This will now be the preferred case as long as 109.11 support hold, even in case of deep pull back.
USD/CHF Mid-Day Outlook
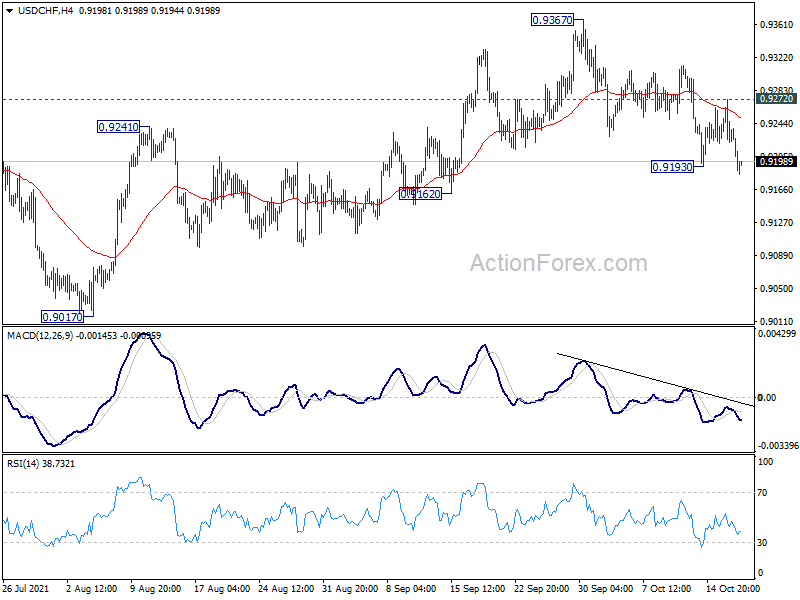
Daily Pivots: (S1) 0.9217; (P) 0.9245; (R1) 0.9266; More....
USD/CHF's fall from 0.9367 resumes by breaking 0.9193 and intraday bias is back on the downside. Considering bearish divergence condition in daily MACD, firm break of 0.9162 will argue that whole rise from 0.8925 has completed and target this support. On the upside, break of 0.9272 minor resistance will turn bias back to the upside for retesting 0.9367 instead.
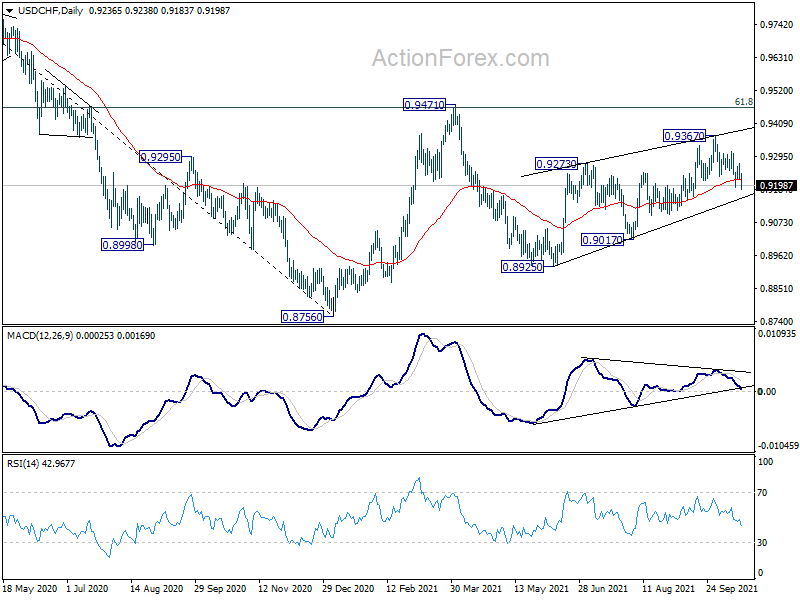
In the bigger picture, the corrective structure of the rebound from 0.8925 argues that fall from 0.9471 is not completed yet. It could either be the second leg of pattern from 0.8756 (2021 low), or resuming larger down trend from 1.0237 (2018 high). We'd pay attention to the downside momentum of assess the odds later. But for now, medium term outlook will be neutral at best as long as 0.9471 resistance holds.
EUR/USD Mid-Day Outlook
Daily Pivots: (S1) 1.1581; (P) 1.1602; (R1) 1.1632; More...
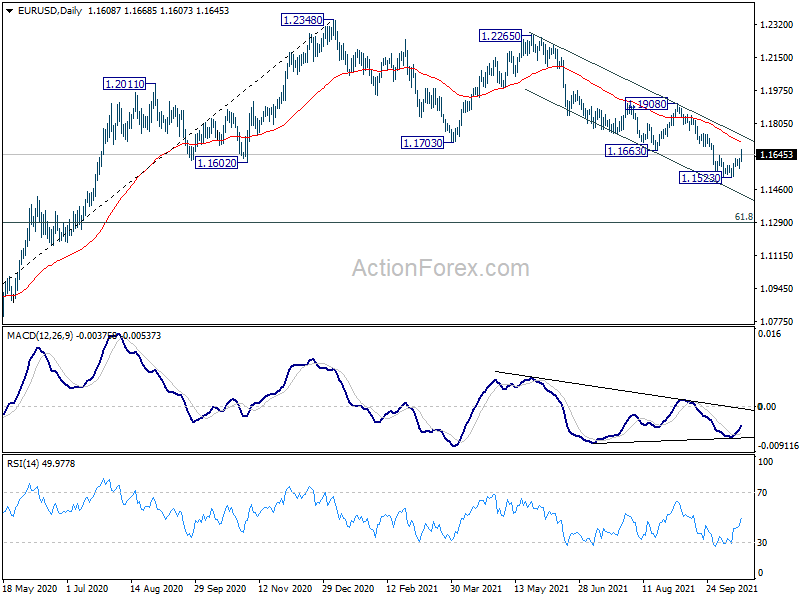
EUR/USD's break of 1.1639 resistance should confirm short term bottoming at 1.1523. Intraday bias is back on the upside for 55 day EMA (now at 1.1712) first. Sustained break there will be a sign that larger correction from 1.2348 has completed. Stronger rally would be seen to 1.1908 resistance for confirmation. On the downside, though, break of 1.1571 minor support will turn bias back to the downside for 1.1523 support instead.
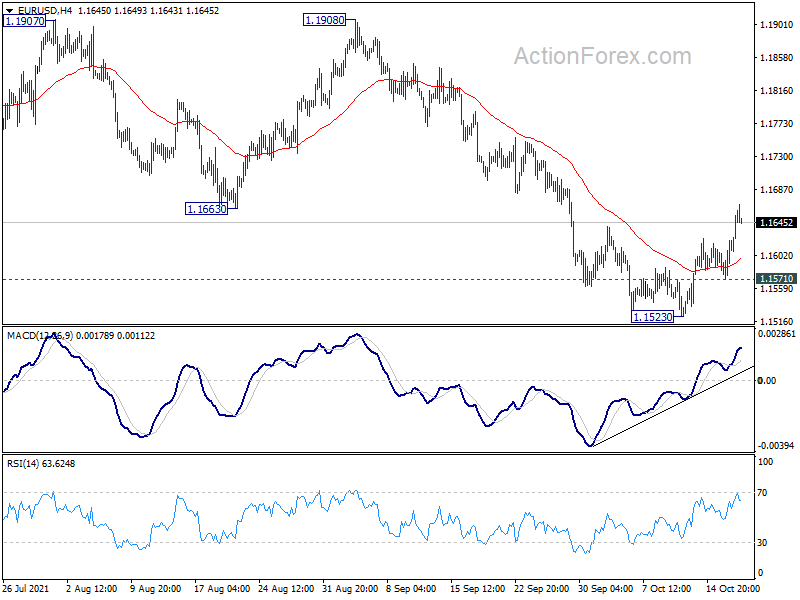
In the bigger picture, price actions from 1.2348 should at least be a correction to rise from 1.0635 (2020 low). As long as 1.1908 resistance holds, deeper fall would be seen to 61.8% retracement of 1.0635 to 1.2348 at 1.1289. Nevertheless break of 1.1908 resistance will revive medium term bullishness and turn focus back to 1.2348 high.
GBP/USD Mid-Day Outlook
Daily Pivots: (S1) 1.3703; (P) 1.3734; (R1) 1.3759; More...
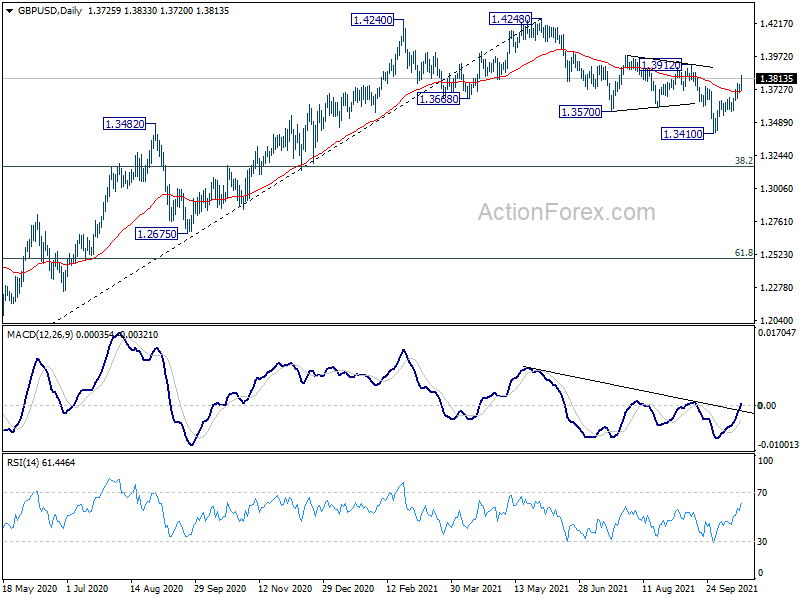
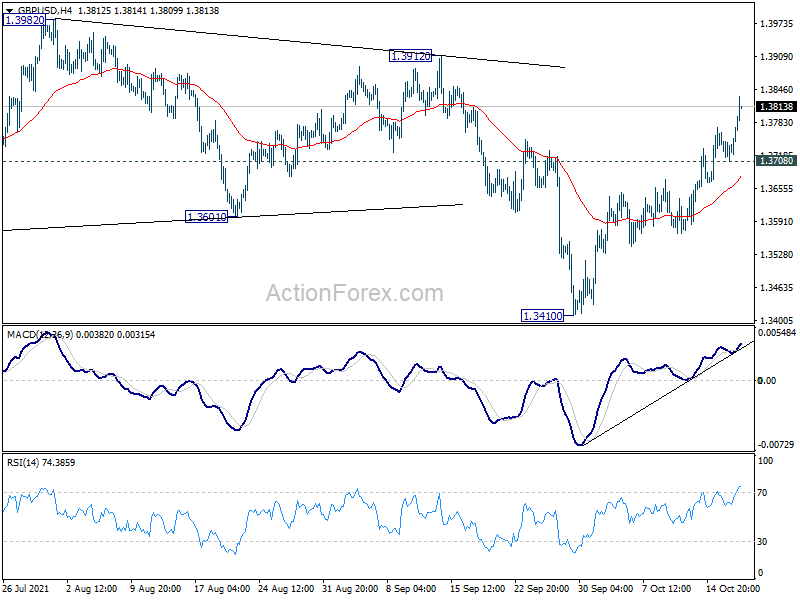
GBP/USD's rebound from 1.3410 extends higher today and intraday bias stays on the upside for 1.3912 key structural resistance. Firm break there will indicate that the correction from 1.4248 is complete with three waves down to 1.3410. Further rally would then be seen to retest 1.4248 high. On the downside, however, break of 1.3708 minor support will dampen the bullish case and turn intraday bias neutral first.
In the bigger picture, the structure of the fall from 1.4248 suggests that it's a correction to the up trend from 1.1409 (2020 low) only. While deeper fall cannot be ruled out yet, downside should be contained by 38.2% retracement of 1.1409 to 1.4248 at 1.3164, at least on first attempt, to bring rebound. On the upside, firm break of 1.4376 key resistance (2018 high) will add to the case of long term bullish reversal. However, sustained trading below 1.3164 will revive some medium term bearishness and target 61.8% retracement at 1.2493.