

Sample Category Title
The Analytical Overview Of The Main Currency Pairs
The EUR/USD currency pair
Technical indicators of the currency pair:
Prev Open: 1.1591
Prev Close: 1.1610
% chg. over the last day: +0.16%
Germany is considering ending the state of emergency on November 25. Germany's inflation has risen rapidly in recent months, so the country needs to improve its economic climate. At its September meeting, the ECB postponed several important decisions until December. Still, since then, rising energy prices have pushed Eurozone inflation to a 13-year high of 3.4% in annual terms, and analysts expect it to continue rising.
Trading recommendations
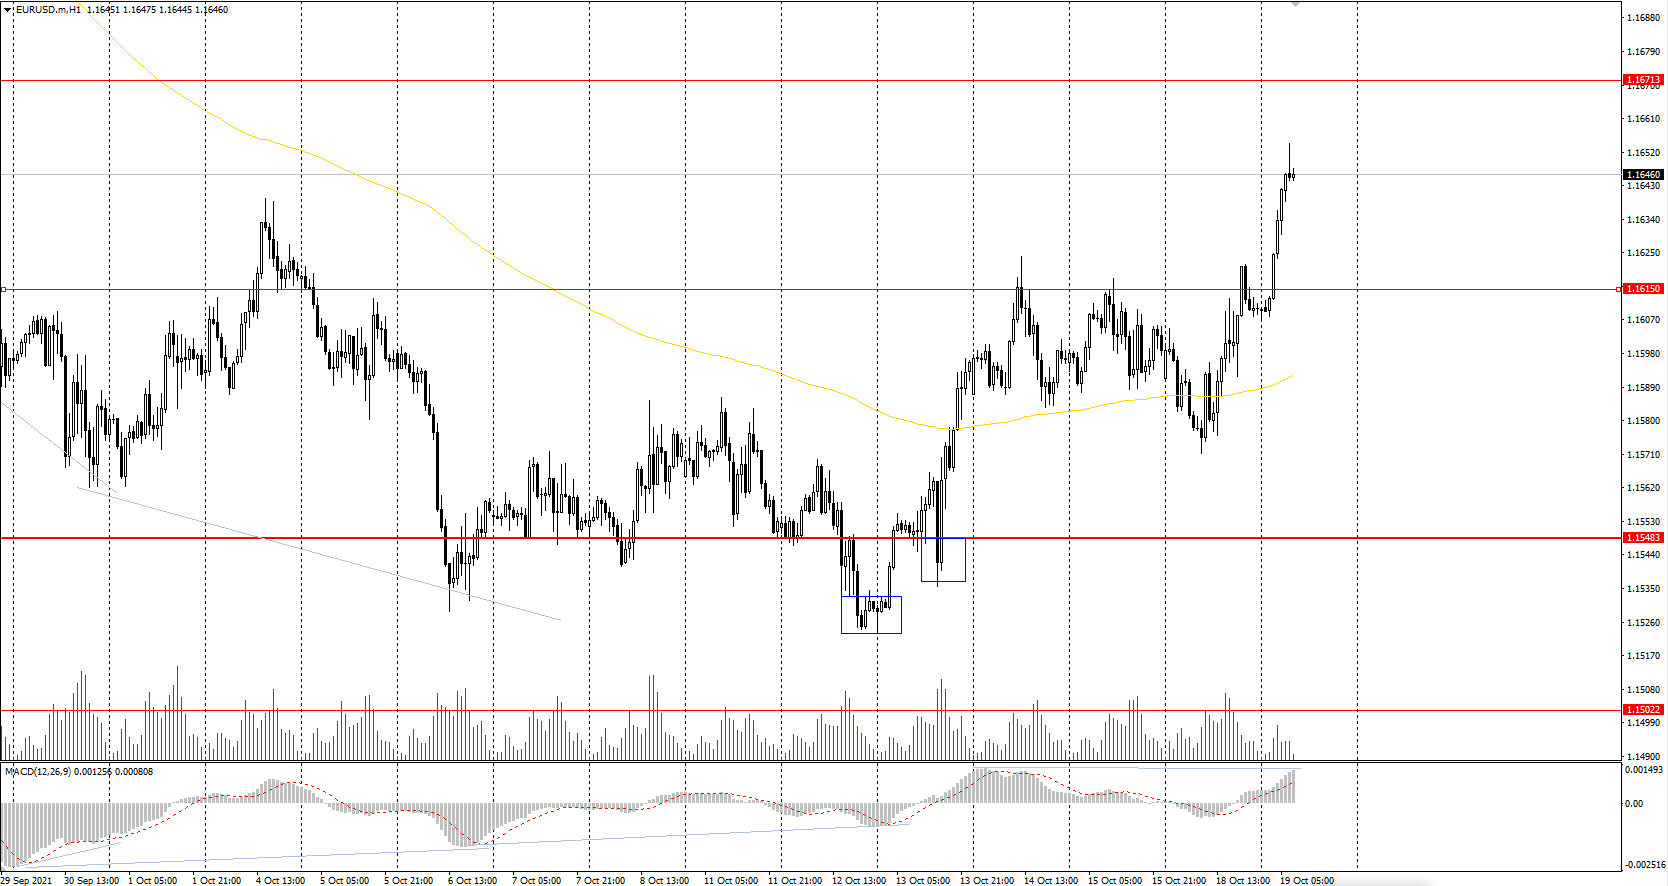
Support levels: 1.1615, 1.1548, 1.1502, 1.1453
Resistance levels: 1.1671, 1.1717, 1.1772, 1.1802, 1.1835
From the technical point of view, the EUR/USD trend on the hour timeframe has changed to bullish. In the Asian session, the price confidently broke through the priority change level. But the MACD indicator is already showing signs of the buyer's weakness. Under such market conditions, traders should consider buying positions from the support levels near the moving average or the buyer's initiative areas. It is best to look for sell trades from the resistance levels of the higher timeframe.
Alternative scenario: if the price breaks down through the 1.1548 support level and fixes below, the mid-term uptrend will likely be broken.
News feed for 2021.10.19:
- US Building Permits (m/m) at 15:30 (GMT+3);
- US FOMC Member Daly Speaks at 18:00 (GMT+3);
- US FOMC Member Bostic Speaks at 21:50 (GMT+3).
The GBP/USD currency pair
Technical indicators of the currency pair:
Prev Open: 1.3747
Prev Close: 1.3728
% chg. over the last day: +0.14%
The number of British power companies that have gone bankrupt since early September amid soaring natural gas prices has reached 13. Today investors will closely follow the speech of the head of the Bank of England. According to JPMorgan, the Bank of England will raise the interest rate by 15 bps in November and by another 25 bps in February and in August next year.
Trading recommendations
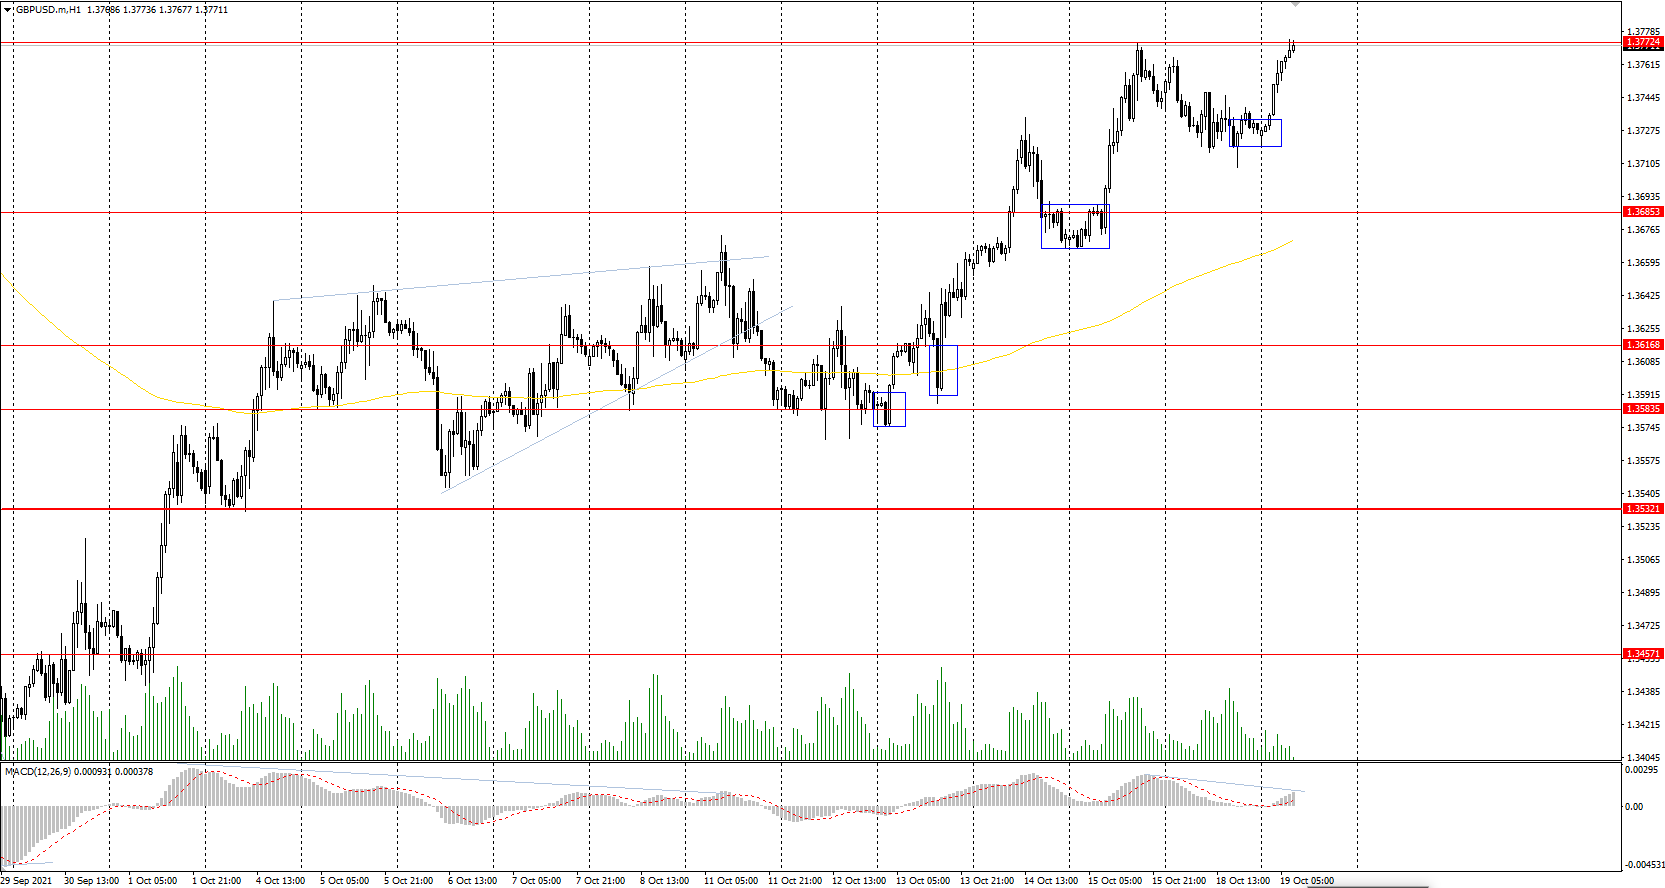
Support levels: 1.3685, 1.3617, 1.3584, 1.3532, 1.3457, 1.3360, 1.3282
Resistance levels: 1.3772, 1.3812, 1.3886
On the hourly time frame, the GBP/USD trend is bullish. The British pound is strengthening due to its direct correlation with oil prices and the weakness of the dollar index. The MACD indicator is in the positive zone, but there are the first signs of buyer's weakness. Buy trades should be considered only within the day and only from the initiative zone of the buyers. It is better to look for sell deals from the resistance levels, but after an additional confirmation in the form of a sellers' initiative, because the buyers' pressure is higher now.
Alternative scenario: if the price breaks down through the 1.3532 support level and consolidates below, the bullish scenario is likely to be broken.
News feed for 2021.10.19:
- UK BoE Gov Bailey Speaks at 15:05 (GMT+3).
The USD/JPY currency pair
Technical indicators of the currency pair:
Prev Open: 114.16
Prev Close: 114.31
% chg. over the last day: +0.13%
Several representatives of the Bank of Japan said that the current stimulative monetary policy should be maintained for a longer period, as the Japanese economy is not coping as well as other advanced economies in the aftermath of the pandemic. That is a negative signal for the JPY since with the US Fed cutting its stimulus program soon, the dollar index might increase, which would lead the USD/JPY currency pair to grow further.
Trading recommendations
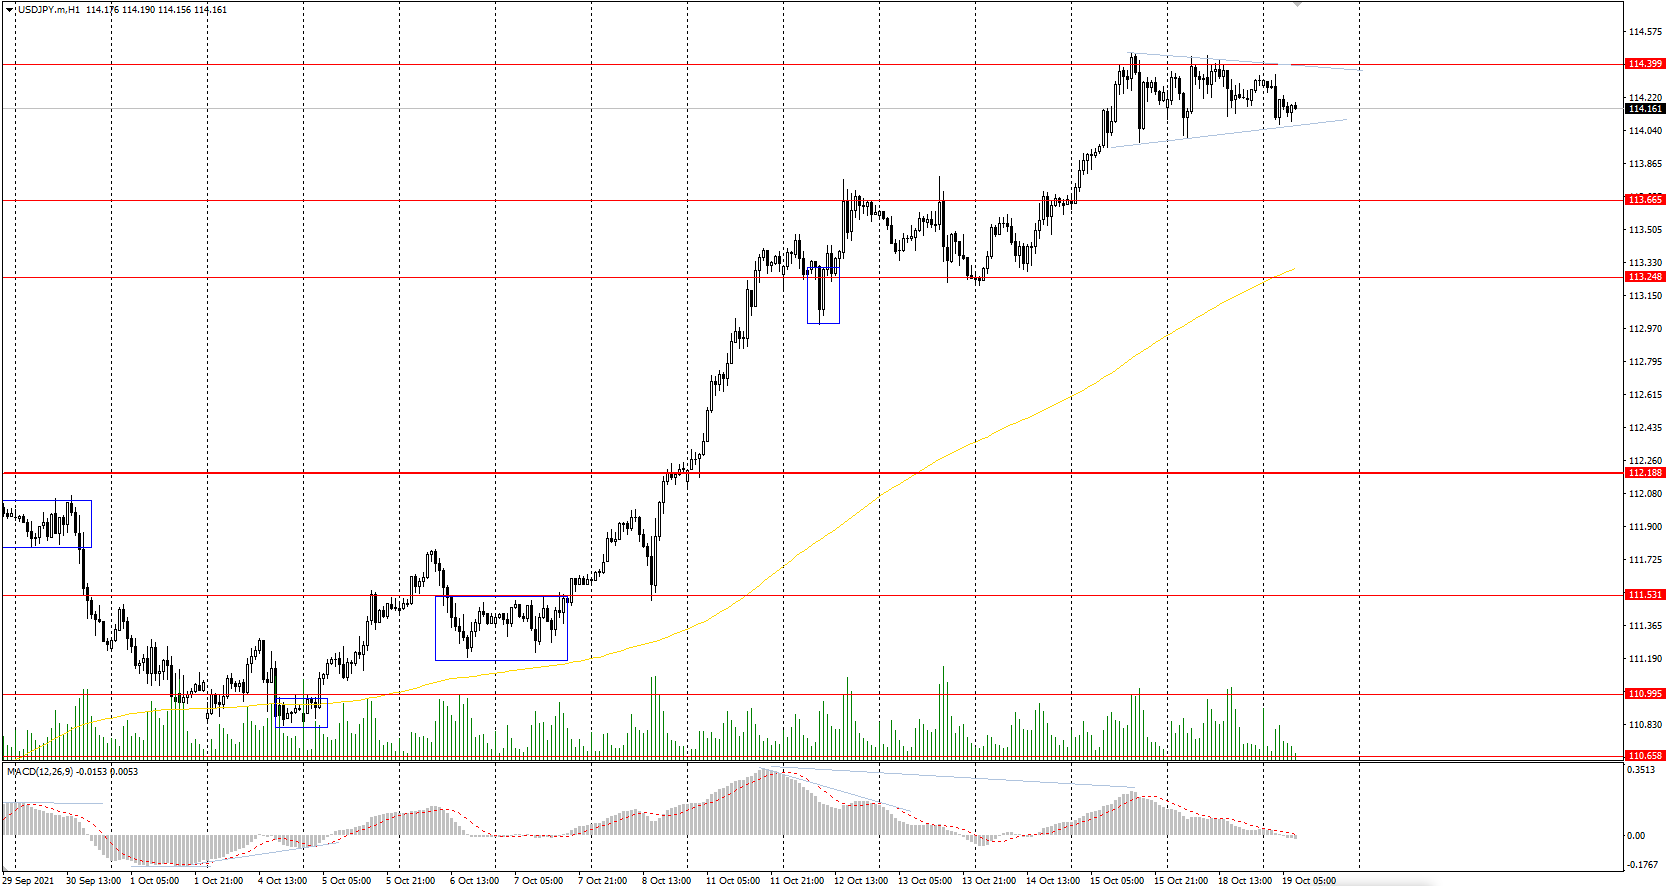
Support levels: 113.66, 113.25, 112.19, 111.53, 110.99, 110.65, 109.95, 109.63
Resistance levels: 114.40
The main trend of the USD/JPY currency pair is bullish. The price is trading flat, and a triangle pattern is forming. The MACD indicator has become inactive. However, there is still a divergence in higher time frames, which means that growth is limited, and correction is expected soon. Under such market conditions, it's better to look for buy positions from the support levels near the moving average since the price has deviated greatly from the average line. Sell positions should be considered only throughout the day from the resistance levels, given there is sellers' initiative.
Alternative scenario: if the price falls below 112.19, the uptrend is likely to be broken.
News feed for 2021.10.19:
- UK BoE Gov Bailey Speaks at 15:05 (GMT+3).
The USD/JPY currency pair
Technical indicators of the currency pair:
Prev Open: 114.16
Prev Close: 114.31
% chg. over the last day: +0.13%
Several representatives of the Bank of Japan said that the current stimulative monetary policy should be maintained for a longer period, as the Japanese economy is not coping as well as other advanced economies in the aftermath of the pandemic. That is a negative signal for the JPY since with the US Fed cutting its stimulus program soon, the dollar index might increase, which would lead the USD/JPY currency pair to grow further.
Trading recommendations
Support levels: 113.66, 113.25, 112.19, 111.53, 110.99, 110.65, 109.95, 109.63
Resistance levels: 114.40
The main trend of the USD/JPY currency pair is bullish. The price is trading flat, and a triangle pattern is forming. The MACD indicator has become inactive. However, there is still a divergence in higher time frames, which means that growth is limited, and correction is expected soon. Under such market conditions, it's better to look for buy positions from the support levels near the moving average since the price has deviated greatly from the average line. Sell positions should be considered only throughout the day from the resistance levels, given there is sellers' initiative.
Alternative scenario: if the price falls below 112.19, the uptrend is likely to be broken.
USD Tends To Gain, Yet Has Not Escaped Its Sideways Motion
The USD remained relatively stable on Friday yet had some gains during today’s Asian session against some of its counterparts, as inflation rates tend to be on the rise on a global scale and the market has priced in the possibility of Fed rate hikes by next September. It should be noted that US yields tend to remain at rather high levels for the time being and should they gain more ground, we may see the greenback getting further support. Besides fundamentals USD traders are expected to keep an eye out also for the release of the US industrial production for September due out later today in the American session. Looking at the global markets, it should be noted that China’s GDP for Q3, dropped below the psychological barrier of 5% yoy and has reached a one year low. The power crunch in combination with supply shortages tend to bite and its characteristic of growth issues which the global economy faces as it tries to rebound. On the commodity currencies front, the CAD has strengthened against the USD on Friday as oil prices continue to climb while Loonie traders focus on Canada’s Housing starts for September. Characteristically WTI prices maintained their upward motion reaching new multiyear record highs and are currently aiming for $83 per barrel, as expectations for increased demand and tight supply seem to guide the market. On a more exotic note, TRY reaches new record lows against the USD as concerns for a possible rate cut on Wednesday from the Central Bank of Turkey continue to be present and have an adverse effect on the Lira’s value. As for the US equities, we note the gains marked by the major three US Stockmarkets on Friday as the market’s focus turns towards earnings releases this week and we note among many Netflix on Tuesday, Tesla on Wednesday, Unilever on Thursday, American Express on Friday and the dividends of Caterpillar on the same day.
The USD index is currently testing the 94.10 (R1) resistance line, threatening to escape its past sideways motion to the upside. For our sideways bias to be abolished, we would though require for the index to clearly break above the 94.10 (R1) resistance line and aim higher. Should the bulls take over, we may see the index breaking the 94.10 (R1) resistance line and aim for the 94.60 (R2) level. Should the bears take over, we could see the index reversing course taking aim if not breaching the 93.70 (S1) support line.
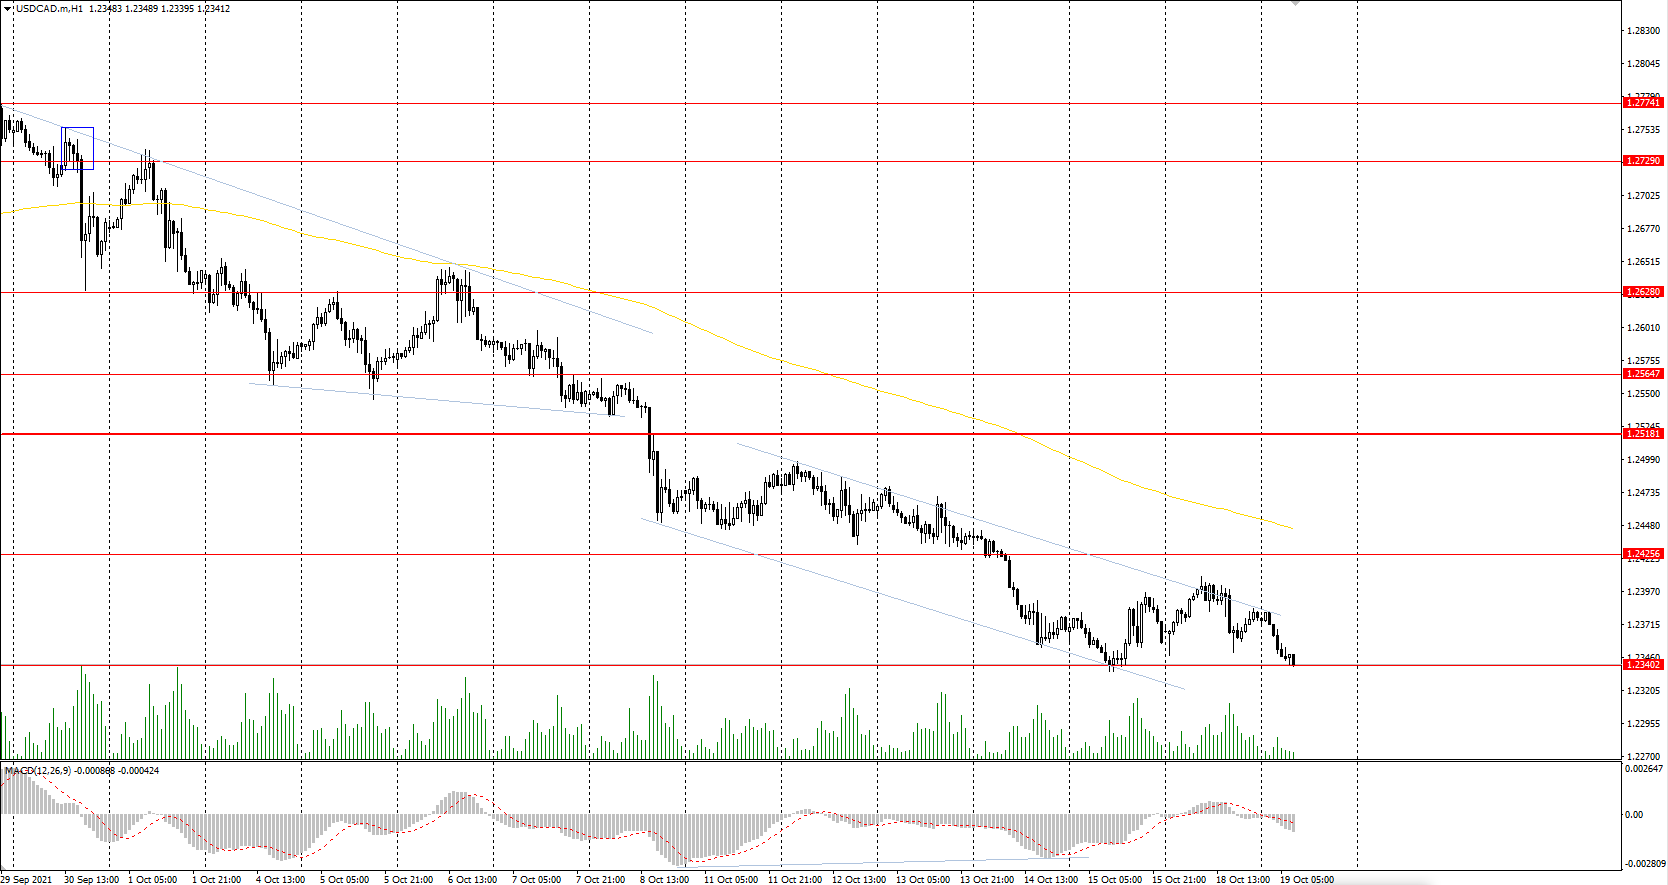
USD/CAD seemed to correct higher after failing to substantially threaten the 1.2160 (S1) support line. The pair’s price action is currently testing the downward trendline guiding it since the 29th of September and should the downward trendline be broken we would switch our bearish outlook for the pair technically, initially for a sideways bias. If the buyers are in charge USD/CAD could break clearly the prementioned downward trendline, the 1.2425 (R1) line and aim for the 1.2500 (R2) level. If the pair succumbs to the trendline’s orders, we may see it breaking the 1.2330 (S1) line and aim for the 1.2250 (S2) level.
Today’s events and expectations
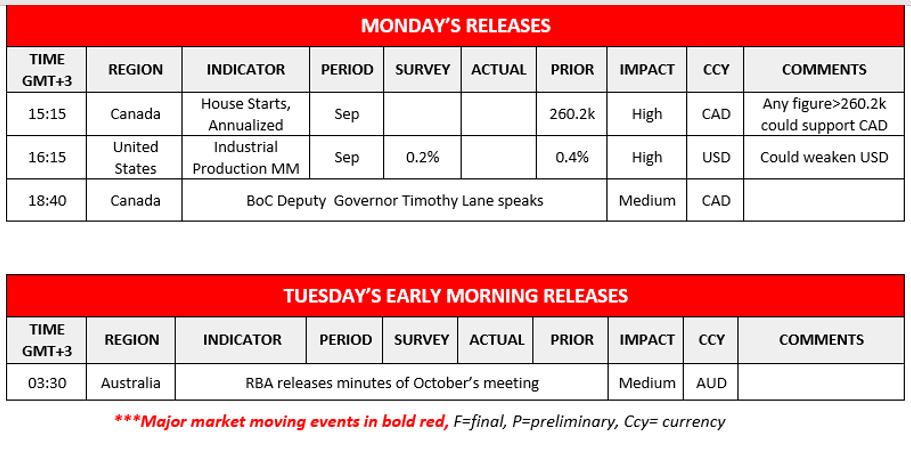
Today we get from the US the industrial output and from Canada the Housing starts both for September.
As for the rest of the week
On Tuesday, we highlight the release of RBA’s October meeting minutes. On Wednesday we get Japan’s trade data, UK’s CPI rates and Eurozone’s final HICP rates as well as Canada’s CPI rates all being for September. On Thursday, we get UK’s CBI industrial trends for orders for October, from Turkey CBRT’s interest rate decision, from the US the Philly Fed Business index for October and the weekly initial jobless claims figure, while from the Eurozone the preliminary consumer sentiment for October. On Friday we get Japan’s CPI rates for September, UK’s retail sales for September, Canada’s retail sales for August and most importantly the preliminary PMI readings of October for Japan, France, Germany, Eurozone, UK and the US.
USD Index H4 Chart
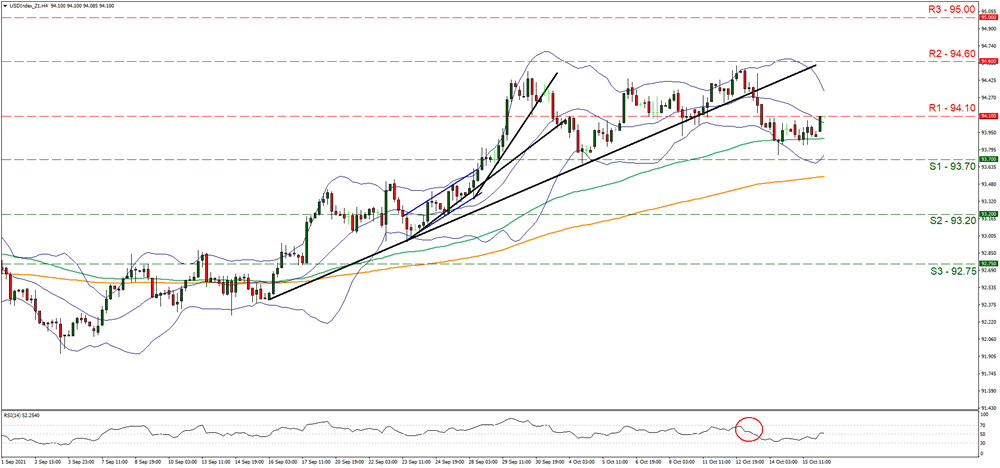 Support: 93.70 (S1), 93.20 (S2), 92.75 (S3)
Resistance: 94.10 (R1), 94.60 (R2), 95.00 (R3)
USD/CAD H4 Chart
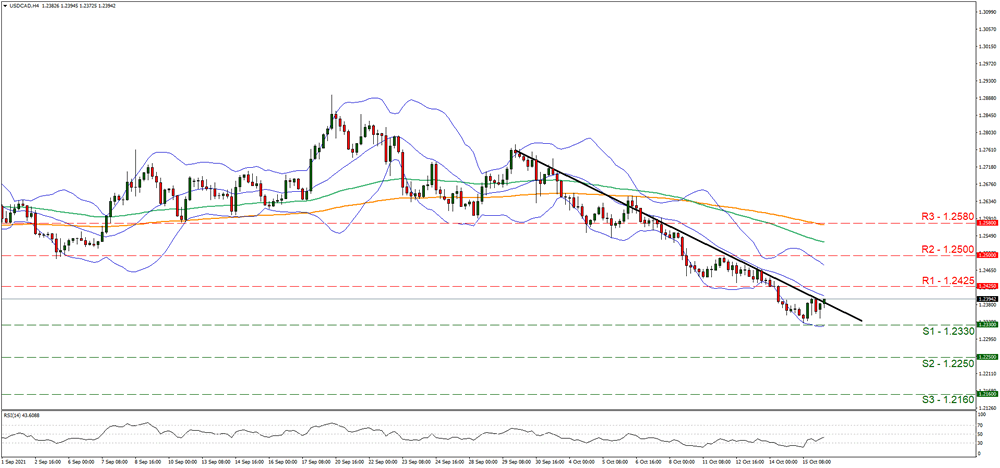 Support: 1.2330 (S1), 1.2250 (S2), 1.2160 (S3)
Resistance: 1.2425 (R1), 1.2500 (R2), 1.2580 (R3)
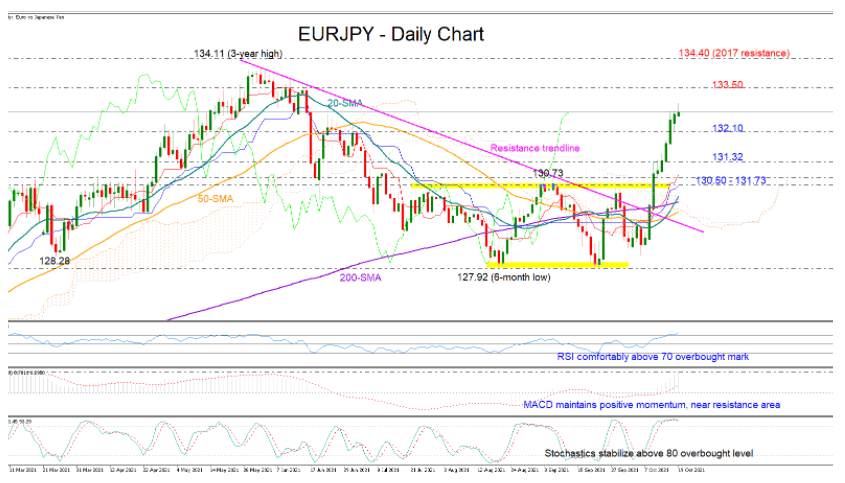
EURJPY Nonstop Rally Hits 4-Month High, Rally Overstretched
EURJPY bulls are leading for the eighth consecutive trading day, stretching their spectacular rally to a four-month high of 133.00 on Tuesday.
While the bullish run is not showing any signs of exhaustion in the daily chart, the RSI and the Stochastics are raising some caution as the indicators are comfortably located in the overbought territory, suggesting limited room for improvement. Note the MACD is also hovering near a familiar resistance zone.
The 133.00 psychological level could be an ideal pivot point, but if it fails to act as resistance, the 131.50 barrier from June could immediately take control, preventing any progress towards the 3-year high of 134.11 and the 2017 bar of 134.40. Beyond the latter, buying pressure may accelerate with scope to test the 2017 and 2018 tops registered within the 136.50 – 137.00 area.
If the pair changes course, Monday’s floor of 132.12 may attempt to cool any selling forces before a more aggressive downfall develops towards the 131.21 handle. Lower, the spotlight will fall on the key 130.73 – 130.50 restrictive zone, a break of which would switch the short-term outlook back to neutral.
In brief, buying appetite is still evident in EURJPY, though a slowdown succeeding a strong weekly positive expansion cannot be ruled out.
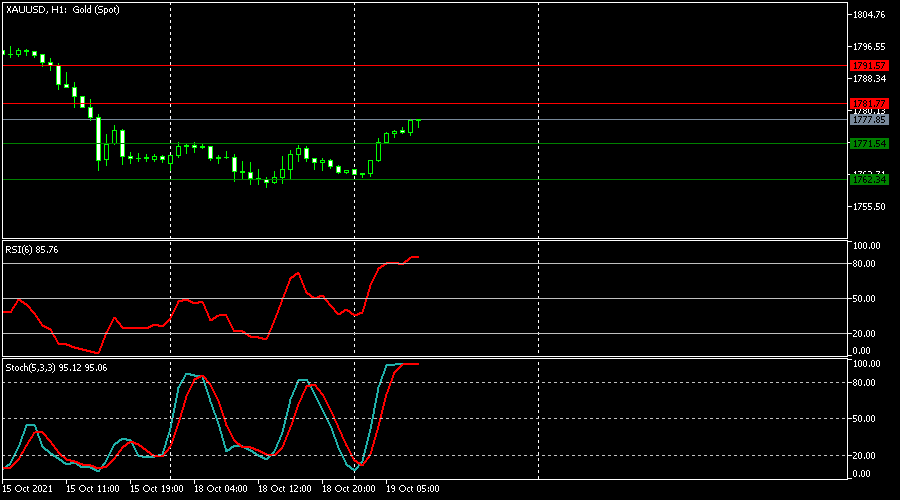
XAUUSD Is Possibly Bearish
Technical analysis
The RSI is at the overbought zone
The Stochastics is at the overbought zone
Most likely scenario - SELL
Target prices: 1,771.54 1,762.34
Alternative scenario - BUY
Target prices: 1,781.77 1,791.57
Key levels
Support 1,771.54 1,762.34
Resistance 1,781.77 1,791.57
ECB Villeroy said French economy to be back to pre-pandemic level by year end
ECB Governing Council member, Bank of France Chairman Francois Villeroy de Galhau said he expected the French economy to be back to pre-pandemic level by year-end. He acknowledged that the auto sector was underperforming, but "areas of the economy are doing well."
He also emphasized "there is still big difference in terms of rising energy prices and overall total inflation." He expected inflation to get back to below 2% level by the end of next year.
"So today there is no reason, for example, for the European Central Bank to raise interest rates next year." Though, "we remain very vigilant on inflation," he added.
Regarding the risk of China's Evergrande turning into a Lehman Brothers, Villeroy said "history is not in the process of being repeated". "I think that Evergrande is mainly a Chinese problem," he added.
Daily Technical Analysis
EUR/USD
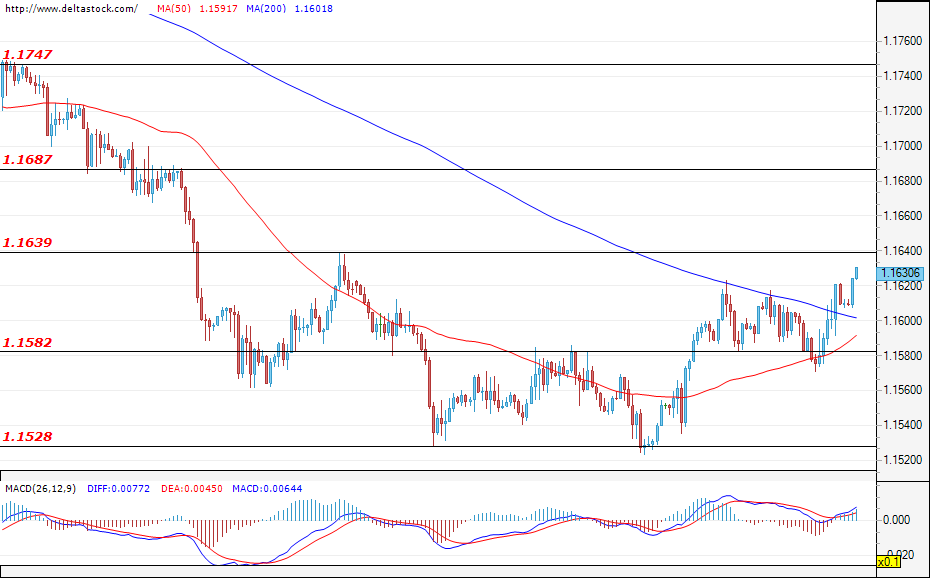
Current level - 1.1630
The currency pair continues its corrective phase after it had previously reached the local bottom of 1.1582 and, at the time of writing the analysis, the EUR/USD is headed towards a test of the resistance level of 1.1640. A successful breach would allow the bulls to attack the resistance zone of 1.1690. Alternatively, if the test fails, the most likely scenario would be for the pair to retrace and consolidate at around 1.1580. During today’s session, volatility could spike when the data for the building permits for the U.S. is announced (12:30 GMT).
| Resistance | Support | ||
| intraday | intraweek | intraday | intraweek |
| 1.1640 | 1.1750 | 1.1582 | 1.1410 |
| 1.1687 | 1.1800 | 1.1528 | 1.1280 |
USD/JPY
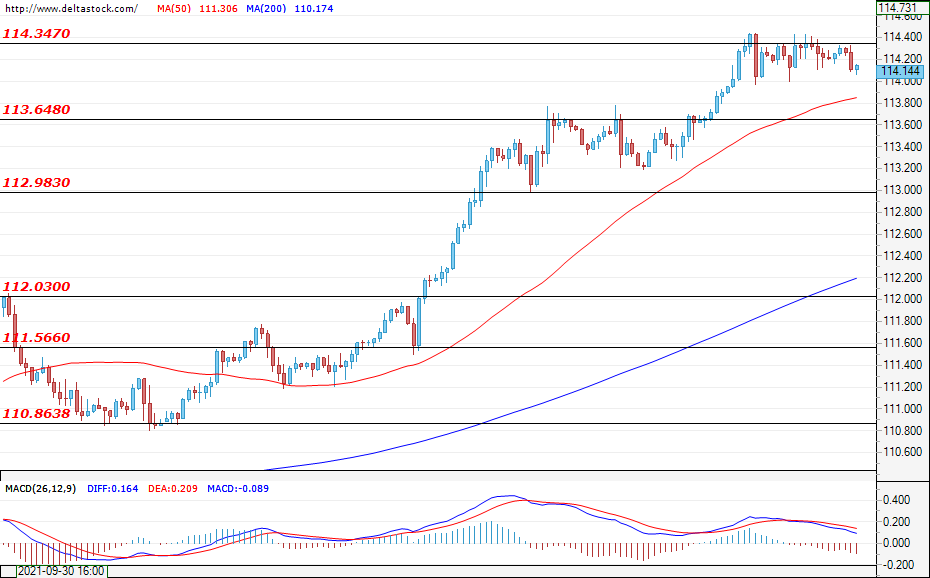
Current level - 114.14
The currency pair is facing difficulties in overcoming the local resistance of 114.34 as it made a couple of unsuccessful attempts to breach it lately. The two possible scenarios are for the pair to consolidate at 114.10 or to enter a corrective phase and test the support of 113.64, but both are expected to lead to a new test of 114.34, which would pave the way for the pair towards the 115.60 zone.
| Resistance | Support | ||
| intraday | intraweek | intraday | intraweek |
| 114.34 | 117.90 | 113.64 | 112.00 |
| 115.60 | 118.50 | 113.00 | 111.56 |
GBP/USD
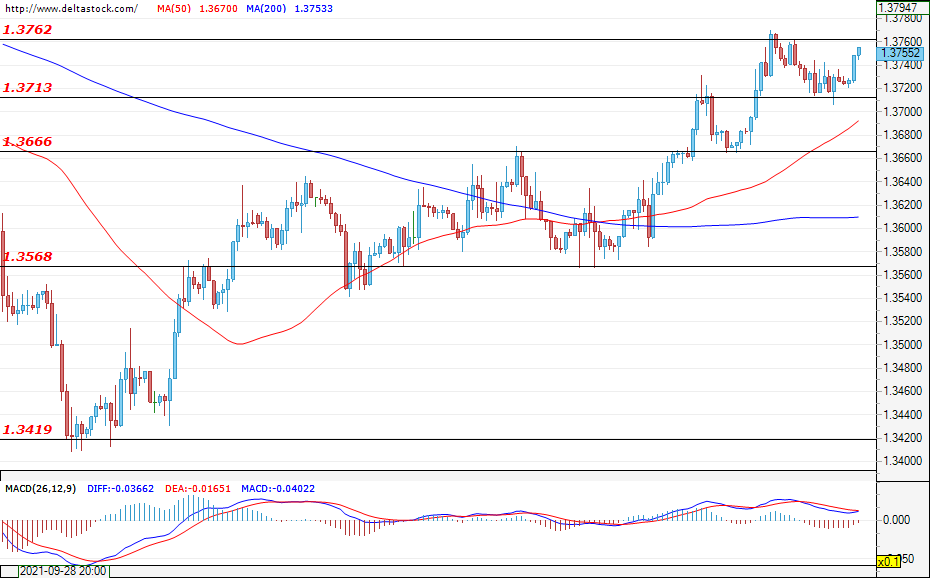
Current level - 1.3755
The pound continues to appreciate against the dollar as the pair managed to breach the key resistance level of 1.3713 and is now headed towards a test of the next resistance of 1.3760. The expectations are positive – for a new breach and rise towards the resistance zone of 1.3830. In the negative direction, the first support is found at the former resistance level of 1.3713.
| Resistance | Support | ||
| intraday | intraweek | intraday | intraweek |
| 1.3762 | 1.3830 | 1.3713 | 1.3570 |
| 1.3830 | 1.3900 | 1.3666 | 1.3420 |
NAS 100 Tests Resistance
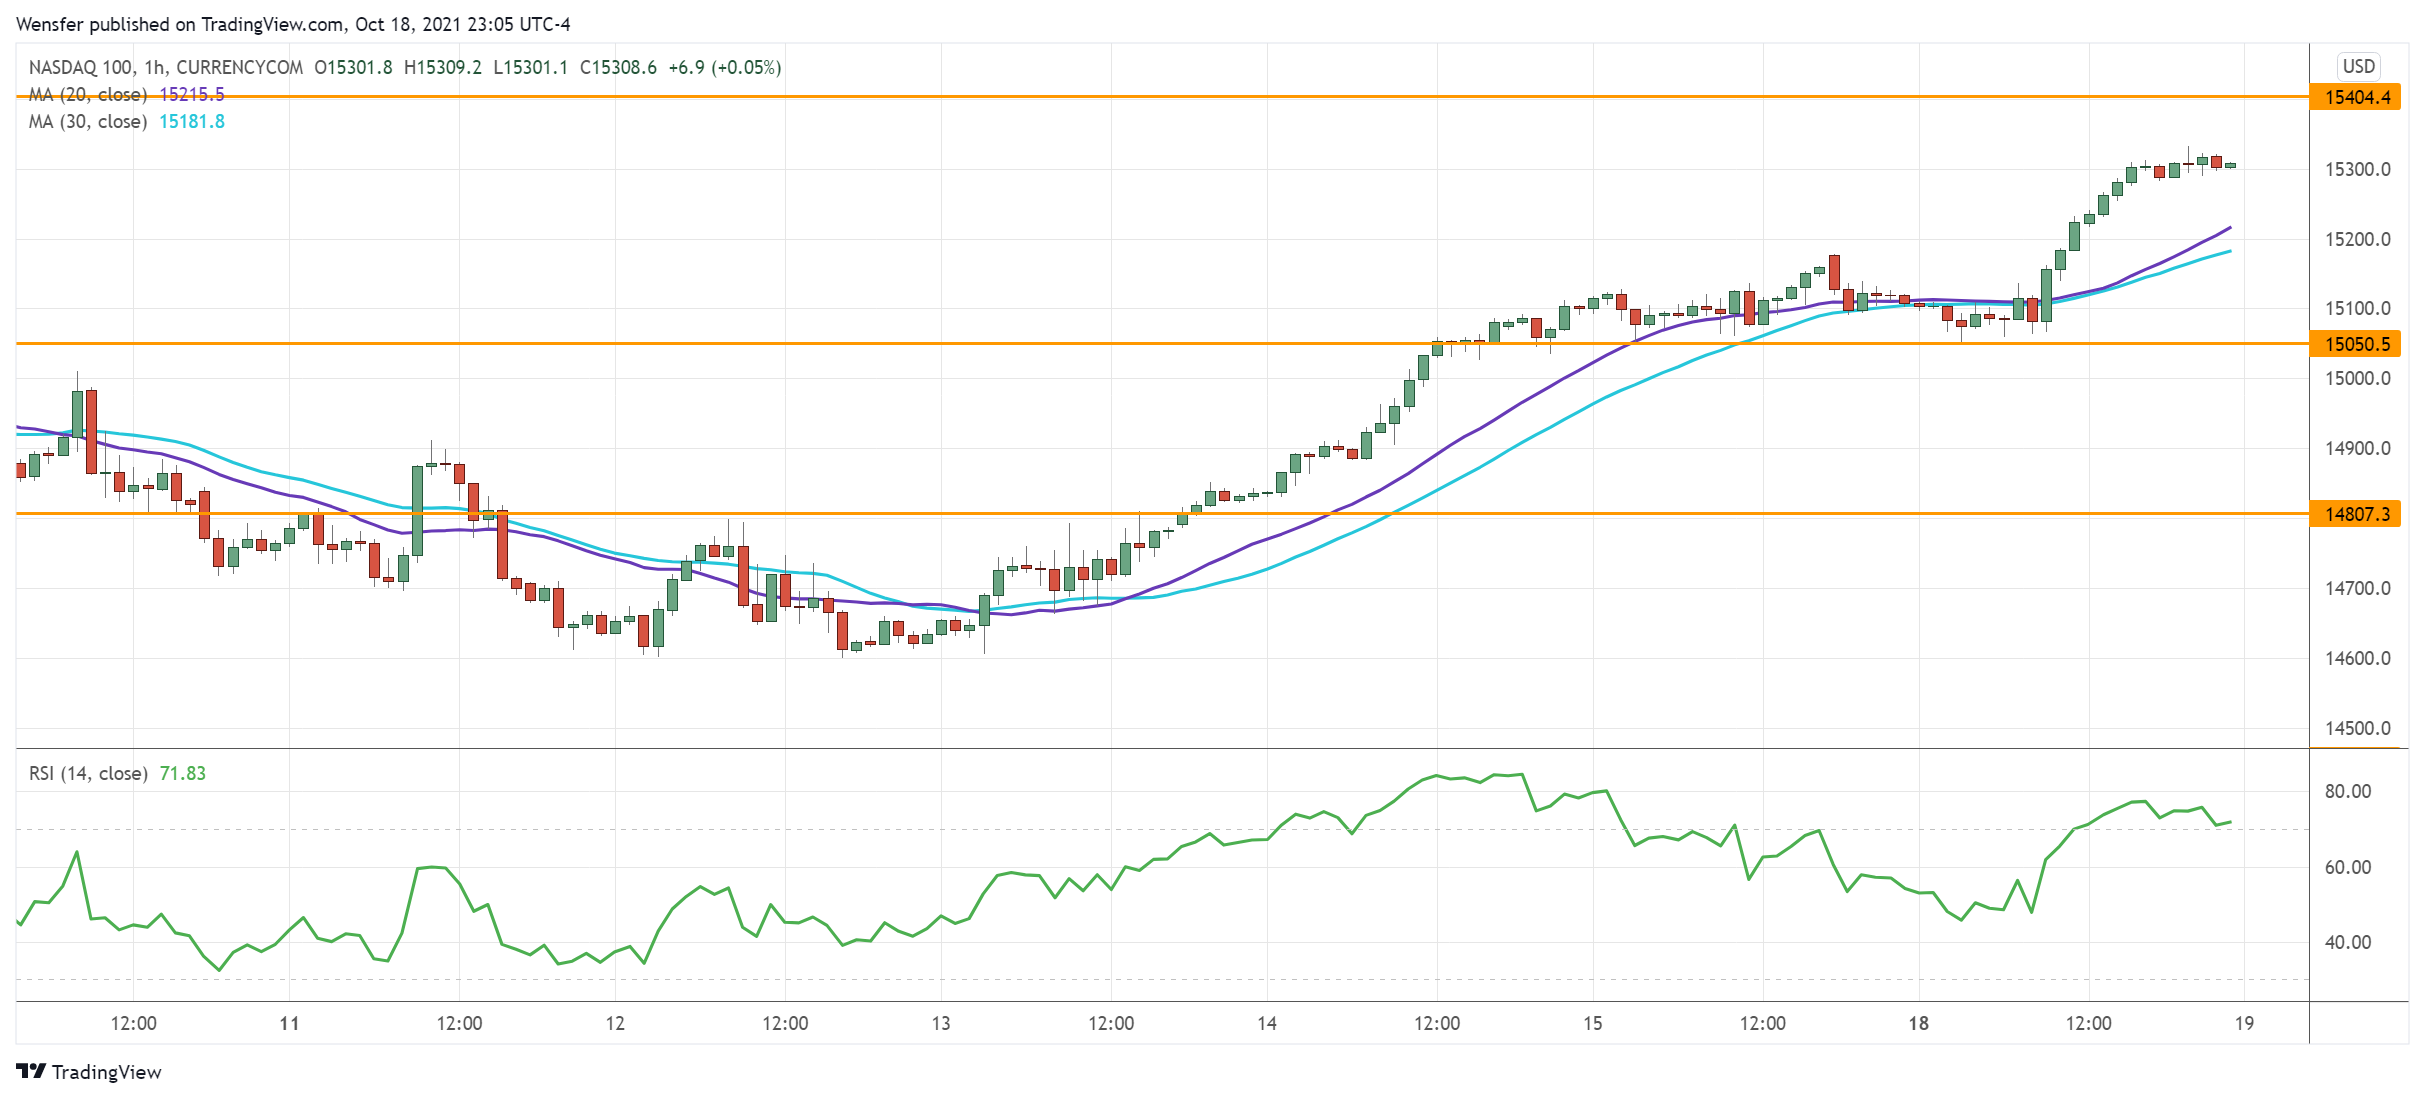
The Nasdaq 100 rallies as investors seem to be feeling confident about the upcoming earnings.
A rebound above the psychological level of 15000 suggests strong buying interest in keeping the rally intact in the medium-term. The RSI’s overbought situation has temporarily held the impetus back. A retracement is likely to attract bids in the vicinity of 15050.
15400 is a major resistance from the daily timeframe and its breach may resume the uptrend above 15700. Failing that, 14800 is a key floor on the downside.
USD/CHF Sees Limited Rebound
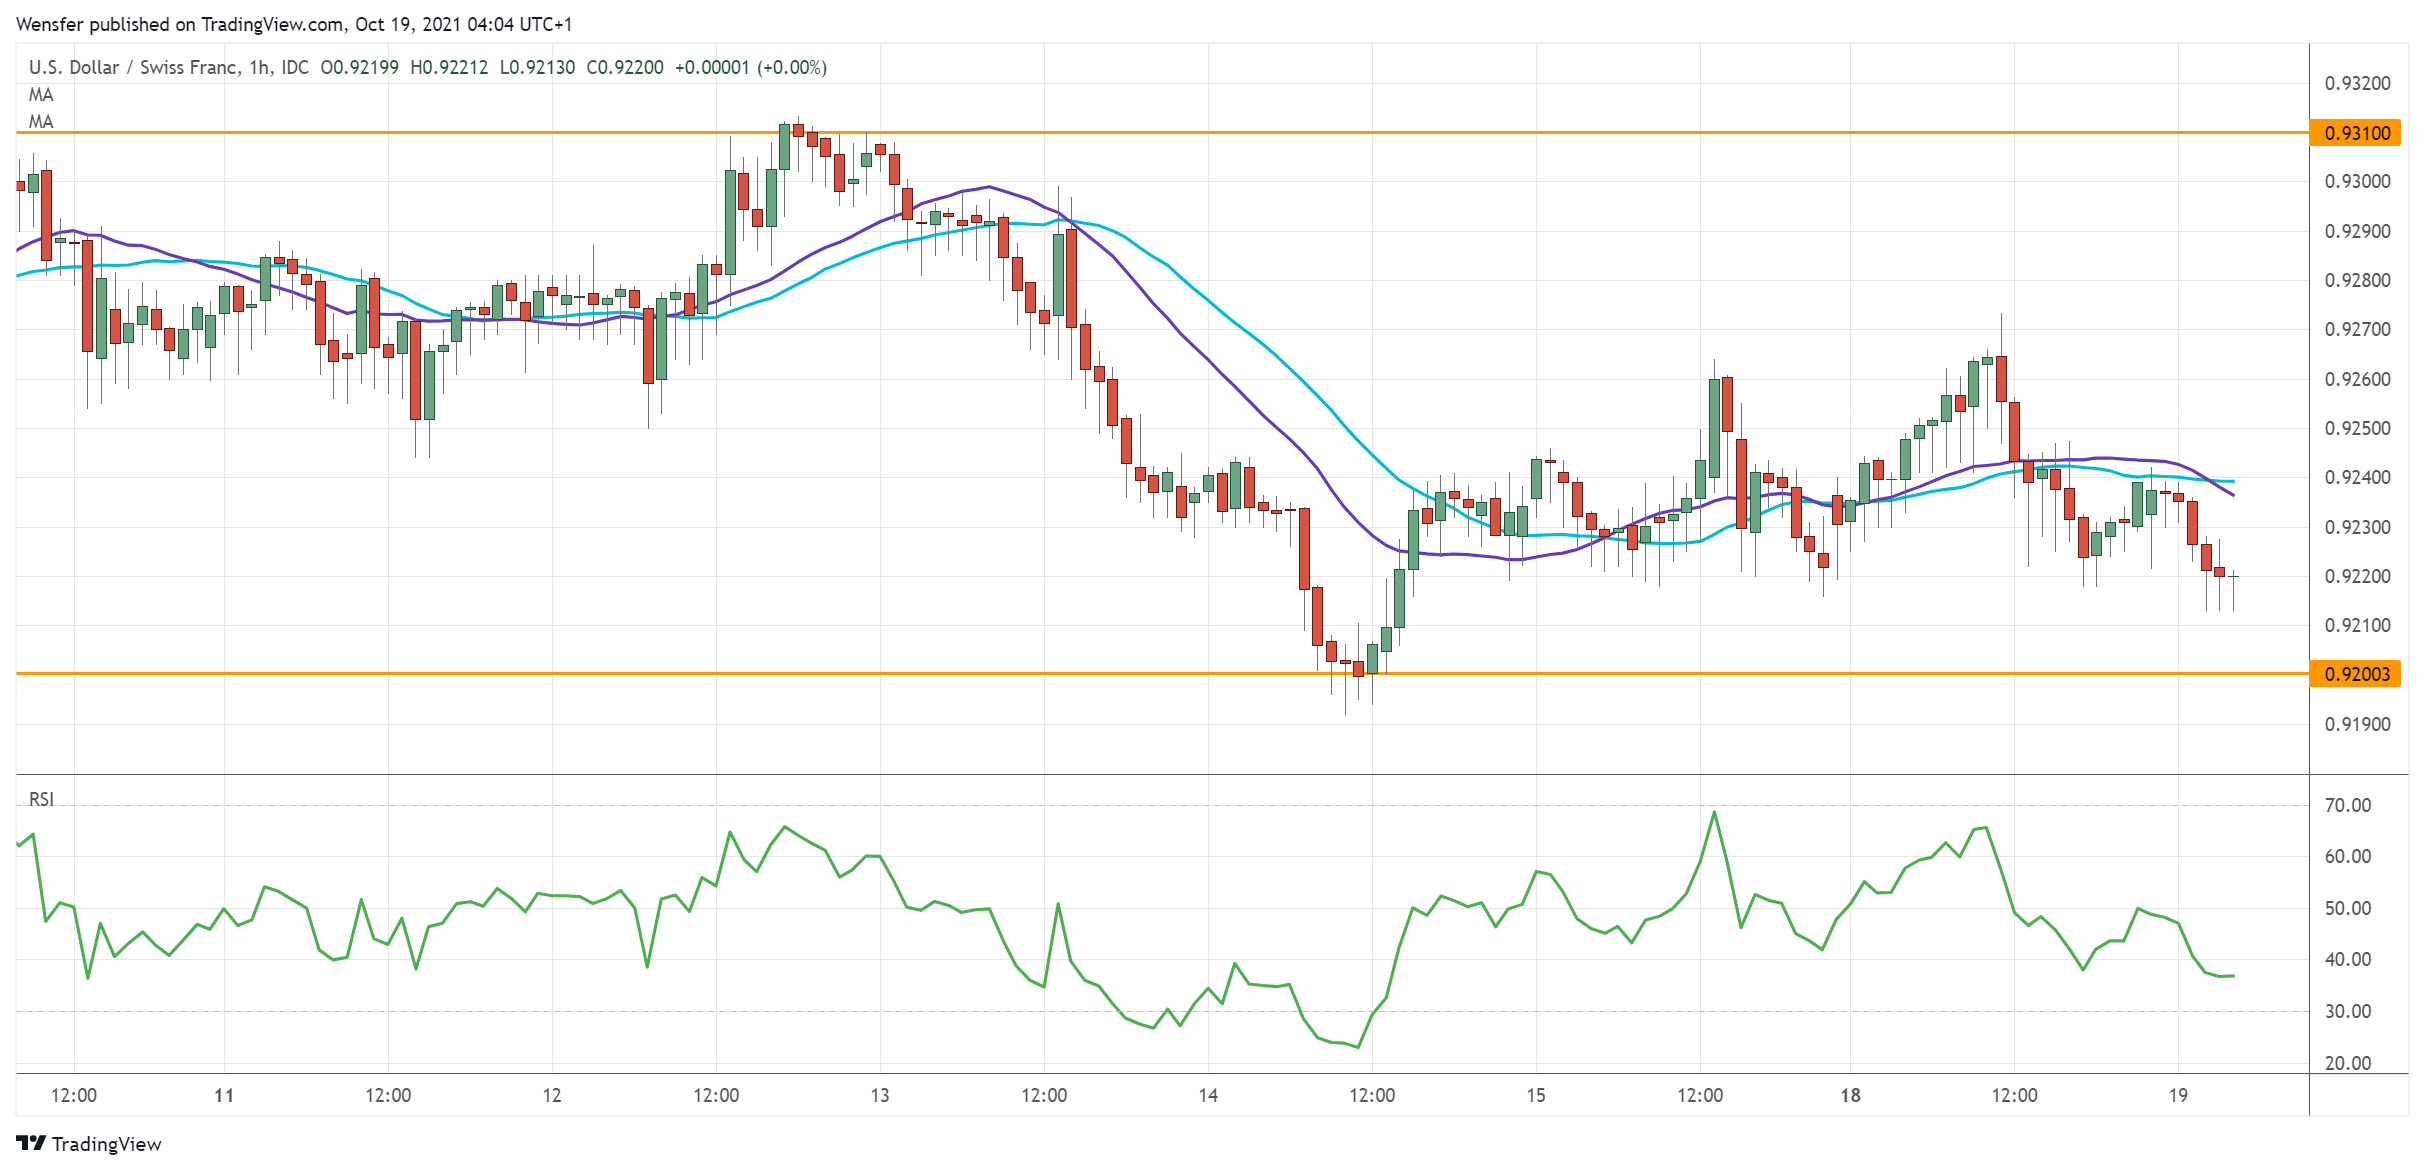
The US dollar recoups some losses supported by recovering Treasury yields.
The drop below the demand zone around 0.9230 has put the bulls under pressure. An oversold RSI has triggered the buy-the-dips mentality at the fresh support at 0.9200.
The buy-side will need to clear the hurdle at 0.9310 to reclaim control of the direction. Otherwise, the latest rebound may be an opportunity for the bears to sell into strength.
A new round of sell-off would send the pair towards the daily support at 0.9100.
AUD/USD Tests Major Supply Zone
The Australian dollar rallied after the RBA expected a return to growth in October’s meeting minutes.
The pair has met stiff selling pressure in the supply zone (0.7460) from the September sell-off. And the RSI is once again in the overbought area. Short-term buyers would be eager to take profit, driving the price lower in the process.
0.7380 is the first support and will test the bulls’ resolve. A bounce above the said resistance would trigger an extended rally. On the downside, a bearish breakout may cause a correction to 0.7320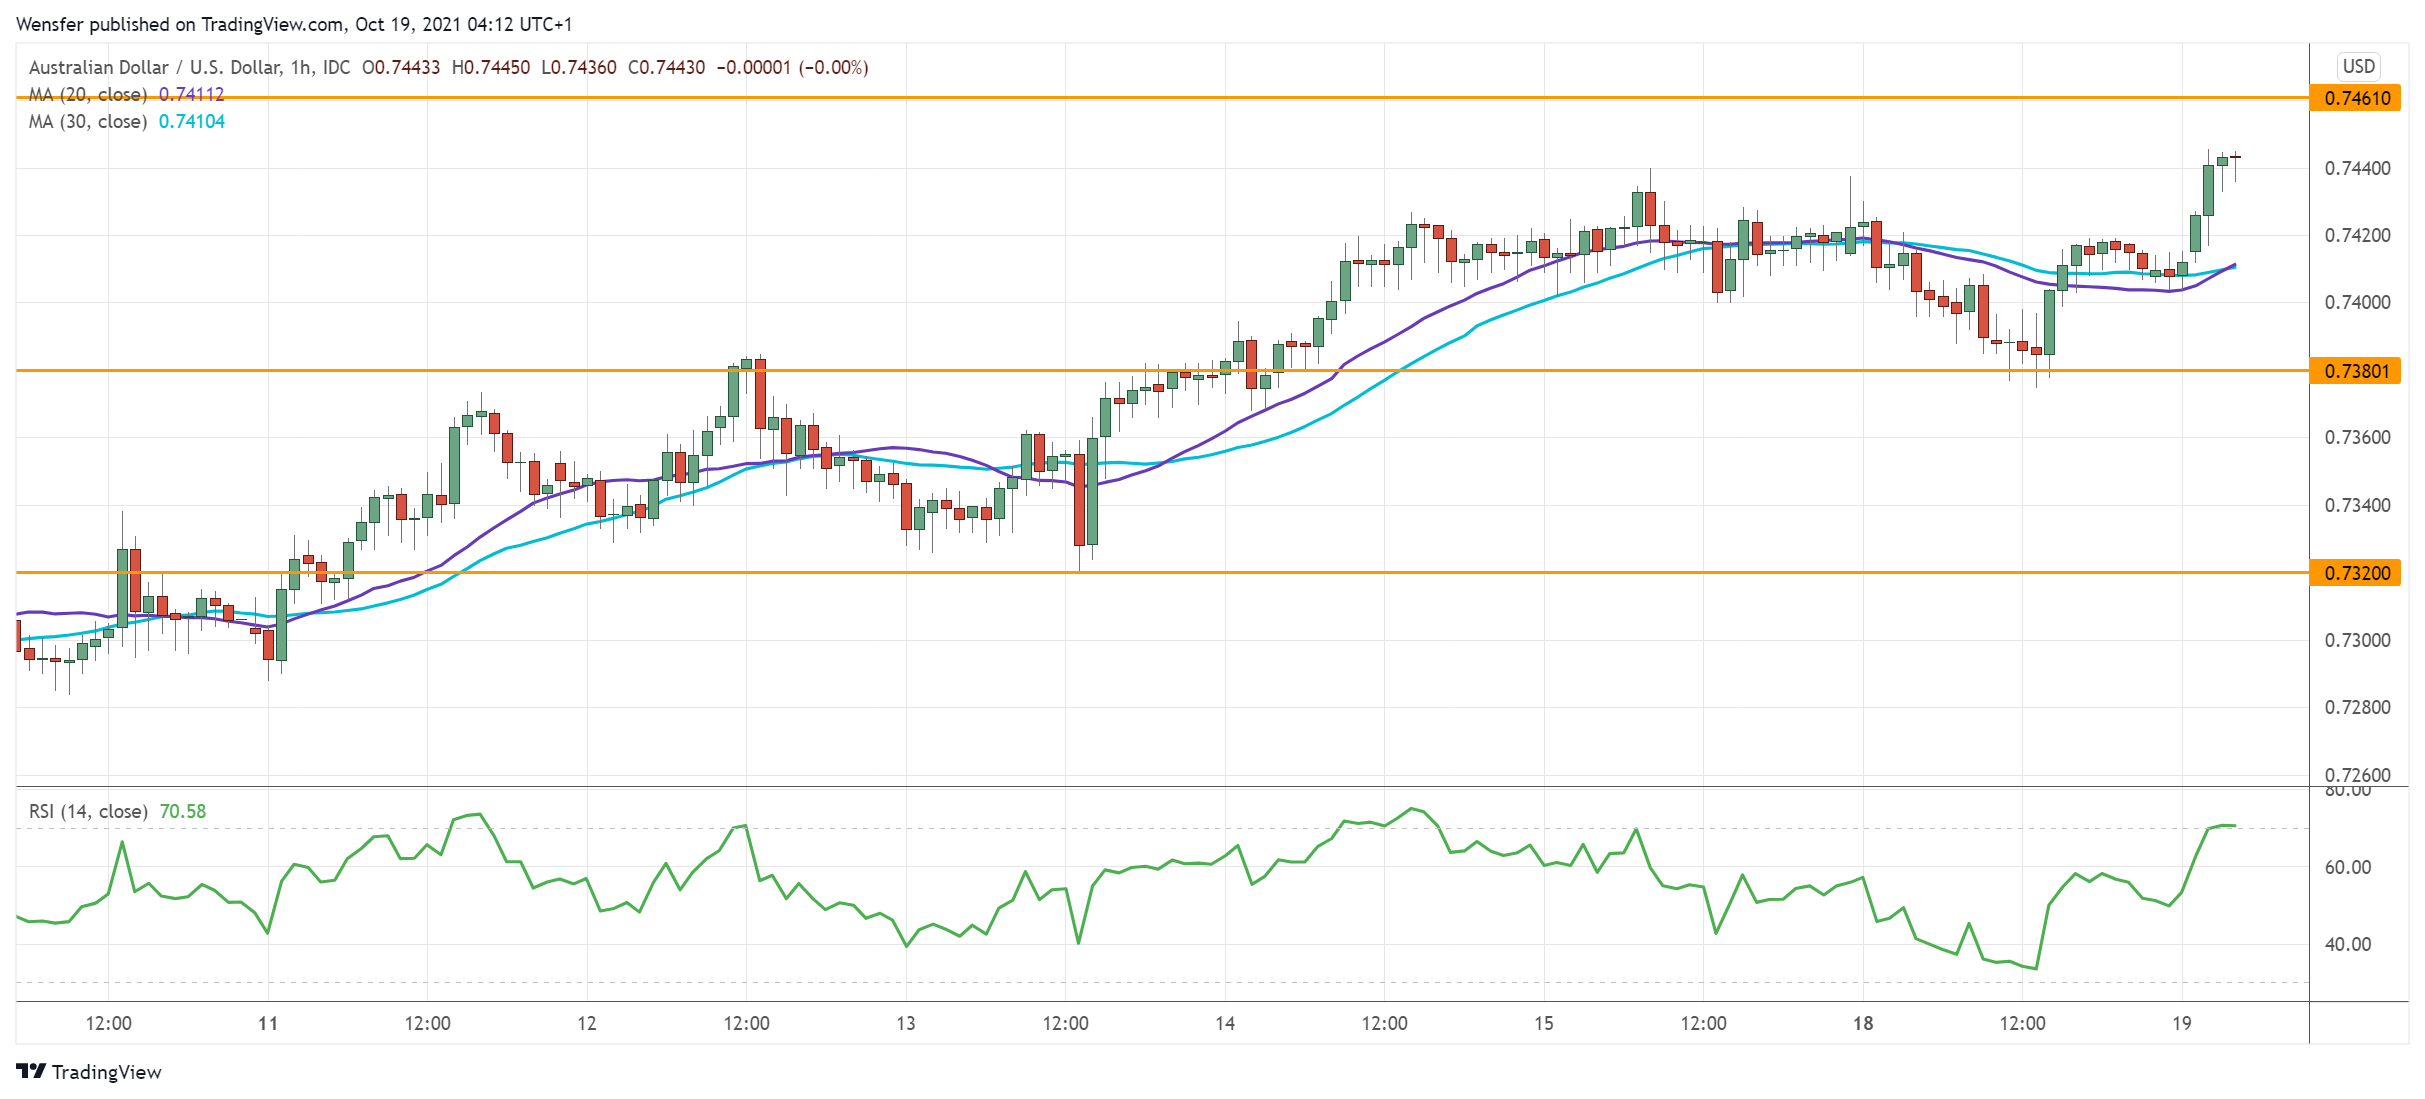
Australian Dollar Benefits From Coal Rush
The Reserve Bank of Australia meeting minutes reminded us that a Delta outbreak interrupts the recovery, but the economy returns to growth in the year's final quarter. Having mostly avoided a significant spread of coronavirus in 2020, Australia has seen a surge in cases since July this year. The number of new cases is reaching a plateau, forcing, among other things, authorities to push back plans to normalise monetary policy. At the same time, the number of covid-related deaths in Australia remains relatively low (10-15 per day) compared to Europe and America, allowing one to expect less damage to the economy and a faster recovery.
The currency market is trying to look beyond the immediate events by paying attention to the energy rush. A jump in coal prices and a resumption of Chinese take-up of Australian raw materials are supporting the Aussie. The AUDUSD has been steadily rising since late September, reaching the area of September highs at 0.7460.
A consolidation above the 0.7500 area promises to be a sign of confidence in the outlook for the Australian economy and currency and signals a break in the moderate downtrend since May this year.
Demand for the Australian dollar is also supported by an increased appetite for risk assets, which is accompanied by moderate pressure on the US dollar. A further rally in the markets would open a direct path for the AUDUSD to rise to 0.7700. However, traders and investors should be prepared for energy demand to remain elevated in the coming quarters.
Moreover, the recovery in exports increases the chances that the RBA will very quickly put a rollback in its bond-buying programme and raised interest rates back on the agenda. In this environment, it should not come as a surprise if AUDUSD consolidates above 0.7800 before the end of the year, and next year confidently rewrites cyclical highs above 0.8100, climbing almost as fast as it went down in 2014-2015.