Sample Category Title
US Dollar Index Outlook: Extended Pullback From One-Year High Warns Of Deeper Correction
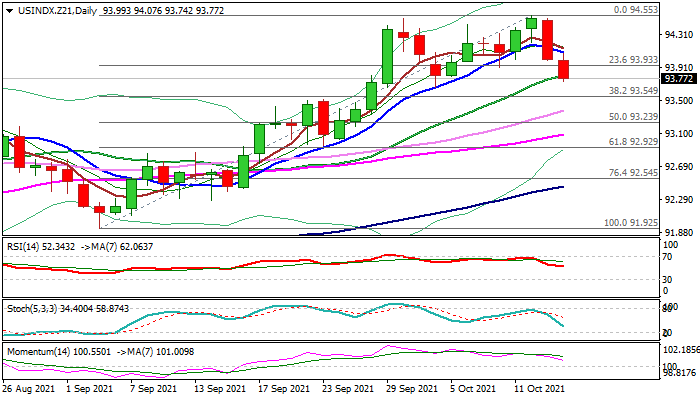
The dollar extends lower on Thursday, following Wednesday's 0.52% drop, with Wednesday's close below 10DMA (94.14) and today's drop through Fibo 23.6% of 91.92/94.55 upleg, generating initial reversal signal.
After minor negative impact from downbeat US jobs data, which were seen as temporary, investors got disappointed after the minutes of FOMC's September meeting showed that the Fed is all but certain about start tapering of stimulus this year and increased concerns that high inflation could persist.
Larger bulls stalled on approach to 200WMA (94.63) and the price slipped from one-year high (94.55), leaving a double-top on daily chart.
Thursday's action broke below rising 20DMA (93.80) and eye pivotal Fibo support at 93.54 (38.2% of 91.92/94.55), violation of which would confirm reversal and risk drop towards 93.23 (50% retracement) and 93.08 (55DMA).
Broken 5/10DMA's turned south and converging, in attempt to form bear-cross and add to negative signals.
Sharp loss of bearish momentum on daily chart and south-heading indicators contribute to negative near-term outlook.
Res: 93.93, 94.09, 94.43, 94.55.
Sup: 93.66, 93.54, 93.37, 93.23.
USD/CAD Bearish SHS Pattern Is Making A Continuation Pattern
USD/CAD Technical analysis
- USD/CAD has formed a bearish chart pattern.
- Shoulder Head Shoulder formation on Daily TF.
- Breakout below the neckline is in progress.
- Target is Between W L3 and M L5 camarilla.
Daily chart USD/CAD
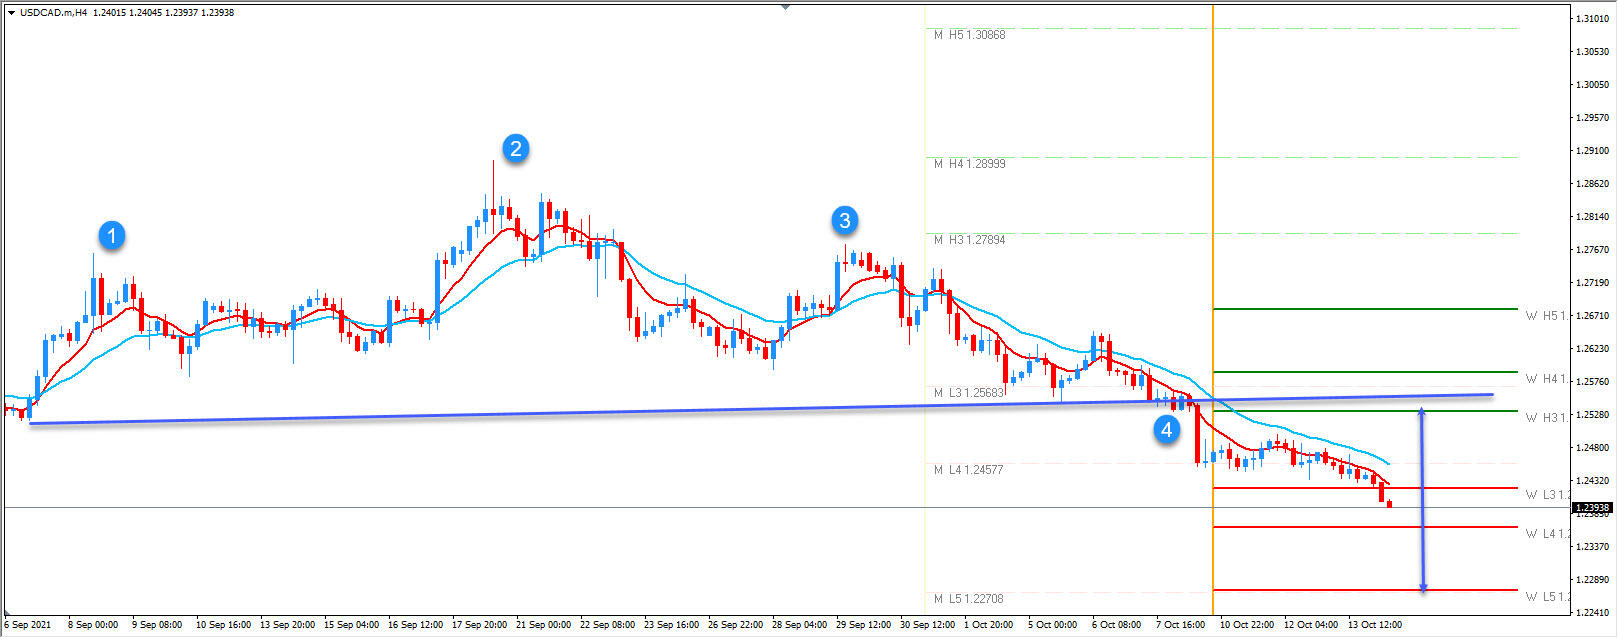
- Left Shoulder.
- The Head.
- Right Shoulder.
- The break below the neckline.
We can see that the price is breaking below the neckline. Shoulder Head Shoulder bearish pattern is in progress. Any retest of the trend line might be used by bears to reject the price lower again. After yesterday's FOMC the dollar is losing ground rapidly against commodities such as CAD and GOLD. Next targets are camarilla pivots WL3 and ML5 which is 1.2350-1.2270. Selling the rallies continues.
Stocks And Gold Recover As Fed Path Gets Recalibrated
- Expectations of earlier but shallower Fed rate path revive optimism
- Dollar retreats, stocks and gold recover as long-dated yields drop
- China’s factory prices soar, central bank speakers in focus
Fed repricing
Investors are having second thoughts about the structure of the Fed’s rate hike cycle. The latest moves in the bond market suggest the FOMC will pull the hike trigger early to tame inflation but the final destination in rates won’t be very high. In other words, an earlier but shallower rate path.
This is evident by the yield curve flattening, with short-term Treasury yields rising yesterday while longer-term yields fell after the release of US inflation data and the minutes of the latest Fed meeting. Inflation remained hot with consumer prices rising 5.4% in yearly terms, chipping away at the ‘transitory’ narrative as price pressures seem to be broadening out.
Meanwhile, the minutes revealed that the Fed is planning to reduce its asset purchases by $15bn per month, starting in mid-November or mid-December. In fact, ‘several’ participants indicated they would prefer an even faster pace. However, this group probably includes Kaplan and Rosengren who have already left the FOMC, so the hawkish signal should be taken with a pinch of salt.
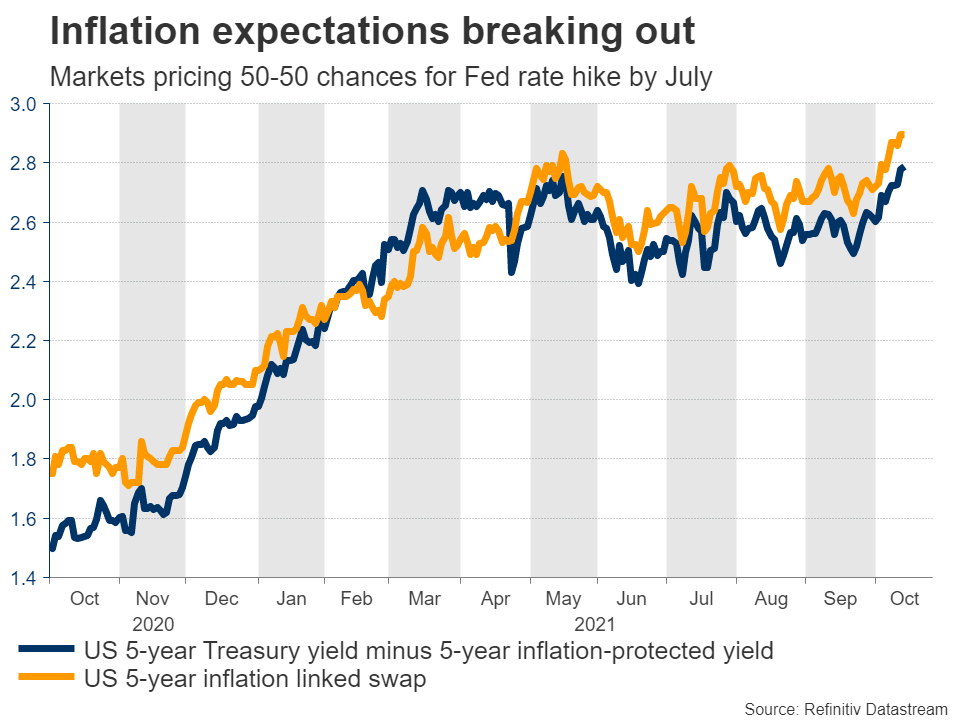
Inflation expectations have moved higher since this meeting thanks to the meteoric rise in energy prices, so markets concluded the Fed may be forced to tighten earlier to break this spiral, although its early actions imply rates won’t need to rise too high overall. Another explanation is that investors think any premature tightening will ultimately backfire.
Optimism returns
In the markets, the drop in longer-dated yields overshadowed everything else, breathing life back into equities and gold prices. Yield-sensitive tech and growth stocks benefited the most as traders grew more confident that the Fed won’t risk a repeat of the late-2018 market crash, which was triggered by rates rising too far.
The optimism has carried over into today’s session, with Wall Street futures pointing to another positive open. That said, the technical structure still argues for caution as the S&P 500 and the Nasdaq have been unable to record a higher high yet, even if ‘stagflation’ worries have taken a back seat. There’s also a barrage of earnings releases coming up from Bank of America, Citigroup, Wells Fargo, and Domino’s Pizza.
Gold capitalized on the drop in longer-dated yields and the pullback in the dollar, shooting higher to meet resistance near its 200-day moving average. If yields continue to ease as traders bet that the terminal Fed rate will be lower, that would be fertile ground for bullion to extend its latest gains.
However, any such gains should be viewed as a rebound within a broader downtrend, not a trend reversal. Inflation expectations keep grinding higher along with oil prices, so inflation worries could return at any moment to drive yields higher. In a sense, gold is at the mercy of the bond market, which in turn remains at the mercy of the volatile energy market for now.
Dollar eases, loonie climbs
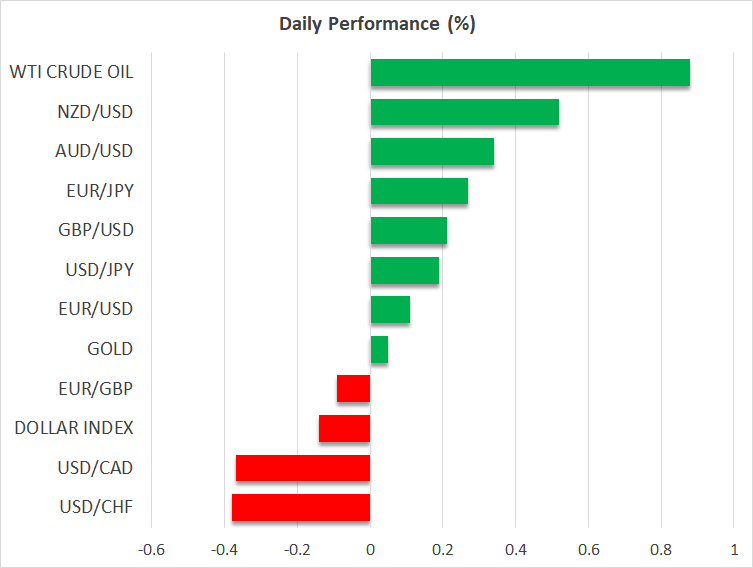
In the FX spectrum, the dollar suffered some minor injuries from the latest gyrations in yields, although the yen has been much weaker this week. The main beneficiaries have been the commodity-linked currencies, and especially the Canadian dollar that is riding the rally in oil prices.
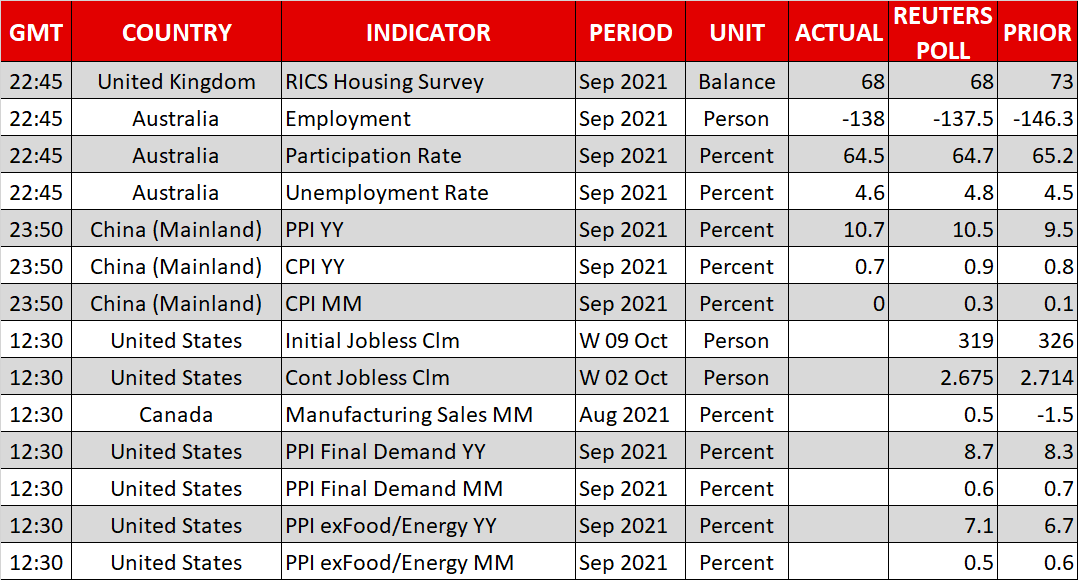
Meanwhile, the inflation story will remain front and center today with the release of US producer prices. China’s own factory prices accelerated to 10.7% in yearly terms according to data released overnight, feeding concerns that the nation will begin exporting even more inflation abroad.
Finally, there’s also a central bank charm offensive on the agenda. We will hear from the Bank of England’s Tenreyro (10:10 GMT) and Mann (14:40 GMT), while across the Atlantic, the Fed’s Bullard (12:35 GMT), Bostic (14:00 GMT), Daly and Williams (both 17:00 GMT) will deliver remarks.
Market Mood Improves On Recovery Hopes, Gold Eyes $1800
Markets in Asia were mostly higher on Thursday, tracking the positive overnight cues from Wall Street as investors evaluated the U.S inflation data and latest minutes from the September Fed meeting. The improving sentiment across Asian markets was also helped by optimism over the global economic recovery and prospects of higher interest rates to tame inflation. The greenback had it rough while gold enjoyed its best session in seven months, gaining almost 2% helped by falling Treasury yields. European markets have opened higher this morning with US futures also in the green.
Dollar humbled by inflation data
The dollar weakened across the board yesterday in a ‘buy the rumour, sell the fact’ reaction following the hot U.S inflation report. Consumer prices in the United States increased 5.4% year-over-year in September after advancing 5.3% in August and 0.4% versus expectations of 0.3% on the month. The decline in Treasury yields dragged the greenback lower with the Dollar Index (DXY) tumbling towards the 94.00 level. While the firm inflation data reinforced taper expectations, it has also fuelled speculation around the Federal Reserve raising interest rates sooner than expected. This has been reflected in Fed Funds futures which have pulled forward the first interest rate hike from late 2022 to almost a full 25 basis point hike by September. The prospects of higher interest rates down the line could limit the dollar’s losses.
Fed officials see tapering in Q4
According to the minutes from September’s policy meeting, Federal Reserve officials agreed they should start tapering in mid-November or mid-December. In regard to inflation, most officials at the meeting expressed concerns over the associated risks due to supply disruptions and labour shortages. Overall, the minutes were hawkish and confirmed that tapering could start as early as next month.
Oil bulls remain in the building
Oil is continuing its upward trend, driven by the global energy crunch and supply restraints from the world’s top producers. The commodity found itself under pressure on Wednesday thanks to OPEC’s monthly report and the American Petroleum Institute reporting a larger-than-expected increase in stockpiles. OPEC cut its global demand outlook for 2021 from 5.96 million barrels per day (bpd) to 5.82 million bpd due to the Delta variant outbreaks in the summer. However, it left its forecast for 2022 unchanged at 4.15 million bpd.
All eyes will be on the Energy Information Agency (EIA) U.S crude oil inventory report and the International Energy Agency (IEA) monthly oil market report today. If they illustrate a similar outlook to OPEC, where the demand is projected to decline in 2021, this could impact upside gains.
Both WTI and Brent crude have appreciated over 60% since the start of 2021. With Brent trading around $83.88 as of writing, some analysts are targeting the psychological $100 level in 2021 which has not been seen since 2014.
Commodity spotlight - Gold
Gold prices exploded higher on Wednesday afternoon, gaining almost 2% as the dollar and Treasury yields tumbled following the hot US inflation report. With gold highly sensitive to taper expectations, real yields and the dollar’s direction, the next few weeks could be wild for the precious metal.
In regard to the technical picture, the widely watched 200-day moving average is just below $1800. But a strong move above that level could open the doors towards the summer highs at $1834. Should $1800 prove to be reliable resistance, a decline back towards $1777 could be on the cards.
BoE Tenreyro: Self-defeating to try to respond to short-lived effects on inflation
BoE MPC member Silvana Tenreyro said, "part of increasing inflation we have seen so far is arithmetic base effects compared to a low level of prices last year." And that in part has seen "driven by global prices in energy and other commodities which push up on inflation". And, "these effects in general tend to be short-lived.
Additionally, there were "temporary supply disruptions caused by the various imbalances in the global economy as it recovers from Covid", with some countries still in lockdown. Demand was also boosted "far more by fiscal stimulus in some countries than others", like the US.
"So typically, for short-lived effects on inflation, such as the big rises in the prices of semiconductors or energy prices, it would be self-defeating to try to respond to their direct effects," she said. "By the time interest rates were having a major effect on inflation the effects of energy prices would already be dropping out of the inflation calculation. If some effects were to prove more persistent it would be important to balance the risks from a period of above target inflation with the cost of weaker demand."
High Inflation In The US May Be Delayed For Serveral Quarters
US stock indices ended yesterday's trading without a single trend. The Dow Jones index has not changed much, while the S&P 500 and Nasdaq added 0.3% and 0.73%, respectively. According to the Fed meeting, in September, the Fed leaders discussed the plan of cutting the quantitative easing program (QE), holding the view that the reduction of asset purchases should begin by the end of this year and be completed by mid-2022. The reduction in asset purchases could begin in mid-November or mid-December. Fed officials also pointed to risks that inflation would take longer than expected, especially if labor and other resource shortages will be more constant.
The US Consumer Price Index increased to 5.4% (expected 5.3%), the largest annual gain since 2008. The core CPI, which excludes food and energy prices, remained at level of 4%. On the back of this news, the dollar index was losing ground yesterday.
Apple stock fell by almost 10% since the beginning of September and decreased by 2% in yesterday's trading after the company released news on the limitation of production goals.
Former US President Donald Trump blasted the presidency of his successor, Joe Biden, in a message on Wednesday. "COVID is raging out of control, our supply chains are crashing with little product in our stores, we were humiliated in Afghanistan, our Border is a complete disaster, gas prices and inflation are zooming upward—how’s Biden doing? Do you miss me yet?" said Trump.
Famous companies reporting today are Taiwan Semiconductor, UnitedHealth, Bank of America, Wells Fargo&Co, Morgan Stanley, Citigroup, Domino's Pizza Inc.
European stock indices traded mixed yesterday. German DAX and French CAC 40 closed with solid gains of 0.7% and 0.8%. At the same time Italian FTSE MIB and Spanish IBEX 35 indices decreased by 0.1% and 0.6%, respectively. The energy crisis, problems in the supply chain and inflationary pressures continue to pressure on the market. EU energy ministers will hold an emergency meeting on October 26 to address the energy problem. Deutsche Bank's CEO urged the European Central Bank to review monetary policy in light of rising inflationary threats.
Nyrstar, one of the world's largest zinc metal producers, is shutting down up to 50% of its production in Europe due to soaring energy costs. Zinc prices are skyrocketing.
Oil prices resumed their growth after a slight decline the day before. The market is still under pressure by the energy crisis in Europe and Asia, which contributes to increased demand for oil with a restrained increase in production by OPEC+ countries. The US EIA raised its 2021 Brent crude oil price forecast from $68.6 to $71.4 per barrel. The White House is in talks with US oil and gas producers about how companies can help lower oil prices.
The last time oil was above $80 per barrel (2014), the US and European oil and gas companies were trading at levels 1.5 to 2 times higher than they are now. The key difference this time is that trillions of investment dollars are now associated with environmental and social regulations that prohibit exposure to dirty energy.
Gold prices jumped 2% after US inflation data. But analysts are confident that the rise in gold and silver prices is temporary, as prices for these metals will fall rapidly when the QE program is cut.
Asia's largest refiner, which is based in China, intends to cut fuel exports as it wants to keep more supplies for domestic consumption amid an energy crisis caused by coal shortages.
China's inflation has remained roughly the same, but the gap between producer and consumer inflation widened in September to 10%, the highest level since 1993.
Main market quotes:
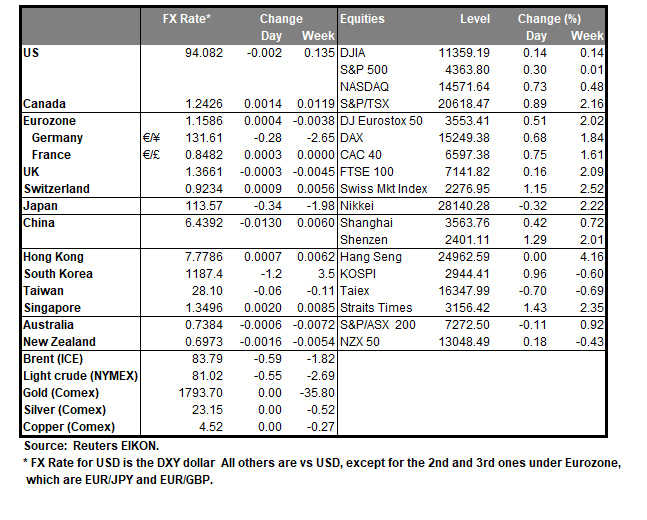
- S&P 500 (F) 4,363.80 +13.15 (+0.30%)
- Dow Jones 34,377.81 −0.53 (−0.002%)
- DAX 15,249.38 +102.51 (+0.68%)
- FTSE 100 7,141.82 +11.59 (+0.16%)
- USD Index 94.03 −0.48 (−0.51%)
Important events for today:
- Australia Unemployment Rate (m/m) at 03:30 (GMT+3);
- China Consumer Price Index (m/m) at 04:30 (GMT+3);
- China Producer Price Index (m/m) at 04:30 (GMT+3);
- Japan Industrial Production (m/m) at 07:30 (GMT+3);
- US Producer Price Index (m/m) at 15:30 (GMT+3);
- US Initial Jobless Claims (w/w) at 15:30 (GMT+3);
- US FOMC Member Bostic’s Speech at 17:00 (GMT+3);
- US Natural Gas Storage (w/w) at 17:30 (GMT+3);
- US Crude Oil Reserves (w/w) at 18:00 (GMT+3);
- US FOMC Member Barkin’s Speech at 20:00 (GMT+3).
Inflation And FOMC Minutes Brought Back Demand For Risks
The dollar pulled back from a one-year high area, with US stock markets closing higher on Wednesday and its futures adding in trading in Asia. This performance was a market reaction to inflation data and FOMC meeting minutes. The market was near extremes in several major instruments and indices.
First and foremost, traders should pay attention to the dynamics of the US debt market. Minutes from the September FOMC meeting indicate that tapering could start as early as mid-November, and a rate hike by the end of 2022 is already completely priced into the Fed Funds Rate Futures market. At the same time, two- to three-year bond yields decreased, indicating that policy tightening would start quickly, but after that will be slower than previously expected.
This revaluation wasn’t good news for the dollar, causing the DXY to retreat from 94.6 to 94.0. There is a potential for a further correction with price and RSI divergence and the latter retreating from the overbought area above 70 on the daily charts.
EURUSD is also undergoing a critical test of the latest trend. The daily jump of 0.6% to 1.1600 lifted the pair above the downward resistance line, in force since early September. A consolidation above 1.1600 today would be the first signal to break the upside trend of the dollar, and a rise above 1.1640 promises to be a confirmation signal.
We should point out that this jump in EURUSD is not a strength of the Euro against its peers. It remains near cyclical lows against the pound at 0.8475 in EURGBP and has broken the floor at 1.07 in EURCHF, melting to lows last seen in November.
The S&P500 is also testing its downside resistance. Futures have been trading above it since morning, but we should wait for the reaction of the US market. Better yet, a consolidation above the area of the prior local highs near 4400.
Gold made an almost 2% jump on Wednesday, approaching $1800, the 200-day moving average. A meaningful sign of a bearish trend reversal in gold would be a consolidation above $1800 and confirmation to overcome previous local highs at $1836.
USD Weakens As Inflationary Pressures Confirmed
The USD weakened against a number of its counterparts yesterday as inflationary pressures within the US economy were reaffirmed by the release of the US CPI rates for September. It’s characteristic that the headline CPI rate on a year-on-year level ticked up reaching once again a 13-year high. On the other hand, the Fed September meeting minutes confirmed the Fed’s plans to actually start tapering the bank’s QE program this year and the tapering to be complete by mid-2022. US yields tended to decline and given the USD weakness; gold’s price found the chance to rise as the precious metal is also considered a hedging instrument against inflationary pressures. US stockmarkets marked some small gains yesterday and we expect fundamentals to continue to keep the interest of traders alive, albeit some attention is expected to also be placed on the release of the weekly initial jobless claims figure later today as well as the Fed policymakers which are scheduled to speak today.
The USD index dropped yesterday breaking the 94.10 (R1) support line, now turned to resistance. As the index dropped it also broke the upward trendline characterizing its movement since the 16th of September. As the upward trendline has been broken we switch our bullish outlook in favor of a sideways motion bias initially. Please note that the RSI indicator below our 4-hour chart is between the readings of 50 and 30, implying a small advantage for the bears at the time. Should the bears actually take control over the index’s direction, we may see it aiming if not breaking the 93.70 (S1) support line, thus paving the way for the 93.20 (S2) level. Should the bulls take over we may see the index breaking the 94.10 (R1) resistance line and aim for the 94.60 (R2) level.
Loonie gains as WTI prices continue to rise
The CAD seems to strengthen against the USD, supported by rising WTI prices, but yet for other analysts the yield differential spread in favor of the Loonie is also mentioned. Oil prices gained despite API reporting a wider build up of crude oil inventories as expectations for higher demand for black gold were maintained. We tend to remain bullish for the Canadian currency currently and we note the release of Canada’s manufacturing sales growth rate for August during today’s American session. On the monetary front, BoC’s confidence seems to remain and given the stellar employment data of September we may see the bank accelerating it QE tapering plans, probably also moving to an earlier date any possible rate hikes, thus highlighting its hawkish profile.
USD/CAD continued to drop, and is currently testing the 1.2425 (S1) support line. We tend to maintain a bearish outlook for the pair as long as it remains below the downward trendline incepted since the 30th of September. Please note that the RSI indicator below our 4-hour chart is nearing the reading of 30, confirming the bearish sentiment. Should the selling interest continue to direct the pair, we may see it breaking the 1.2425 (S1) support line aiming for the 1.2330 (S2) level. On the other hand, should buyers take the initiative and direct the pair, we may see it reversing course, breaking the prementioned downward trendline and breaching the 1.2500 (R1) resistance line.
Today’s events and expectations
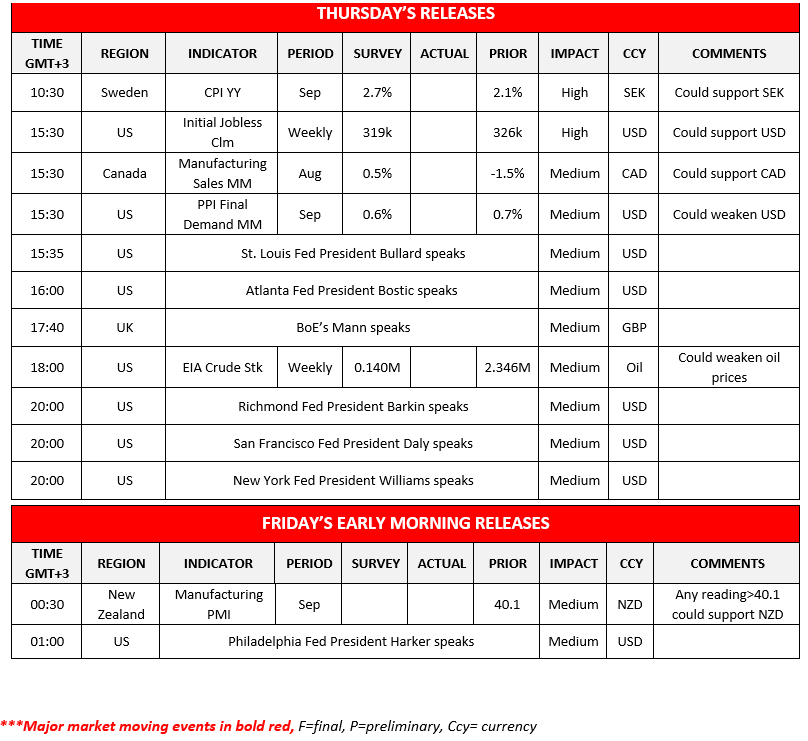
Today during the European session, we get from the Sweden’s CPI rates for September. In the American session we note the US weekly initial jobless claims figure and the PPI rates for September, while from Canada we get the manufacturing sales growth rate for August. On the other hand, oil traders could be more interested in the release of the EIA weekly crude oil inventories figure. During tomorrow’s Asian session we get New Zealand’s Manufacturing PMI figure for September.
USD Index H4 Chart
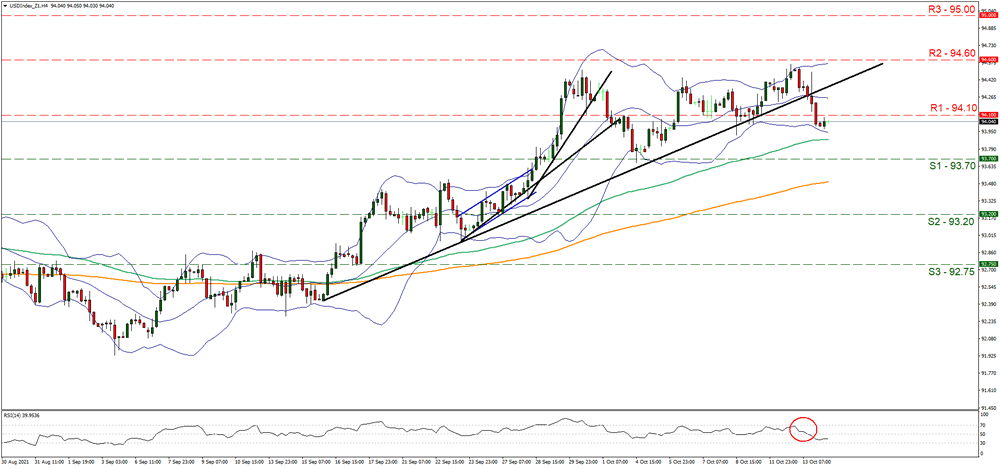 Support: 93.70 (S1), 93.20 (S2), 92.75 (S3)
Resistance: 94.10 (R1), 94.60 (R2), 95.00 (R3)
USD/CAD H4 Chart
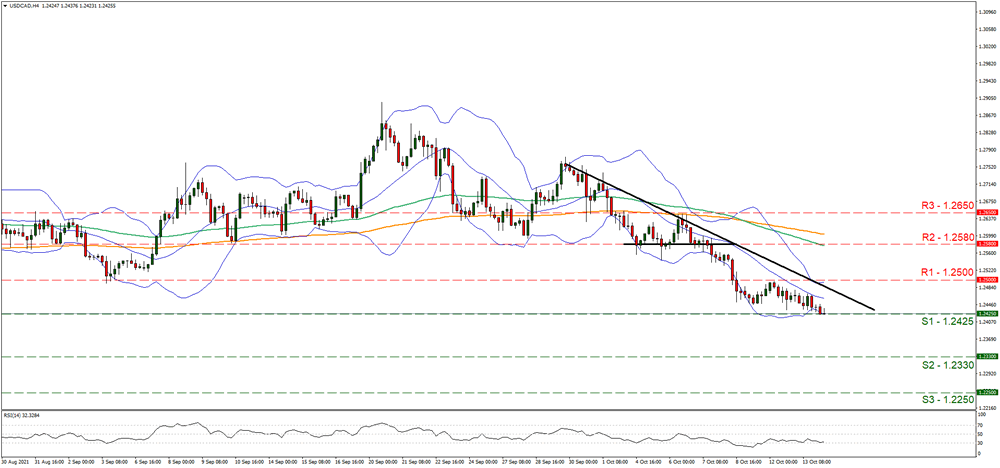 Support: 1.2425 (S1), 1.2330 (S2), 1.2250 (S3)
Resistance: 1.2500 (R1), 1.2580 (R2), 1.2650 (R3)
Oil Trading Sideways, Gold Rallies
Oil prices remain constructive USD
Oil prices traded sideways once again overnight. A much lower US dollar was offset by OPEC’s monthly report which lowered oil demand and a surprise spike in US API Crude Inventories above 5 million barrels. The OPEC report’s impact was negated as it stated that some members would have output challenges over the next few months. Brent crude was unchanged at USD 83.30 overnight, with WTI almost unchanged at USD 80.55 a barrel.
Physical market fundamentals remain positive for oil prices and natural gas prices have resumed their climb in Asia today after a few sideways sessions. That sees Brent crude and WTI adding 0.50% to USD 83.70 and USD 80.95 a barrel in Asian trading.
Speculative long positioning in the futures markets remains heavy leaving open still, the possibility of a sharp sell-off of 5 dollars to 8 dollars a barrel at some stage this week. As I have stated previously though, given the state of play in the physical market, a speculative long culling will be a dip to buy and is likely to be very short-lived in duration. A sharp rise in official US Crude Inventories tonight could provide that catalyst.
Brent crude has resistance at USD 85.00 and USD 87.00 a barrel, with support at USD 82.00 a barrel. WTI has resistance at USD 82.00, with support at USD 78.70 a barrel. The relative strength indexes (RSIs) remain in overbought territory. The higher into overbought territory they go, the deeper the short-term correction lower will be.
Gold stages an impressive rally
Gold prices staged an impressive overnight rally as the US dollar staged a sharp reversal lower as long-dated US yields sank. Despite the noise that inflationary pressures are supporting gold, or haven buying, nothing in that space has materially changed over the past couple of weeks, so to suddenly suggest it miraculously occurred overnight is stretching credibility. At the end of the day, gold is moving inversely to the US Dollar and that is the end of the story. If you live in Turkey or Venezuela, you may want to buy some gold for that reason, otherwise gold remains a hedge for hyper-inflation, not rising inflation.
Gold spiked 1.87% higher overnight, climbing USD 33.00 to USD 1793.00 an ounce as the intra-day momentum attracted fast money looking for a quick buck in price action reminiscent of the crypto space or meme stocks. In Asia, some profit-taking from short-term traders has pushed it back to USD 1790.00 an ounce as, you guessed it, the US dollar rises modestly.
Having broken through USD 1780.00 overnight, gold has interim support at that level followed by USD 1750.00 and USD 1740.00 an ounce. Longer-term support is at USD 1720.00 an ounce. Resistance is between USD 1795.00 and USD 1800.00 region which contains the 100 and 200-day moving averages (DMAs) and is a formidable barrier. That is followed by USD 1810.00 and USD 1835.00 an ounce.
If the US dollar, as I expect, resumes its rally, the overnight price gains will vanish into thin air as the fast-money players exit as rapidly as they arrive. Should the US dollar strength persist though, further gains cannot be ruled out.
AUDUSD Paves Way For Further Progress, Bullish Bias Fragile
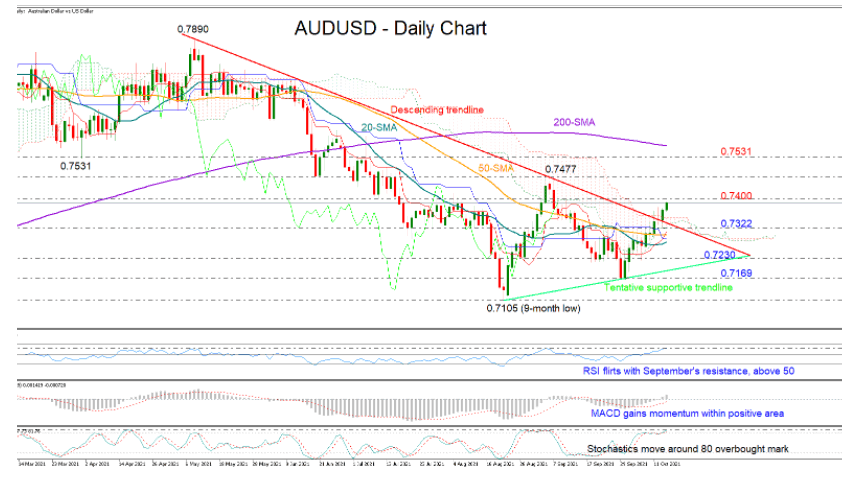
AUDUSD is targeting the 0.7400 level again after successfully piercing the descending trendline drawn from May’s peak of 0.7890 on Wednesday.
The bullish bias is still in place according to the momentum indicators as the MACD continues to grow within the positive area and above its red signal line, and the RSI keeps sloping upwards comfortably above its 50 neutral level. Yet, a careful approach will still be needed since the RSI is flirting with a major resistance territory, while the fast-Stochastics are flattening around their 80 overbought mark for a week now, increasing the odds for a downside correction or some consolidation.
If the 0.7400 bar proves easy to clear, the next challenge could be September’s high of 0.7477. A decisive close higher may reach the key limitations around 0.7531, though a sustainable move above the 200-day simple moving average (SMA) currently at 0.7567 could be a bigger achievement.
Otherwise, a downside reversal may initially seek support near the broken descending trendline and Wednesday’s low of 0.7322. Failure to bounce off the trendline may trigger a steeper decline towards the 0.7230 handle, while not far below, the tentative ascending trendline may prevent a test at the swing low of 0.7169. If not, then the spotlight will shift straight to the nine-month low of 0.7105.
In brief, AUDUSD is in bullish mode, aiming to break into the 0.7400 zone, though some caution is required as buying pressures look somewhat fragile at the moment.