Sample Category Title
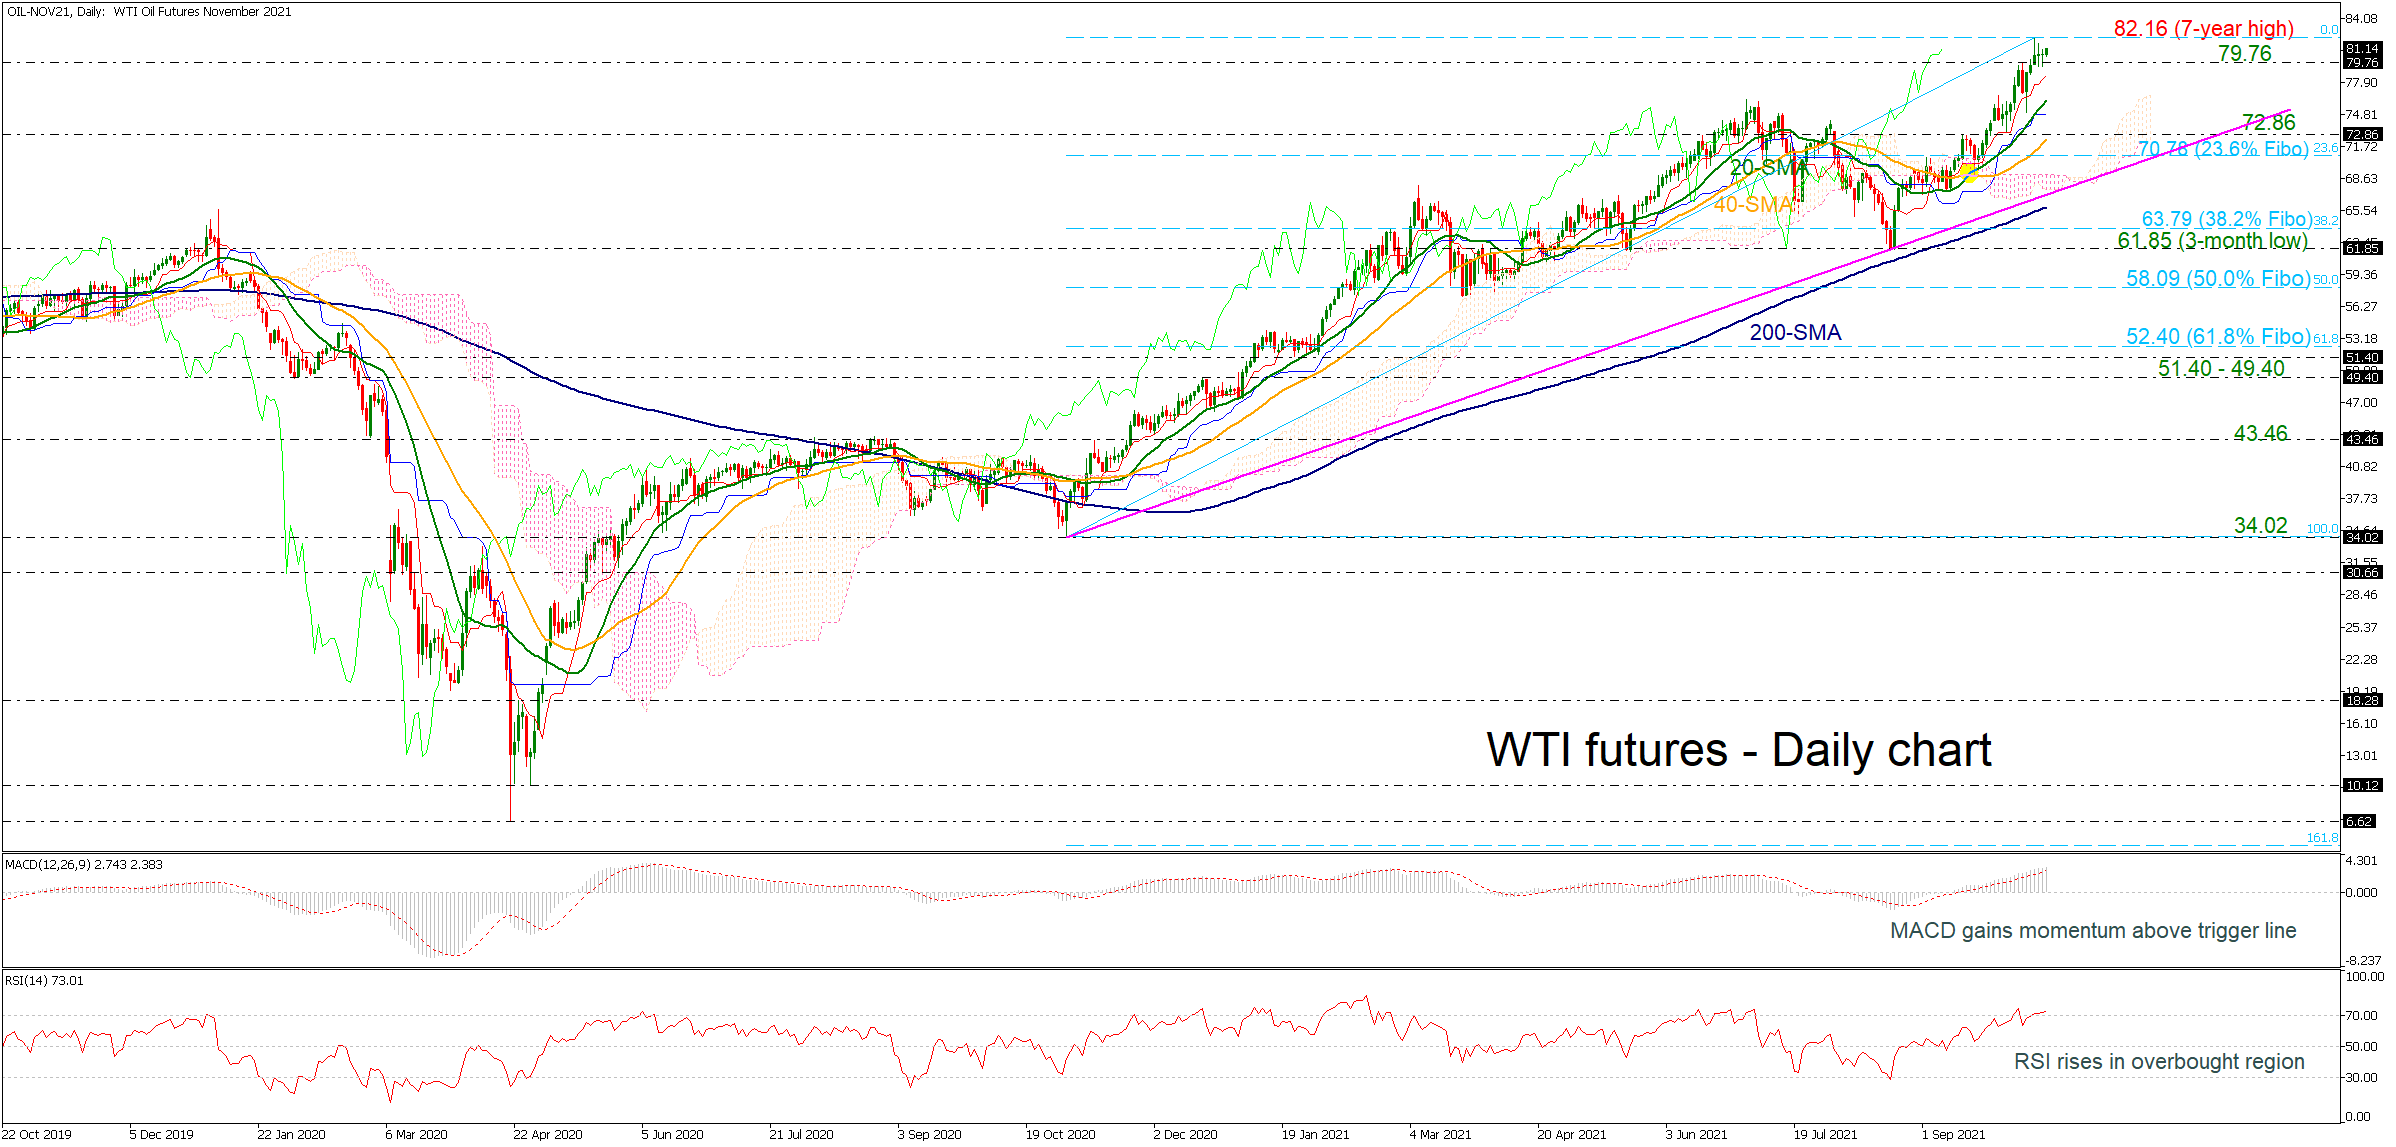
WTI Futures Pause Aggressive Buying Pressure, Hover Around 81.00
WTI crude oil futures are continuing the upside structure, standing around the seven-year high of 82.16. The price has been in a strong bullish pattern since November 2020, trading well above the rising trend line and the simple moving averages (SMAs).
Regarding the technical indicators, the MACD oscillator is moving above its trigger and zero lines, gaining momentum, while the RSI is hovering in the overbought region, suggesting the end of the bullish movement and the start of a bearish correction in the near term. Moreover, the red Tenkan-sen line remains above the flat blue Kijun-sen line and the Ichimoku cloud.
If there is a strong push, the price will rise to the April 2013 swing low of 86.39 should the wall around 82.16 crumbles. If the price rises from here, it may take a rest at the September 2014 high of 94.90.
However, if downward forces return, then the 79.76 support and the red Tenkan-sen line at 78.54 may resume their supportive roles. If the market heads south, it might lead to a faster slide towards the 20-day simple moving average (SMA) at 76.13, which lies ahead of the 72.86 level. Lower prices would erode investor confidence in the long-term upward trend even further.
In brief, a downside reversal is more likely now that WTI oil futures are trading near a key long-term resistance region, although the technical picture is still supportive.
US Dollar Falls Sharply
The US dollar suffers a sharp correction lower
A strong 30-year bond auction overnight, and a flattening of the US yield curve once again, led by a fall in long-dated yields post US inflation data, saw the dollar index fall sharply. The dollar index plummeting by 0.54% to 94.00, before posting a modest gain to 94.05 in Asia. What cannot be denied is that the dollar index has traced out a major top at 94.50, and a daily close above there will be a strong indicator of a further directional move higher. Only a fall through 93.50 changes the bullish outlook for the US dollar temporarily in my opinion.
Admittedly, part of the US dollar retreat is likely due to the large amount of speculative long dollar positions built up in futures markets versus the major currencies. In the major currency space, it is not a coincidence that the euro, sterling and Swiss franc all rose by over 0.55% overnight, having been under the pump in recent days. Perhaps more significantly, USD/JPY, AUD/USD and NZD/USD hardly moved overnight, suggesting that yield differentials remain in play, and that risk sentiment remains elevated.
Although the PBOC withdrew a lot of money market liquidity today, it did set the CNY fix slightly weaker with USD/CNY fixed at 6.4412. With the CNY having hit multiyear highs on a trade-weighted basis this week, the PBOC might have an incentive to weaken the yuan to support exporters. However, I believe that China’s imported energy and raw material bill is far more important in the short term to the PBOC. I believe today’s weaker fix was an attempt to introduce some two-way volatility and market complacently pricing in stronger fixings and is not the start of a weakening cycle. China is unlikely to mess around with the yuan too much ahead of US/China talks and trade negotiations.
The fall of the US dollar overnight was mainly confined to the DM space and mostly passed Asian currencies by as they posted only modest gains. The Bank of Korea intervention ahead of 1200.00 has worked for now, but USD/Asia has started rising again this morning. Asian currencies remain acutely vulnerable to rising tapering expectations in the US and the accompanying stronger dollar. With only the G-10 space correcting overnight, that signals it was a culling of speculative long-dollar positioning and not a swing in overall directional sentiment. Unless regional markets try to get ahead of the curve like Singapore, which tightened policy on Thursday, the downward pressure on Asian currencies should resume sooner, rather than later.
Asian Equities Are Mixed Today
Wall Street rebounds but Asia mixed
It is another mixed day for Asian equities after US markets snapped a three-day losing streak overnight. With US inflation printing on target overnight, US long-dated yields fell with the US dollar, flushing out the buy-the-dip crowd and sending US stocks higher, notably in the technology growth space. The S&P 500 rose by 0.30%, the Nasdaq rose by 0.73% while the Dow Jones lagged, finishing just 0.01% higher. US index futures in Asia have continued rallying, with all three indexes climbing by around 0.35%.
That has lifted sentiment in most of Asia, with Japan markets buoyed by dovish comments from a BOJ official. The Nikkei 225 has jumped 1.34% higher with the Kospi rallying by 1.15%. China is a laggard today after a record high print in PPI stoked supply chain concerns and the PBOC only rolled over CNY 10 bio of CNY 100 bio in maturing repos today, despite setting a weaker yuan fixing. The Shanghai Composite is just 0.15% higher, but the narrower Shanghai 50 has fallen by 0.65%, while the CSI 300 has dropped by 0.30%. Hong Kong markets are closed for a public holiday.
Across the rest of Asia, markets are trading positively though. Singapore had shrugged off an unexpected MAS tightening to rise by 0.25%. Kuala Lumpur has edged 0.50% higher on profit-taking after energy prices traded sideways again overnight. Jakarta though has jumped 1.45% with Bangkok rising by 0.50%. Both continue to receive tourism reopening tailwinds.
A rise in natural gas, iron ore and copper futures today has given an additional boost to Australian markets, which were happily piggy-backing the US rally overnight. A rise in full-time employment this morning, and expectations of a reopening rebound, also lifting confidence. The ASX 200 is 0.95% higher, while the All Ordinaries has rallied by 1.15%.
European stock markets should open higher this morning following a decent performance by US and Asian markets, and a lack of market-moving headlines. Whether this proves to be a dead cat bounce for equities will depend on momentum being maintained in US markets. I am doubtful given the inflation indicators pouring in from around the world now and strong indications that the Fed taper will start as early as November.
Daily Technical Analysis
EUR/USD
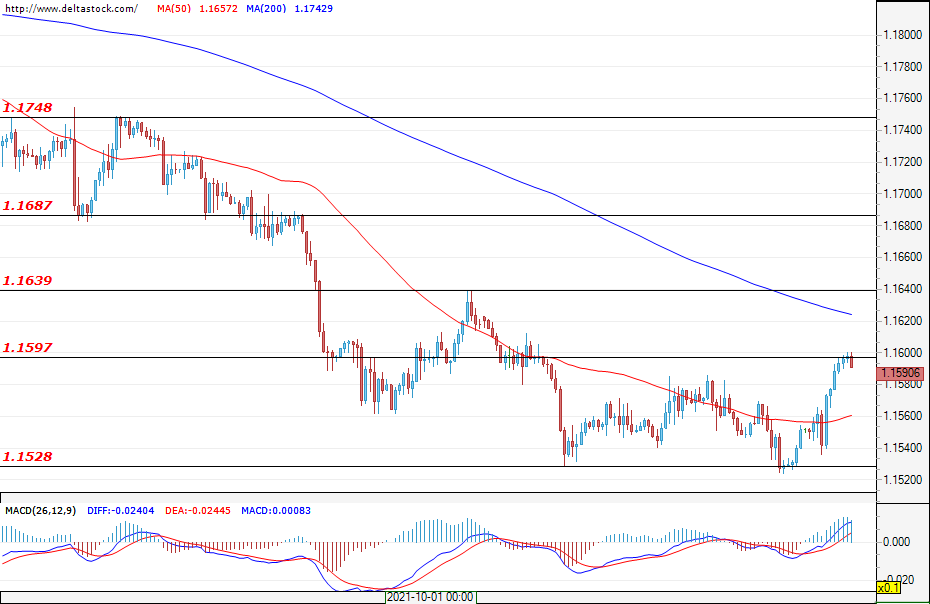
Current level - 1.1590
The bears eased off their pressure and the pair managed to bounce away from the 1.1528 support. At the time of writing, the bulls are attacking the resistance of 1.1597. Until this area is breached, sellers will be dominating the market and the bears can also be expected to resume their pressure. In the event of renewed selling pressure, the area at 1.1528 should be breached and a potential target would be the support at around 1.1410. In an alternative scenario, in which the bulls overcome 1.1597, a rally towards 1.1640 or 1.1680 can be expected. After yesterday's data on the consumer price index, investors grew wary that the Federal Reserve may raise interest rates earlier. In such a scenario, new rallies for the Greenback can be expected. Today, traders will expect the data on the producer price index and the number of initial jobless claims for the United States at 12:30 GMT
| Resistance | Support | ||
| intraday | intraweek | intraday | intraweek |
| 1.1597 | 1.1687 | 1.1530 | 1.1410 |
| 1.1640 | 1.1750 | 1.1470 | 1.1280 |
USD/JPY
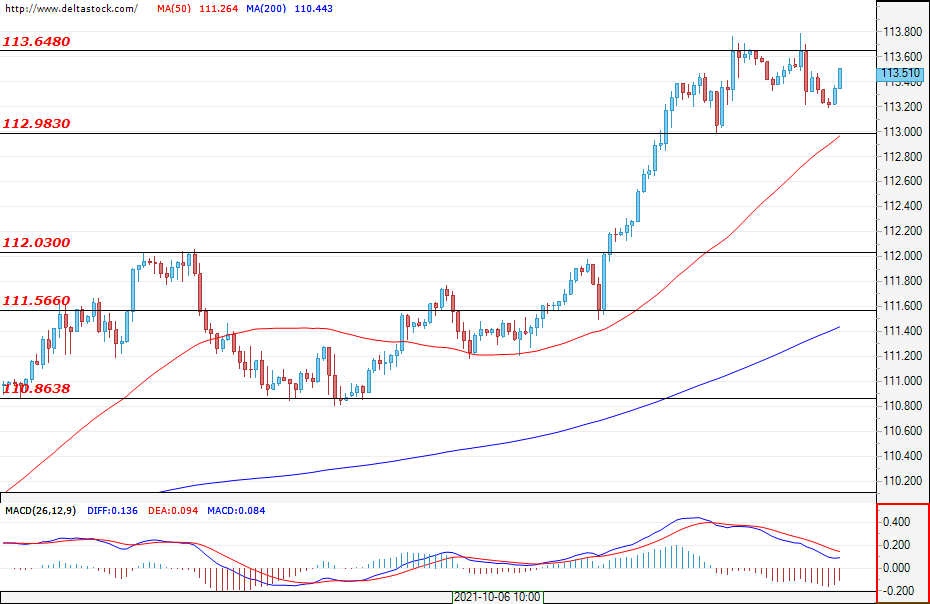
Current level - 113.51
The Greenback rally paused below the resistance of 113.64. This area comes from the higher time frames and the market may need more time to breach the level. Expectations remain positive – for a continuation of the uptrend. It is possible for the market to enter a range, with the lower band being the support at 112.98 and the upper one being the level at around 113.80.
| Resistance | Support | ||
| intraday | intraweek | intraday | intraweek |
| 113.64 | 116.0 | 113.00 | 111.56 |
| 114.50 | 118.50 | 112.00 | 110.86 |
GBP/USD
Current level - 1.3657
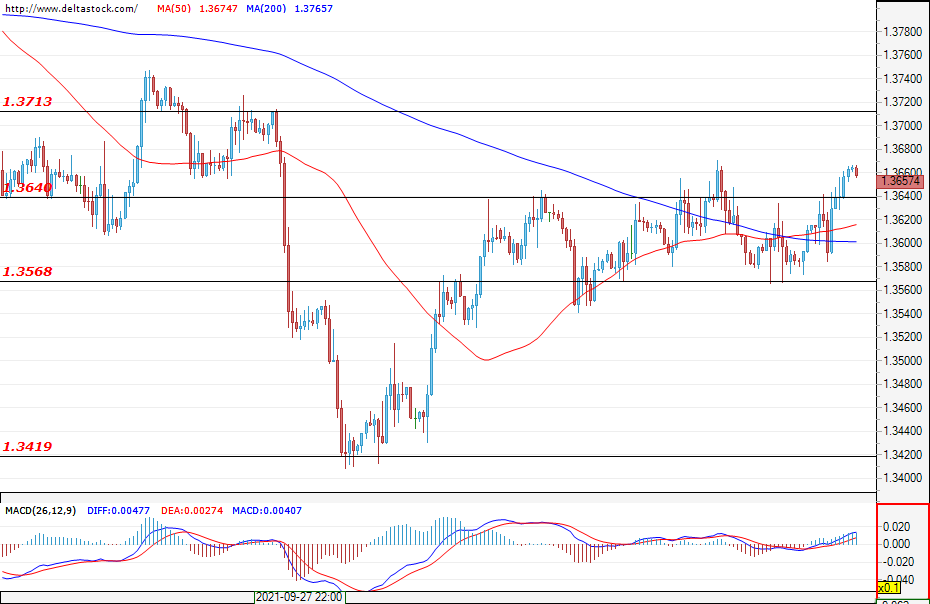
The sterling managed to get out of the range and breached the resistance of 1.3640. If the breach is confirmed, an attack on the resistance at around 1.3713 can be expected. Sentiment remains positive – for a continuation of the recovery. If, however, the bears make another attempt at resuming the pressure, their push should be limited by the support at around 1.3570.
| Resistance | Support | ||
| intraday | intraweek | intraday | intraweek |
| 1.3710 | 1.3800 | 1.3640 | 1.3420 |
| 1.3760 | 1.3840 | 1.3570 | 1.3420 |
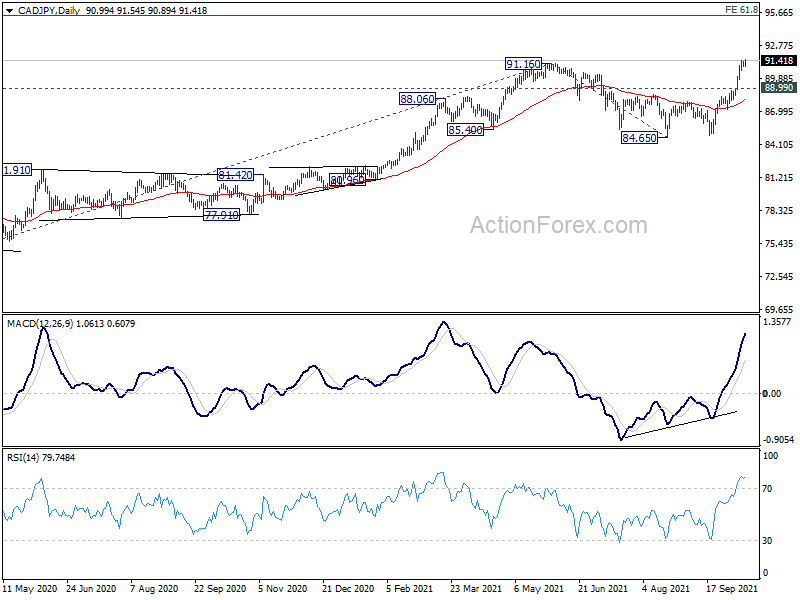
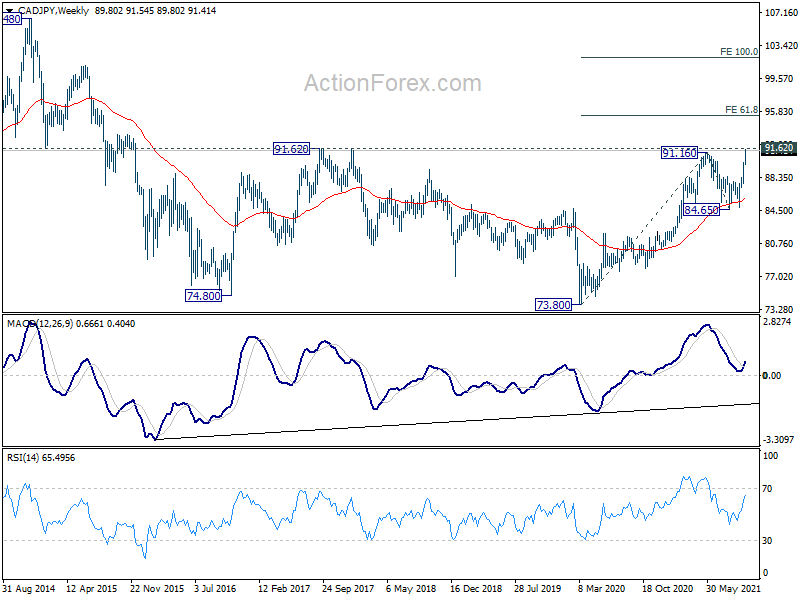
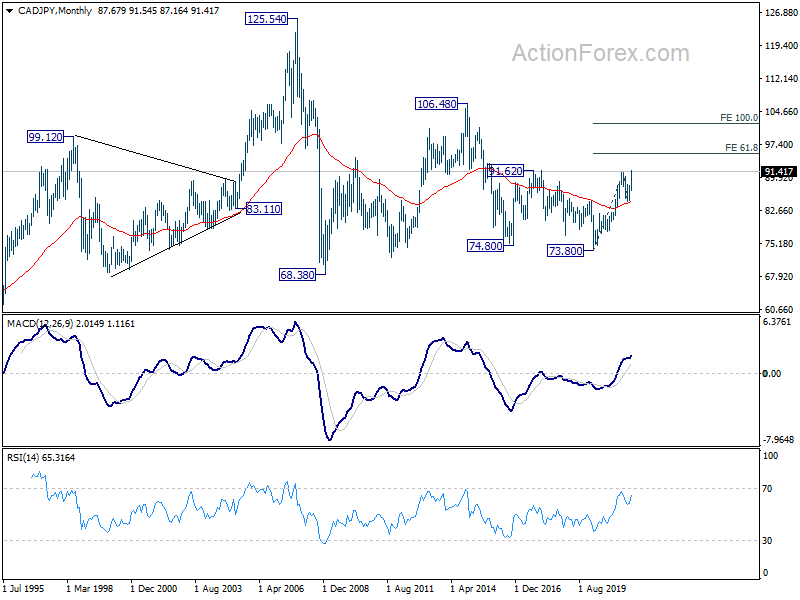
CAD/JPY upside breakout, pressing 91.62 long term resistance
CAD/JPY's rally continues this week and the break of 91.16 resistance should confirm resumption of medium term up trend from 73.80 (2020 low). Current development argues that whole down trend from 106.48 (2014 high) has completed with three waves down to 73.80. That is, rise from 73.80 is developing into the third wave of the pattern from 68.38 (2009). It's itself a medium to long term up trend that has the prospect of surpassing 106.48 eventually.
Of course, CAD/JPY will have to sustain above 91.62 resistance first, and then accelerate further up through 61.8% projection of 73.80 to 91.16 from 84.65 at 95.37, to give us more confidence on this long term bullish case. By anyway, for now, further rise is expected as long as 88.99 support holds, in case of retreat.
Singapore Springs Surprise Monetary Tightening
MAS tightens policy
The transitory inflation argument was given another jab to the kidneys today as the Monetary Authority of Singapore delivered a modest, but very surprising, tightening of monetary policy. The MAS will allow a slight appreciation of the Singapore Dollar Nominal Effective Exchange Rate or S$NEER (for overseas readers, Singapore does not use interest rates for monetary policy, it uses the S$NEER mechanism.) That represents a slight tightening of monetary policy.
The MAS growth forecasts remained on track with the only cautionary note being Covid-19 tail risks. It noted that imported cost pressures would drive inflation in the quarters ahead, hence allowing the S$NEER to appreciate. What is notable is that Singapore’s MAS only adjusts monetary policy twice a year. Given that six-monthly cycle, if the MAS is tightening slightly now, it is clear they believe inflation is going to be here for longer. They likely also have one eye on the impending Fed taper. Thus, the transitory inflation “how long is a piece of string before it’s not transitory” becomes harder to justify.
The FOMC minutes overnight also telegraphed a November/December start to the Fed taper although the stress appears to be being expressed a flattening of the US yield curve, with short end rates rising while longer-dated rates fall. That might be because long-term inflation break evens remain anchored around 2.50%. US Inflation and Core Inflation MoM rose by 0.40% and 0.20% respectively. That left the YoY headline inflation slightly above forecast at 5.40% while core remained at 4.0%. Although inflation remains “sticky” at these levels, it was not enough to lead to an inflation shock for US markets and equities duly rallied while a bout of long covering pummelled the US dollar. It is likely to be only a temporary aberration for both.
On the inflationary front, markets have breathed a sigh of relief after China bucked the trend and posted slightly lower inflation data today. September MoM Inflation fell to 0.0%, below forecast of 0.30%, while the YoY fell to 0.70% from 0.80%. There is a sting in the tail though as September PPI YoY rose to 10.70%, the highest since records began. That suggests that inflationary pressures will persist in the China value chain.
Japan’s Industrial Production data is unlikely to move the needle today, with local markets focused entirely on the extent of the upcoming fiscal goodie bag after the end-of-month elections. The BOJ’s Noguchi said this morning that a reduction in monetary stimulus from the BOJ was not an option at the moment. That makes selling USD/JPY a dangerous trade going forward but is music to the ears of local equity markets.
India’s WPI Inflation for September this afternoon is likely to make ugly reading, however. WPI Inflation YoY is expected to remain above 11.0% and while the food price pressures have ebbed, the fuel and manufacturing sub-indexes could make even more ugly reading given the moves in energy prices and the depreciation of the currency. A print well north of 11.0% for inflation could see the modest recovery of the INR hit a brick wall, with USD/INR resuming its rally towards 76.000. The RBI has stopped its QE don’t call it QE programme but is still holding off on signalling more strongly that rate hikes are coming. Today’s WPI is likely to heap further pressure on the central bank.
The Turkish lira is once again in the spotlight after President Erdogan fired three central bank officials. The USD/TRY, or as I call it, the USD/Try-my-patience, resumed its rally overnight, rising 0.50%, climbing another 0.70% to 9.1480 in Asia today. For context, President Erdogan believes that cutting interest rates causes inflation to fall, and he tends to fire central bank employees, including governors, who disagree with him in this respect. Readers should be pencilling in USD/TRY trading on a 10.0000 handle sooner rather than later.
Europe’s calendar is second-tier today while US markets will be focusing on Initial Jobless Claims, PPI, and Core PPI. A sharp drop in Initial Claims, and/or an MoM rise above 0.70% for PPI should be enough to have the Fed taper trade back on track after a short overnight staycation. Watch also for official US Crude Inventories data after a surprise jump in US API Inventories above 5 million barrels overnight. Forecasts are for a 700k barrel gain, a blockbuster climb could be enough to finally trigger an aggressively short-term correction lower I have been waiting for, to thin the herd of speculative long positions out there. Finally, by my count, we have at least six Federal Reserve regional presidents speaking today, good for intra-day volatility and likely to push US earnings releases into the background.
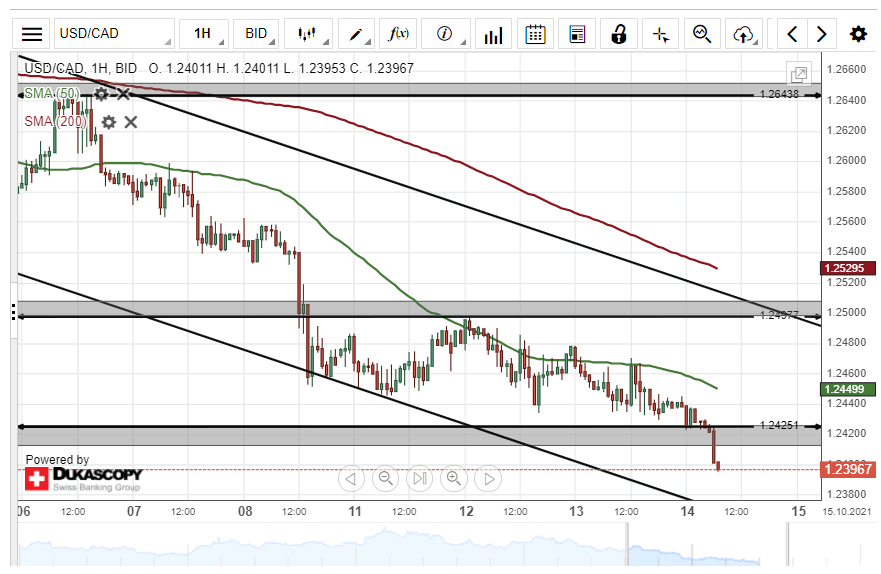
USD/CAD Decline Likely To Continue
On Wednesday, the US Dollar declined by 46 pips or 0.37% against the Canadian Dollar. The 50– hour simple moving average pressured the currency pair lower during Wednesday's trading session.
Technical indicators suggest selling signals on the 4H and daily time-frame charts. Most likely, the exchange rate could continue to trend lower in a descending channel pattern within the following trading session.
However, the currency exchange rate could find support at 1.2425 during Thursday's trading session.
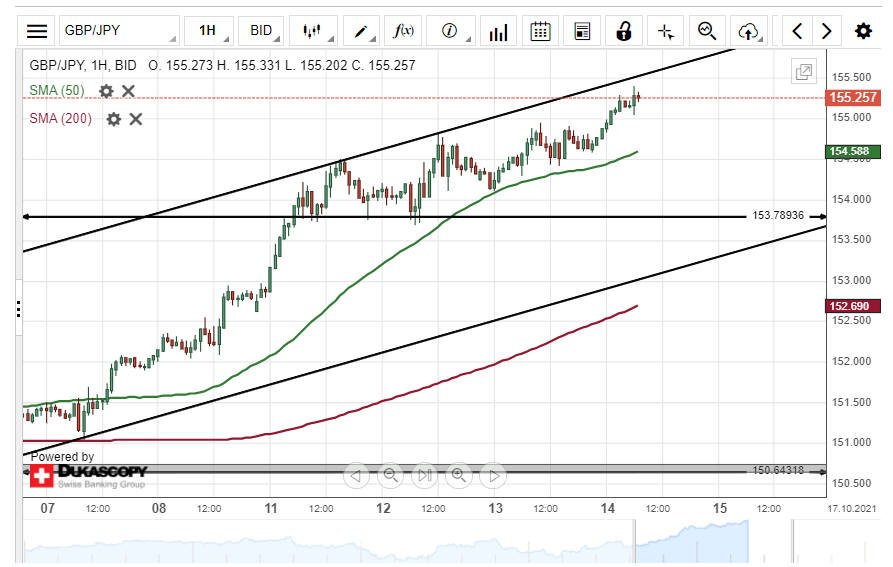
GBP/JPY Bulls Could Prevail
On Wednesday, the British Pound surged by 86 pips or 0.56% against the Japanese Yen. The currency pair breached the psychological resistance level at 155.00 during Wednesday's trading session.
Bullish traders could continue to drive the GBP/JPY exchange rate higher. A breakout through the upper line of an ascending channel pattern could occur within this session.
However, if the channel pattern holds, the currency exchange rate might make a pullback towards the 50– hour simple moving average at 154.51 today.
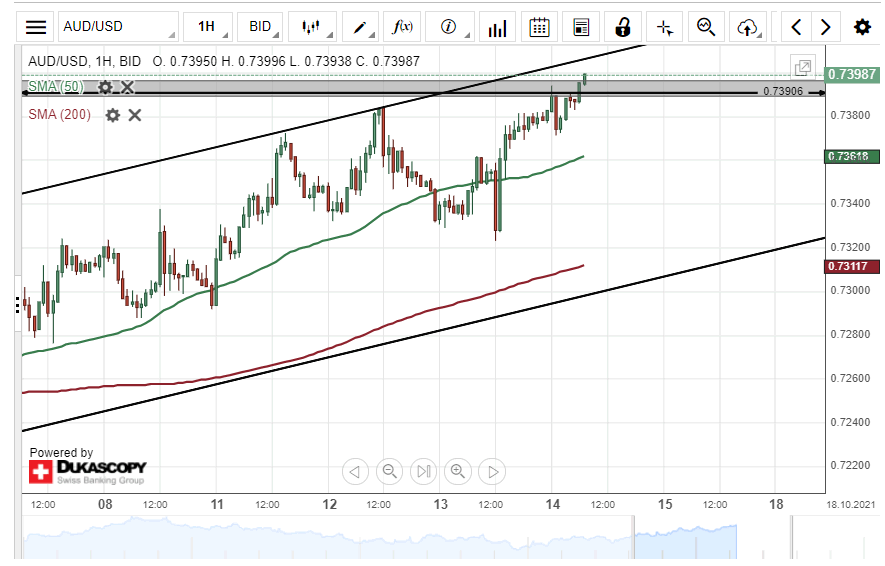
AUD/USD Remains Below 0.7400
On Wednesday, the Australian Dollar rose by 62 pips or 0.85% against the US Dollar. The AUD/USD currency pair lingered below the 0.7400 level during Wednesday's trading session.
As for the near future, the exchange rate could continue to edge higher. A breakout through the upper boundary of an ascending channel pattern could occur within this session.
However, if the channel pattern holds, a decline towards the 0.7340 area could be expected during the following trading session.
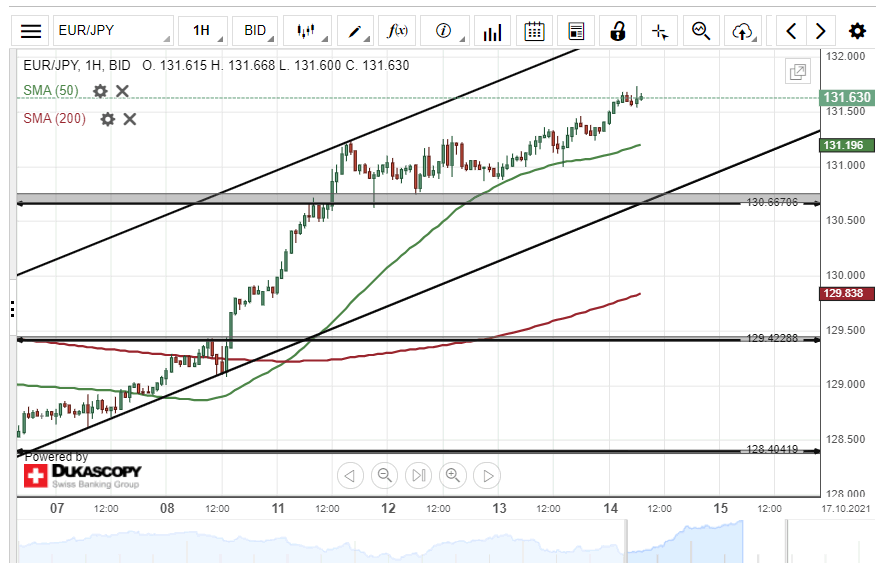
EUR/JPY Breached 131.50 Level
On Wednesday, the common European currency surged by 53 pips or 0.40% against the Japanese Yen. The currency pair breached the 131.50 area during Wednesday's trading session.
Everything being equal, the exchange rate could continue to edge higher in an ascending channel pattern during the following trading session. The potential target for buyers will be near the 132.50 level.
However, the resistance line at 132.00 could provide resistance for the EUR/JPY currency exchange rate within this session.