Sample Category Title
GBP/JPY Daily Outlook
Daily Pivots: (S1) 151.43; (P) 151.82; (R1) 152.50; More...
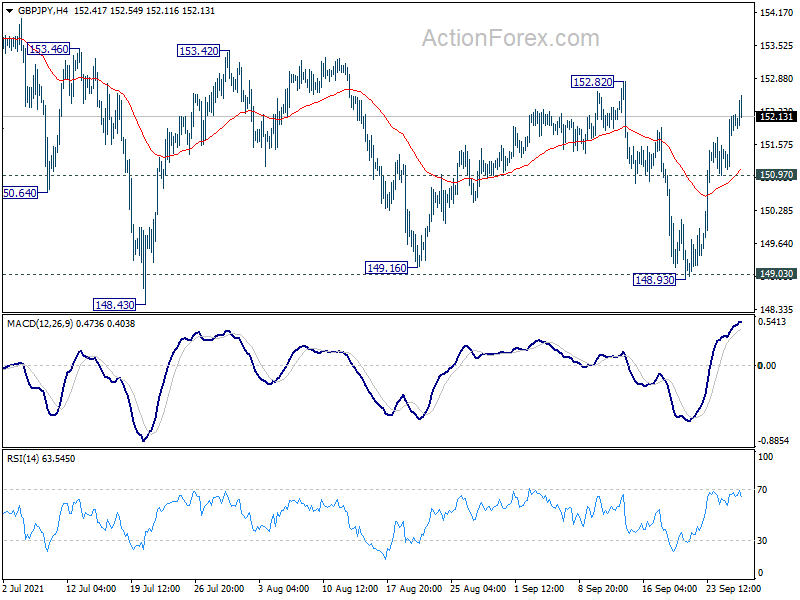
Intraday bias in GBP?JPY stays mildly on the upside at this point. Rise from 148.93 should target 152.82 resistance first. Sustained break there will suggest that correction from 156.05 has completed, and turn near term outlook bullish for retesting this high. On the downside, break of 150.97 minor support will turn bias back to the downside for 149.03 key support instead.
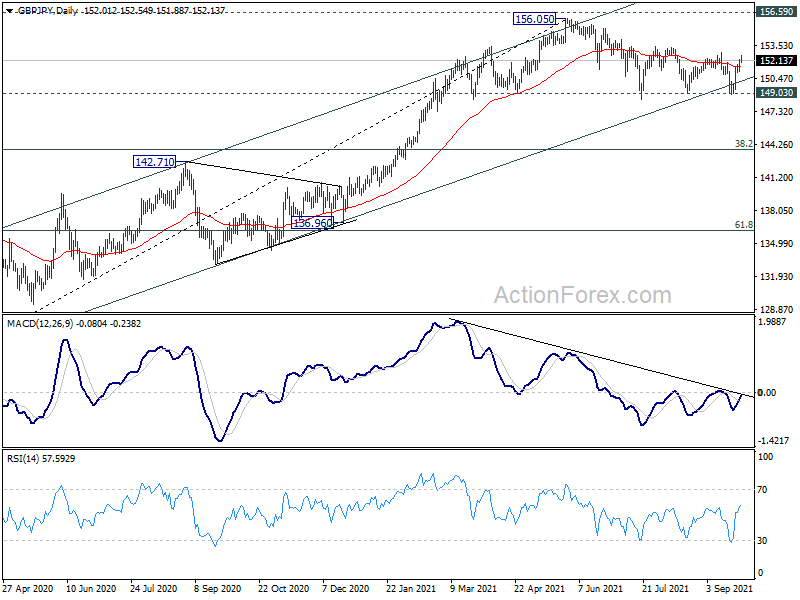
In the bigger picture, rise from 123.94 is seen as the third leg of the pattern from 122.75 (2016 low). As long as 149.03 support holds, such rise would still resume at a later stage. However, sustained break of 149.03 support will indicate rejection by 156.59. Fall from 156.05 would be at least correcting the whole rise from 123.94. Deeper fall would be seen back 38.2% retracement of 123.94 to 156.05 at 143.78 first.
USD Gains On Hawkish Comments
The US dollar gained against a number of its counterparts yesterday, as Fed policymakers seem to make their case for a tightneing of the Fed's monetary policy. It's characteristic that NY Fed President Williams yesterday reiterated what was included in the Fed's interest rate decision last week, namely that a tapering of asset purchases may soon be warranted. It should be noted that US yields tended to be on the rise and the 10 year yield even reached a three month high providing support for the USD. It should be noted that Nasdaq retreated also affected by the hawkish comments and rising yields, as also did the Dow Jones. Today we highlight Fed Chairman Powell's testimony, while traders may also the release of the US consumer confidence for September.
Nasdaq dropped yesterday breaking he 15300 (R1) support line, now turned to resistance and continued lower yet bounced on the 15125 (S1) support level. The index seems to have stabilised somewhat, yet bearish tendencies seem to continue to simmer below the surface. Please note that the RSI indicator below our 4 hour chart, is just below the reading of 50, which could imply a slight advantage for the bears. Should the bearish tendencies actually instigate a selling interest of the market once again, we may see the index breaking the 15125 (S1) support line and take aim of the 14950 (S2) level. Should buyers be in control of the index's direction we may see Nasdaq breaking the 15300 (R1) resistance line, thus paving the way for the 15500 (R2) resistance level.
Pound rises yet gains remain capped
The pound tended to be on the rise against the USD, despite USD's strengthening, but also against the EUR, JPY and CHF yesterday, typical of the support GBP enjoyed. Expectations among pound traders about Bank of England starting to hike rates next year tended to be on the rise thus providing support for the pound, as monetary policy is expected to tighten maybe earlier than expected. It's characteristic that BoE Governor Bailey stated yesterday that he and other members of the Monetary Policy Committee believe that there will be a need for a modest tightening of policy given the inflationary pressures in the UK. On the other hand, it should be noted that market worries for the energy crunch in the UK tended to tame the pound bulls as petrol stations in the UK are reported to run dry due to shortages of truck drivers, yet the UK Government is to introduce measures to ease the pressure. Given the low number of financial releases today from the UK, we expect fundamentals to take the lead for the pound.
GBP/USD rose yesterday yet the sideways motion between the 1.3750 (R1) and the 1.3600 (S1) levels seems to continue. We tend to maintain our bias for a sideways motion of cable as long as the prementioned levels continue to encapsulate the pair's main body of the price action. Also please note that the RSI indicator below the 4-hour chart is just above the reading of 50,implying a rather indecisive market, yet at the same time reflecting also yesterday's strengthening of the pound. Should the bulls take over, we may see the pair breaking the 1.3750 (R1) resistance line and aim for the 1.3875 (R2) resistance level. Should the bears be in charge of cable's direction, we may see the pair breaking the 1.3600 (S1) support line and aim for the 1.3430 (S2) support level.
Other economic highlights today and the following Asian session:
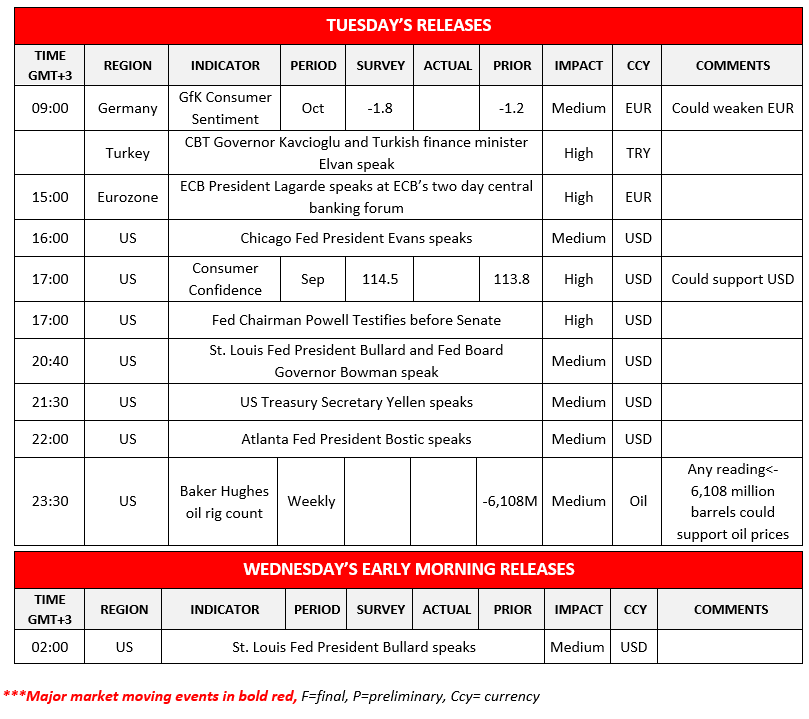
Today during the European session, we get Germany's GfK consumer sentiment for October and in the American session the US consumer sentiment for September. We have a high number of monetary policy makers speaking today, yet we highlight two, namely ECB President Lagarde which is to speak before EDB's two days central banking forum and Fed Chairman Powell testifying before the US Senate.
US 100 Cash H4 Chart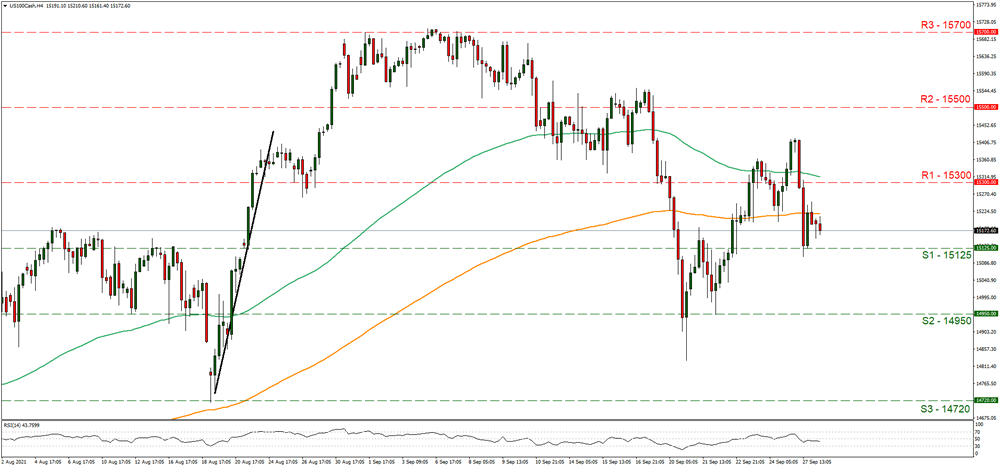
Support: 15125 (S1), 14950 (S2), 14720 (S3)
Resistance: 15300 (R1), 15500 (R2), 15700 (R3)
GBP/USD H4 Chart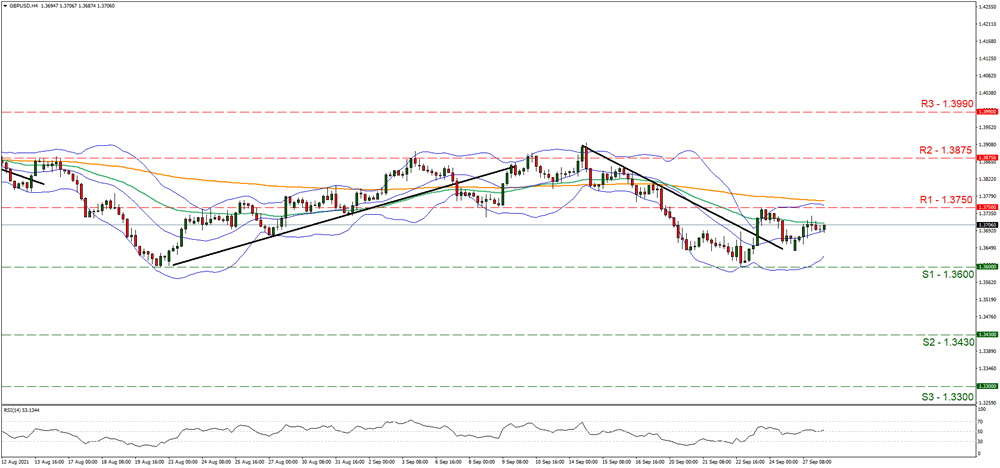
Support: 1.3600 (S1), 1.3430 (S2), 1.3300 (S3)
Resistance: 1.3750 (R1), 1.3875 (R2), 1.3990 (R3)
EUR/JPY Day Outlook
Daily Pivots: (S1) 129.57; (P) 129.75; (R1) 130.03; More....
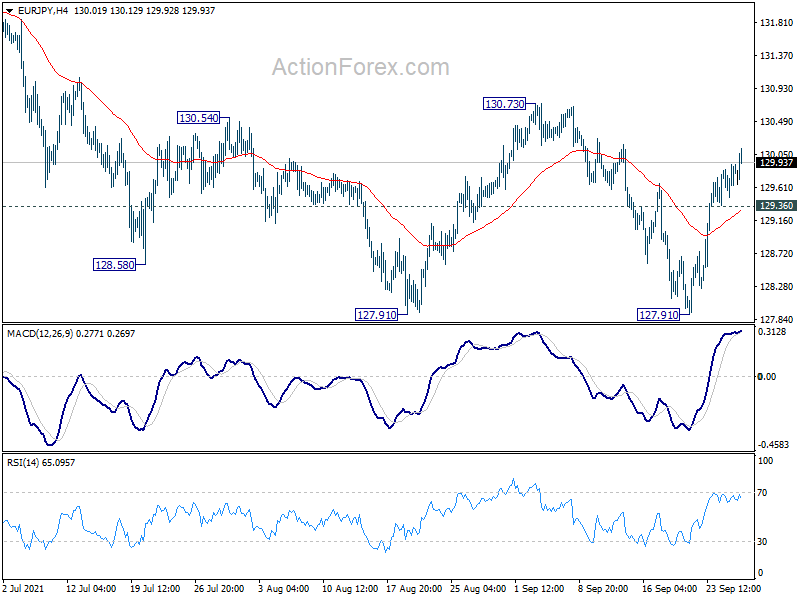
EUR/JPY's rise continues today and hits as high as 130.12 so far. Intraday bias remains on the upside for 130.73 resistance first. Firm break there will argue that correction from 134.11 has completed and turn near term outlook bullish for retesting this high. On the downside, break of 129.36 minor support will turn bias back to the downside for retesting 127.91 instead.
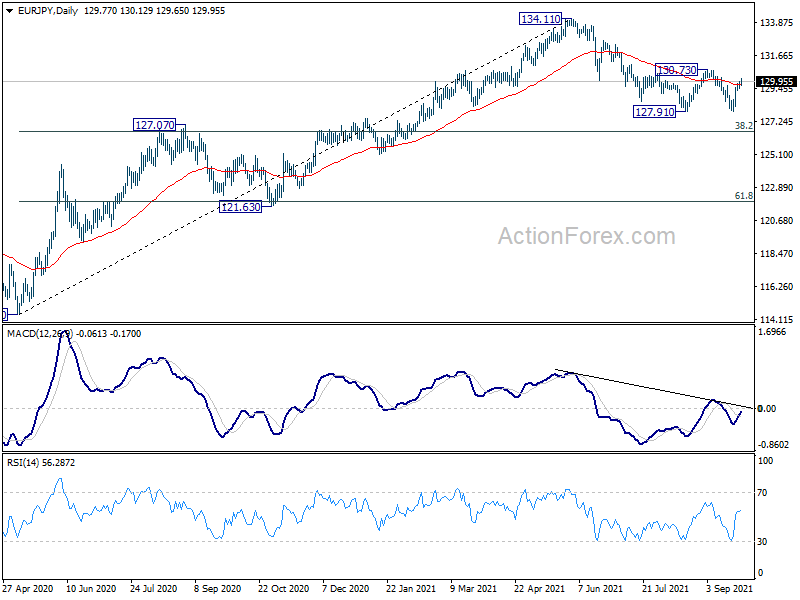
In the bigger picture, rise from 114.42 is seen as a medium term rising leg inside a long term sideway pattern. As long as 127.07 resistance turned support holds, further rise is still expected to retest 137.49 (2018 high). However, firm break of 127.07 will argue that the medium term trend has reversed, deeper fall would be seen to 61.8% retracement of 114.42 to 134.11 at 121.94.
The Analytical Overview Of The Main Currency Pairs
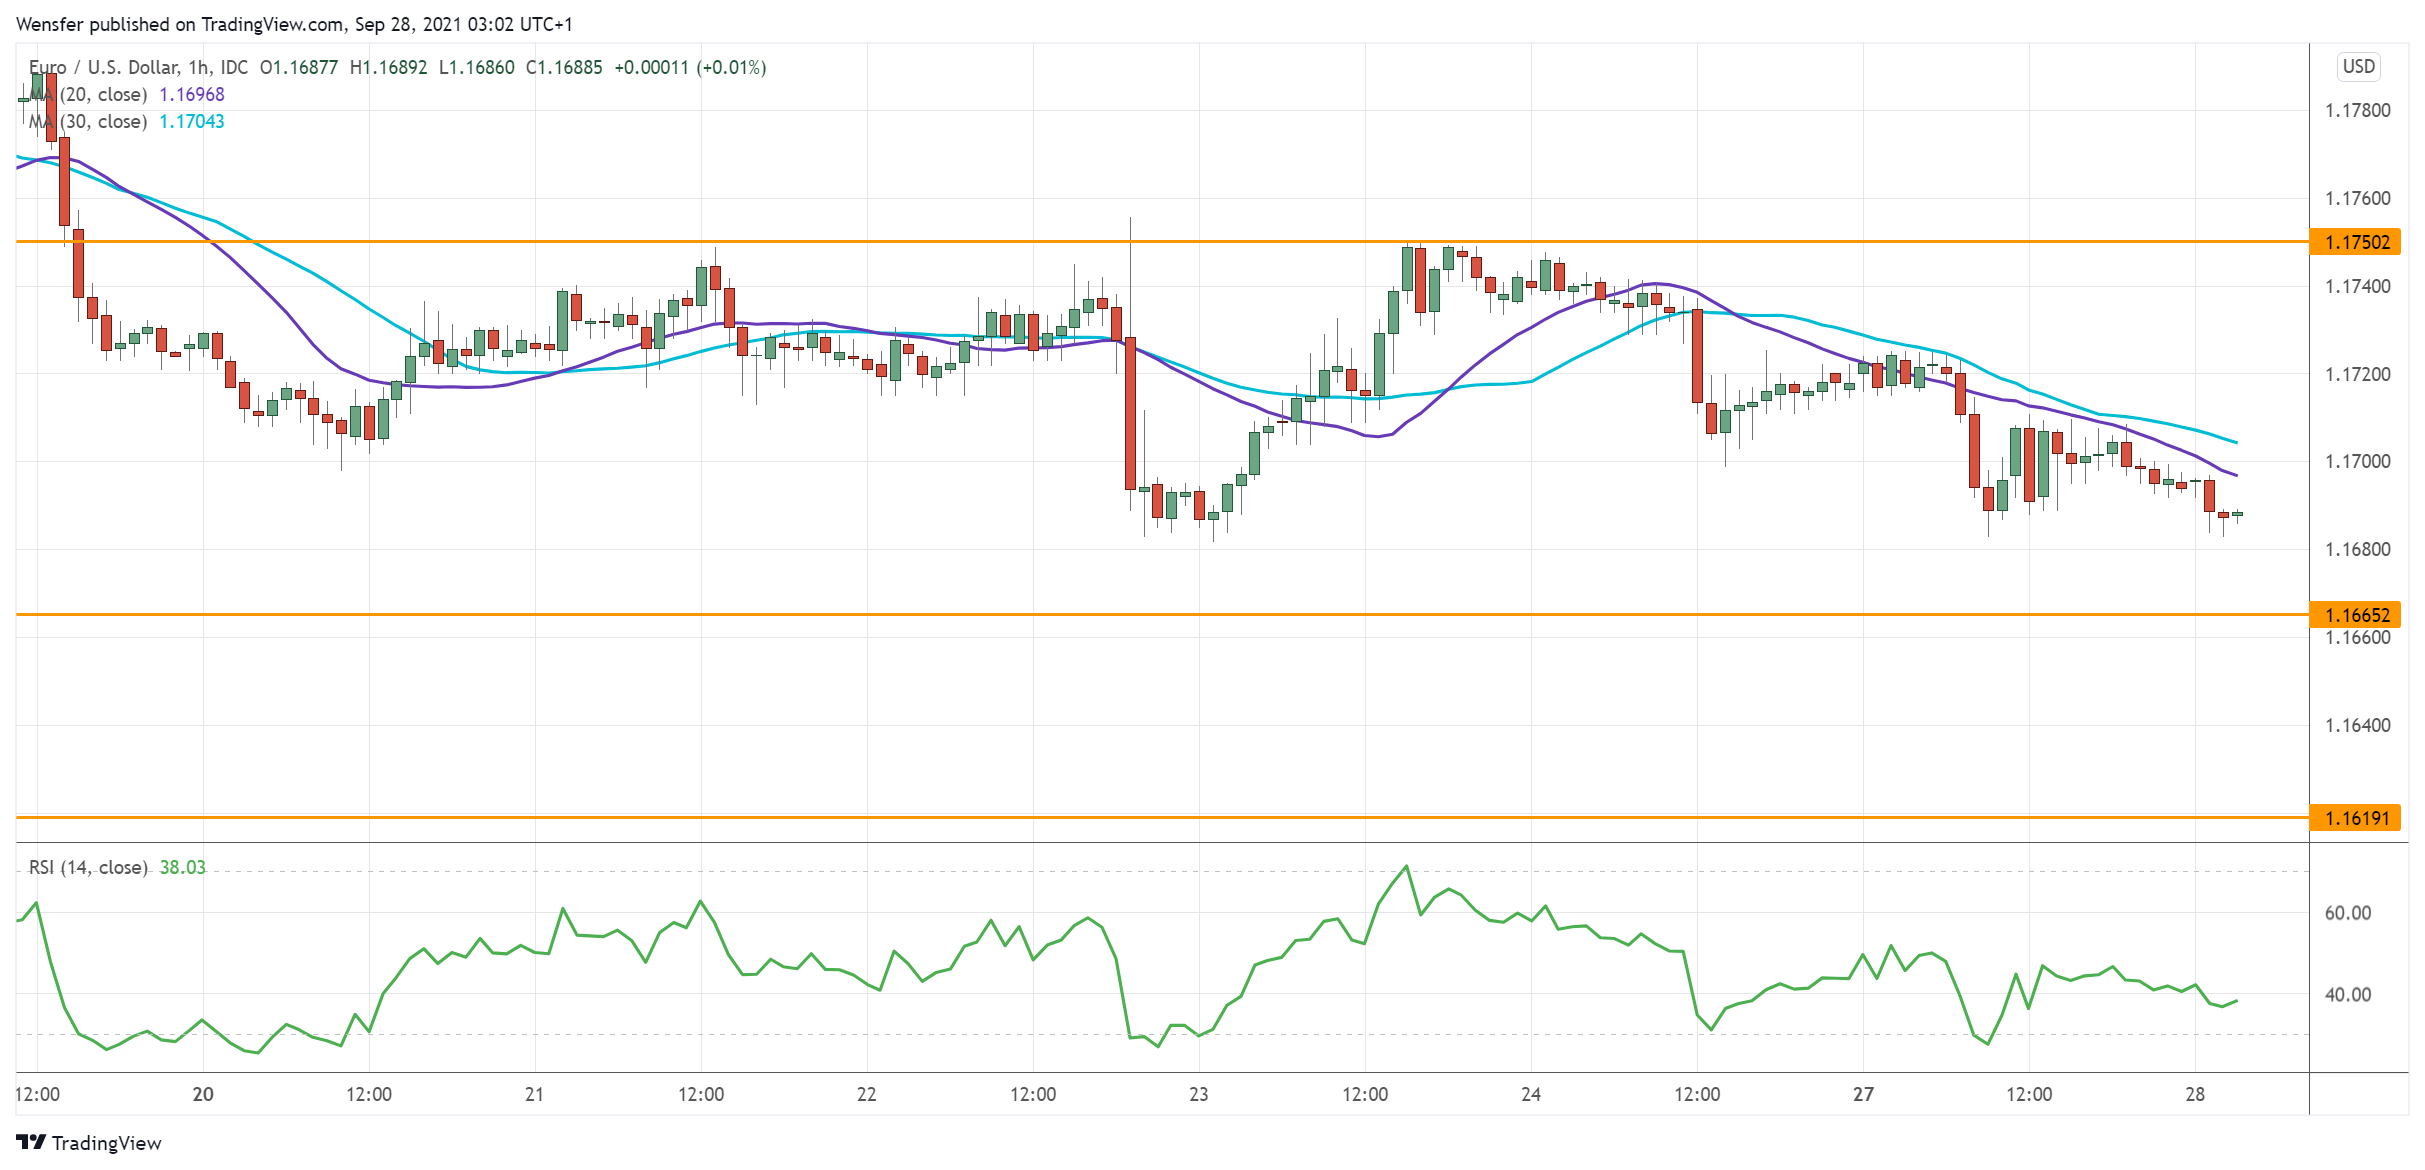
The EUR/USD currency pair
Technical indicators of the currency pair:
Prev Open: 1.1724
Prev Close: 1.1695
% chg. over the last day: -0.25%
ECB member De Kos said yesterday that the ECB's monetary support cuts should be made with caution. At the same time, ECB head Christine Lagarde indicates that there is reason to believe that the energy crisis in Europe will not lead to long-term inflation. Analysts believe the opposite.
Trading recommendations
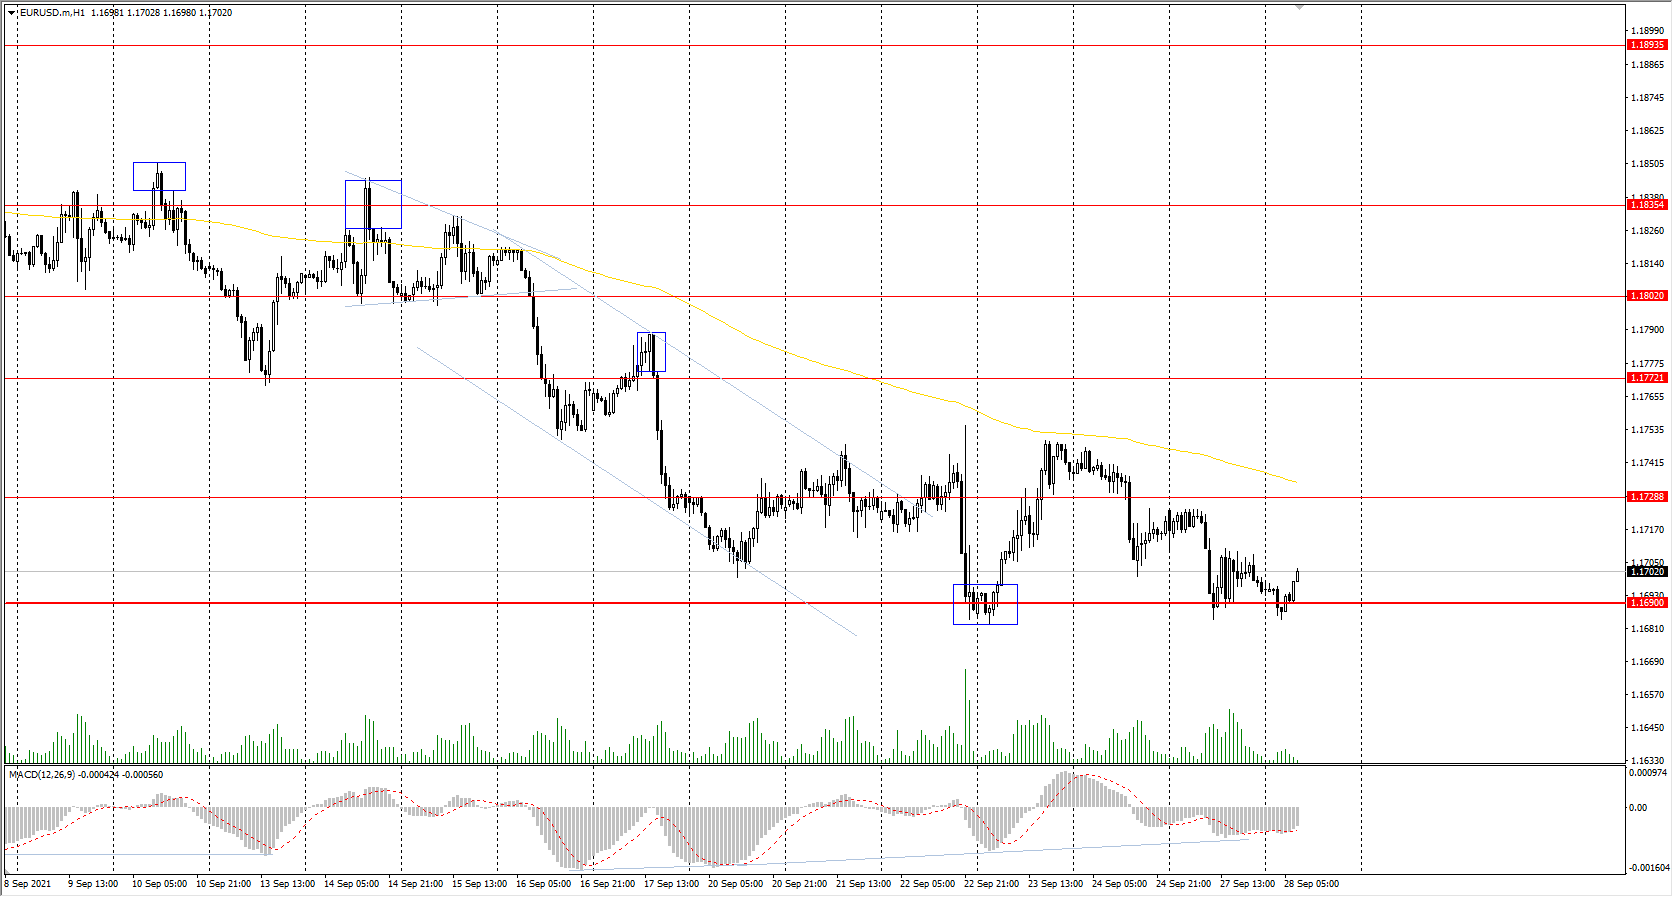
Support levels: 1.1690, 1.1620
Resistance levels: 1.1728, 1.1772, 1.1802, 1.1835, 1.1894, 1.1934, 1.1969
From the technical point of view, the general trend of the EUR/USD currency pair is bullish, but for the last 3 trading sessions, the price has been trading near the priority change level. The MACD indicator shows a divergence. Under such market conditions, buy deals can be considered from the priority change level. It is best to look for sell trades from the resistance levels near the moving average or after the breakdown of priority change level.
Alternative scenario: if the price breaks down through the 1.1704 support level and fixes below, the mid-term uptrend will likely be broken.
News feed for 2021.09.28:
- Eurozone ECB President Lagarde’s Speech at 15:00 (GMT+3);
- US CB Consumer Confidence (m/m) at 17:00 (GMT+3);
- US Fed Chair Jerome Powell’s Speech at 17:00 (GMT+3);
- US FOMC Member Bowman’s Speech at 20:40 (GMT+3);
- US FOMC Member Bostic’s Speech at 22:00 (GMT+3).
The GBP/USD currency pair
Technical indicators of the currency pair:
Prev Open: 1.3658
Prev Close: 1.3695
% chg. over the last day: +0.27%
Bank of England Governor Andrew Bailey said yesterday that the pace of economic recovery has slowed in recent months. However, the high prices will be temporary, according to the BoA. And to suppress inflation, the Bank of England should not consider cutting QE but immediately adjust the interest rate.
Trading recommendations
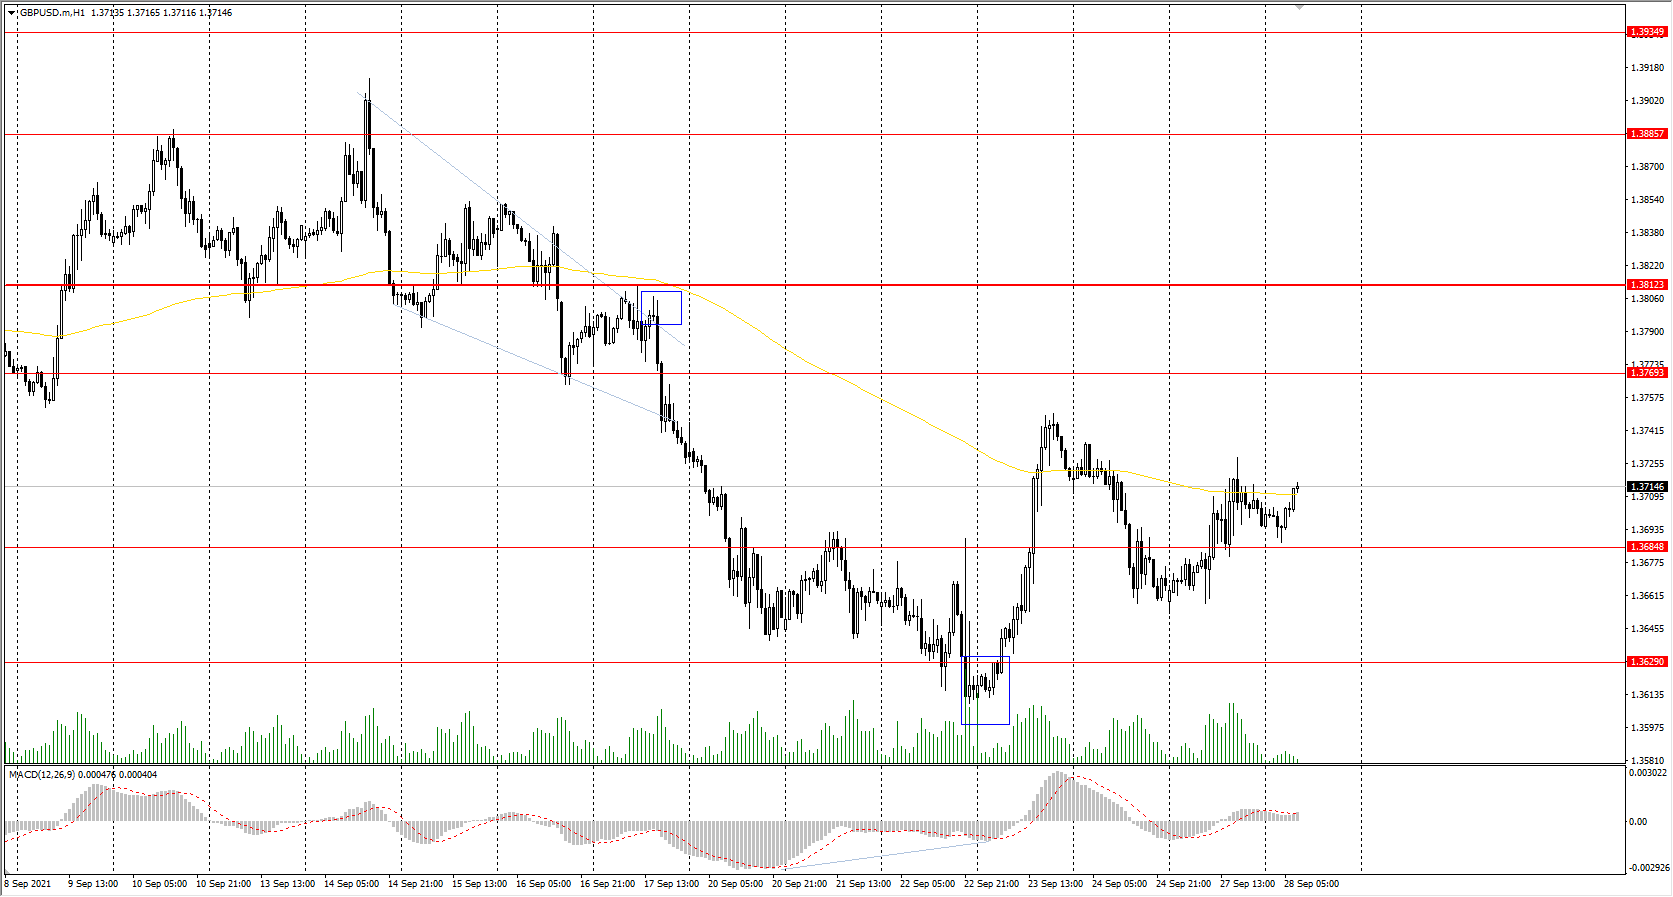
Support levels: 1.3685, 1.3629, 1.3614, 1.3525
Resistance levels: 1.3769, 1.3812, 1.3886, 1.3935, 1.4002
On the hourly time frame, the GBP/USD trend is bearish, but the local trend is bullish again. The MACD indicator has become inactive. Buy trades should be considered only throughout the day and only with short targets from the support levels. Sell trades can be found at the resistance levels above the moving average line.
Alternative scenario: if the price breaks out through the 1.3812 resistance level and consolidates above, the bullish scenario will likely resume.
The USD/JPY currency pair
Technical indicators of the currency pair:
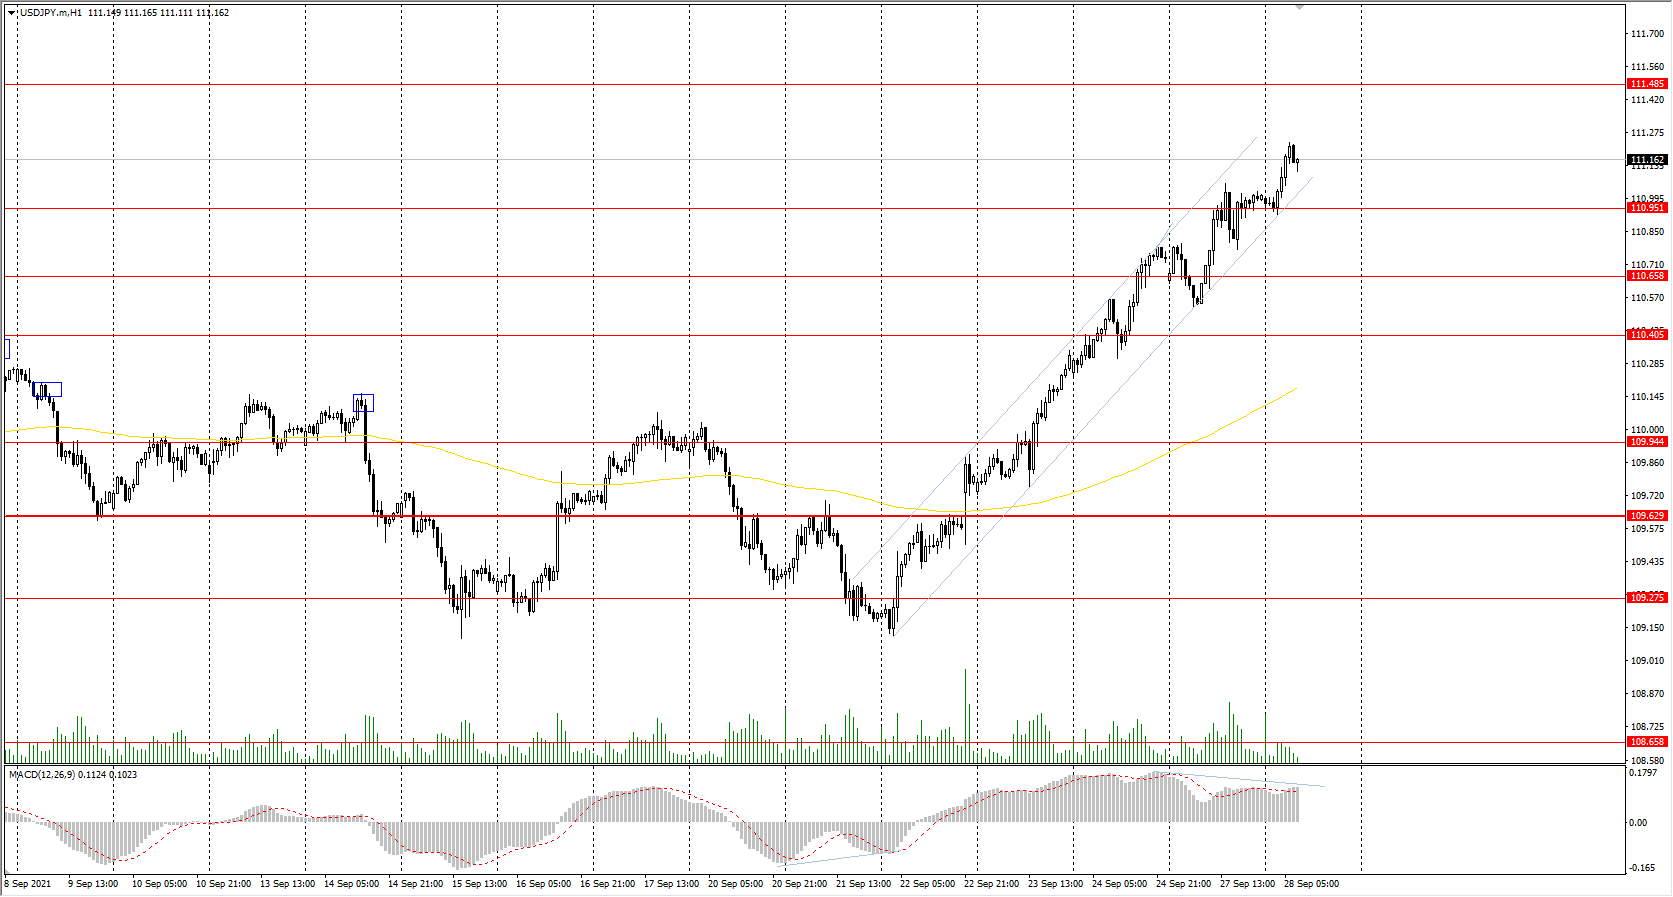
Prev Open: 110.64
Prev Close: 111.00
% chg. over the last day: +0.32%
Japanese Prime Minister Yoshihide Suga indicated that the state of emergency in Japan, associated with COVID, would be lifted on Thursday. This is good news for better economic indicators and business activity in the coming months.
Trading recommendations
Support levels: 110.95, 110.65, 110.40, 109.95, 109.63, 109.27
Resistance levels: 111.49
The main trend of the USD/JPY currency pair is bullish. Against the background of the Japanese Yen weakness, the USD/JPY quotes continue to grow. But it is obvious that the price cannot reach the upper border of the uptrend channel, while the MACD indicator begins to signal divergence. All these are signs of the buyer's weakness. Under such market conditions, it’s better to look for buy positions from the support levels after a small pullback. The price has deviated strongly from the moving average, and now there is a high probability of decline. Sell positions should be considered only throughout the day from the resistance levels but only after the sellers' initiative.
Alternative scenario: if the price falls below 109.63, the uptrend is likely to be broken.
The USD/CAD currency pair
Technical indicators of the currency pair:
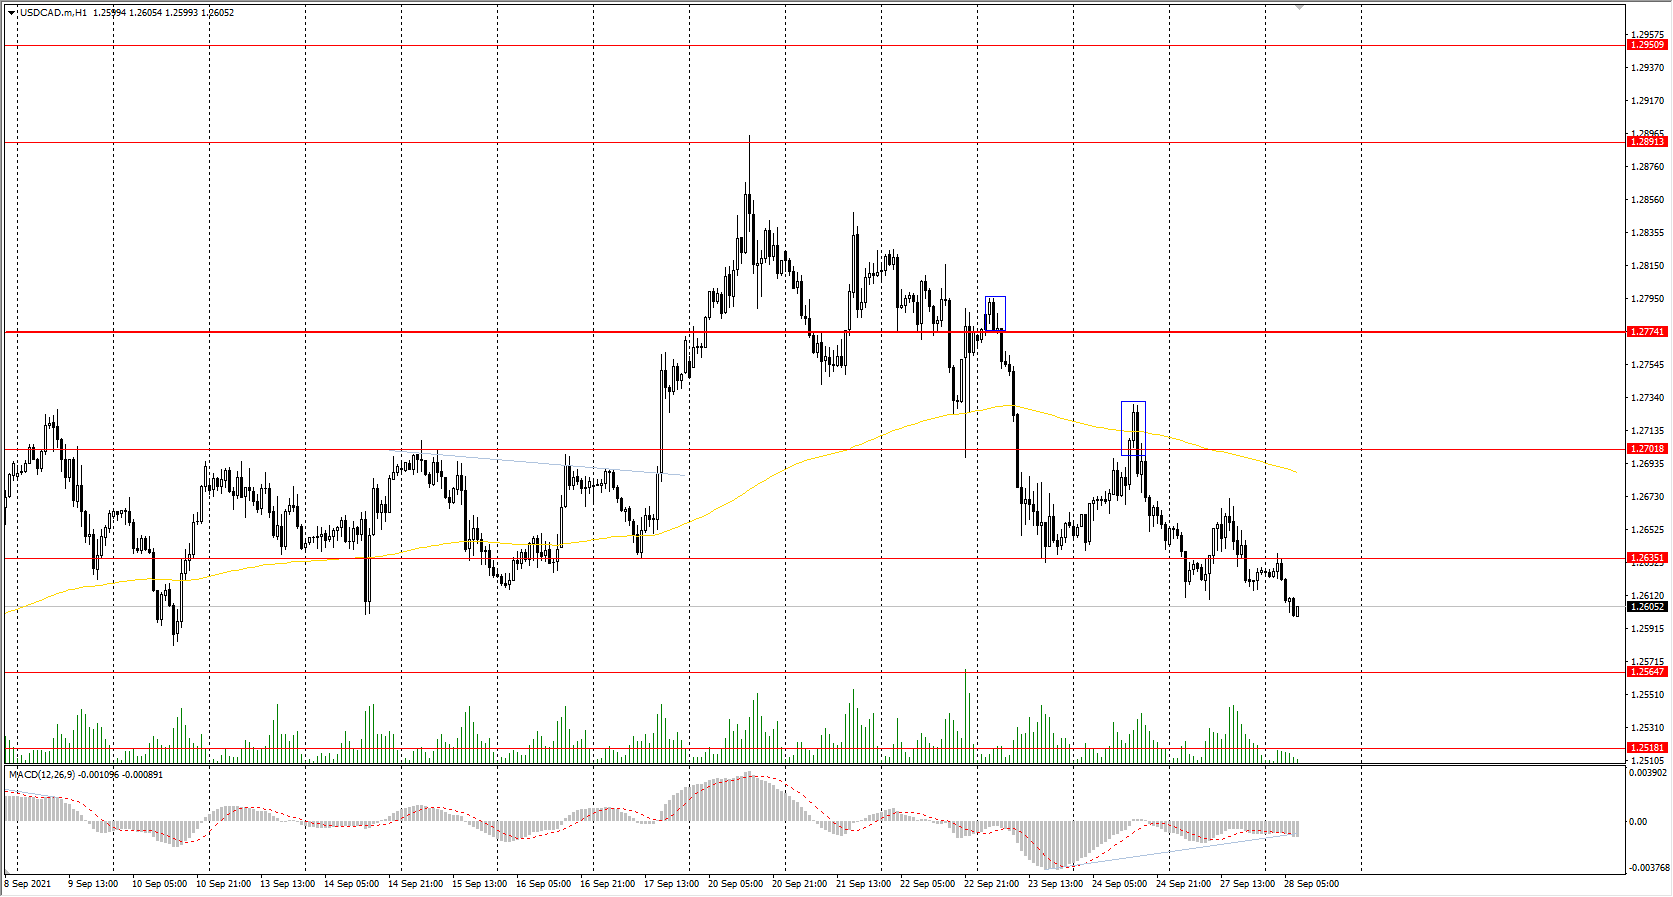
Prev Open: 1.2643
Prev Close: 1.2627
% chg. over the last day: -0.12%
The Canadian dollar is a commodity currency, so the USD/CAD currency pair is highly dependent on the dynamics of the dollar index and oil prices. Both the dollar index and oil prices increased yesterday. As a result, the USD/CAD quotes are trading flat, with a slight advantage of strengthening Canadian currency.
Trading recommendations
Support levels: 1.2565, 1.2518, 1.2425
Resistance levels: 1.2635, 1.2701, 1.2774, 1.2891
From the technical point of view, the trend has changed to bearish. The price fell below the moving average and broke through down the priority change level. The MACD indicator is negative, but there are signs of a reversal in the form of divergence. These are signs of the seller's weakness. Under such market conditions, it is better to buy only after the price returns above the 1.2635 resistance level. It is better to look for sell trades from the resistance levels near the moving average.
Alternative scenario: if the price breaks out through the 1.2774 resistance level and fixes above, the uptrend will likely resume.
EUR/GBP Daily Outlook
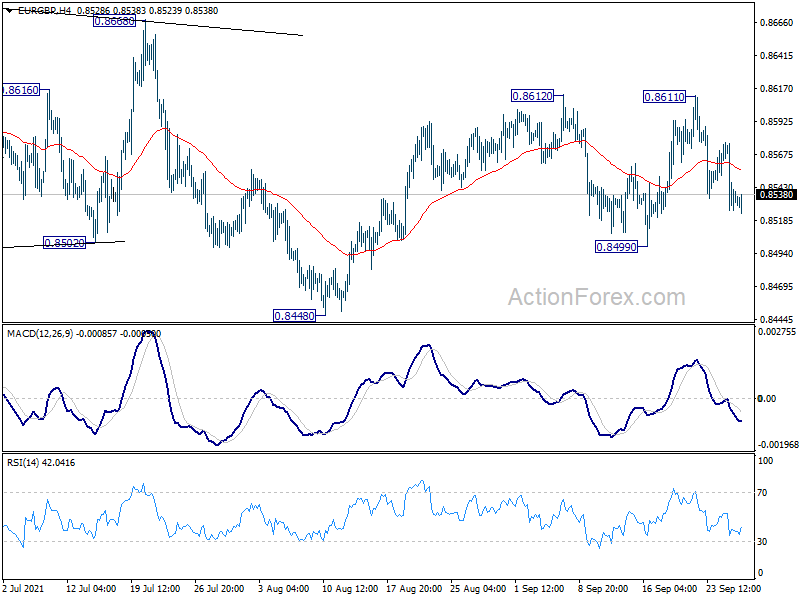
Daily Pivots: (S1) 0.8516; (P) 0.8547; (R1) 0.8568; More...
Intraday bias in EUR/GBP remains neutral as range trading continues. On the upside, break of 0.8612 will resume the whole rise from 0.8448 for 0.8668 key structural resistance. Sustained break there will be a strong sign of larger bullish reversal. On the downside, however, break of 0.8499 support will bring another fall towards 0.8448 low instead.
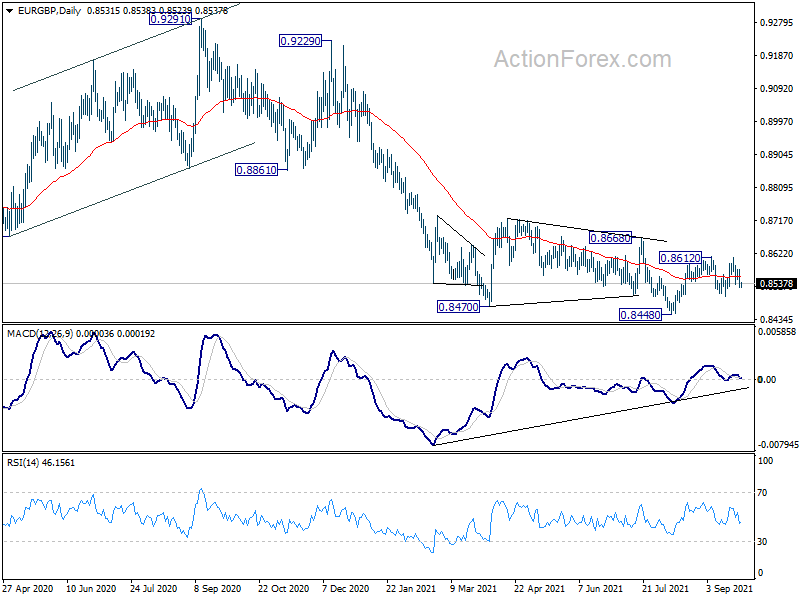
In the bigger picture, price actions from 0.9499 (2020 high) are still seen as developing into a corrective pattern. Deeper fall could be seen as long as 0.8668 resistance holds, towards long term support at 0.8276. However, firm break of 0.8668 resistance would argue that a medium term bottom was already formed. Stronger rise would be seen to 0.8861 support turned resistance to confirm completion of the corrective pattern.
EUR/AUD Daily Outlook
Daily Pivots: (S1) 1.6006; (P) 1.6085; (R1) 1.6132; More...
EUR/AUD's fall from 1.6232 resumed by taking out 1.6050 temporary. Intraday bias is back on the downside for 1.5898 key structural support. Sustained break there will argue that whole rise from 1.5250 has completed, and turn near term outlook bearish. On the upside above 1.6232 will target 1.6434 high instead.
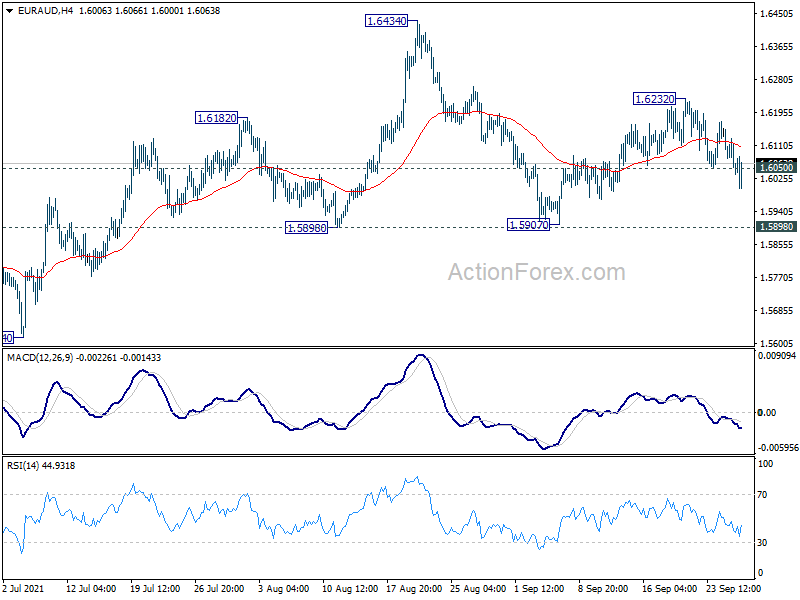
In the bigger picture, rise from 1.5250 medium term bottom is currently seen as a correction to the down trend from 1.9799 first. Stronger rise could be seen to 38.2% retracement of 1.9799 to 1.5250 at 1.6988 next. We'd tentatively expect strong resistance from there to limit upside, at least on first attempt. Meanwhile, break of 1.5898 support will indicate that the rebound has completed. Larger down trend from 1.9799 might be ready to resume through 1.5250 low.
S&P 500 Struggles To Rebound
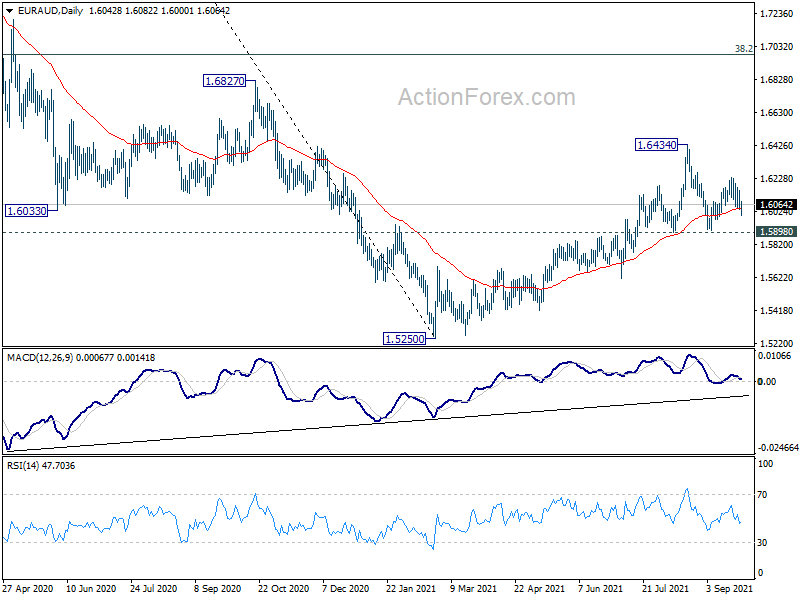
The S&P 500 halted its advance as the Fed’s taper is closing in.
The V-shaped recovery has met selling interest at 4482, the origin of a recent sell-off. A diverging RSI suggests a loss of momentum in the rebound.
The long side may regain confidence in case of a bullish breakout and 4540 would be the next target. Failing that, a drop below 4425 would prompt buyers to bail out, leaving the index vulnerable to a sharp fall.
4340 would be the last support before a deeper correction drives the index to July’s lows near 4240.
EUR/JPY Seeks Support
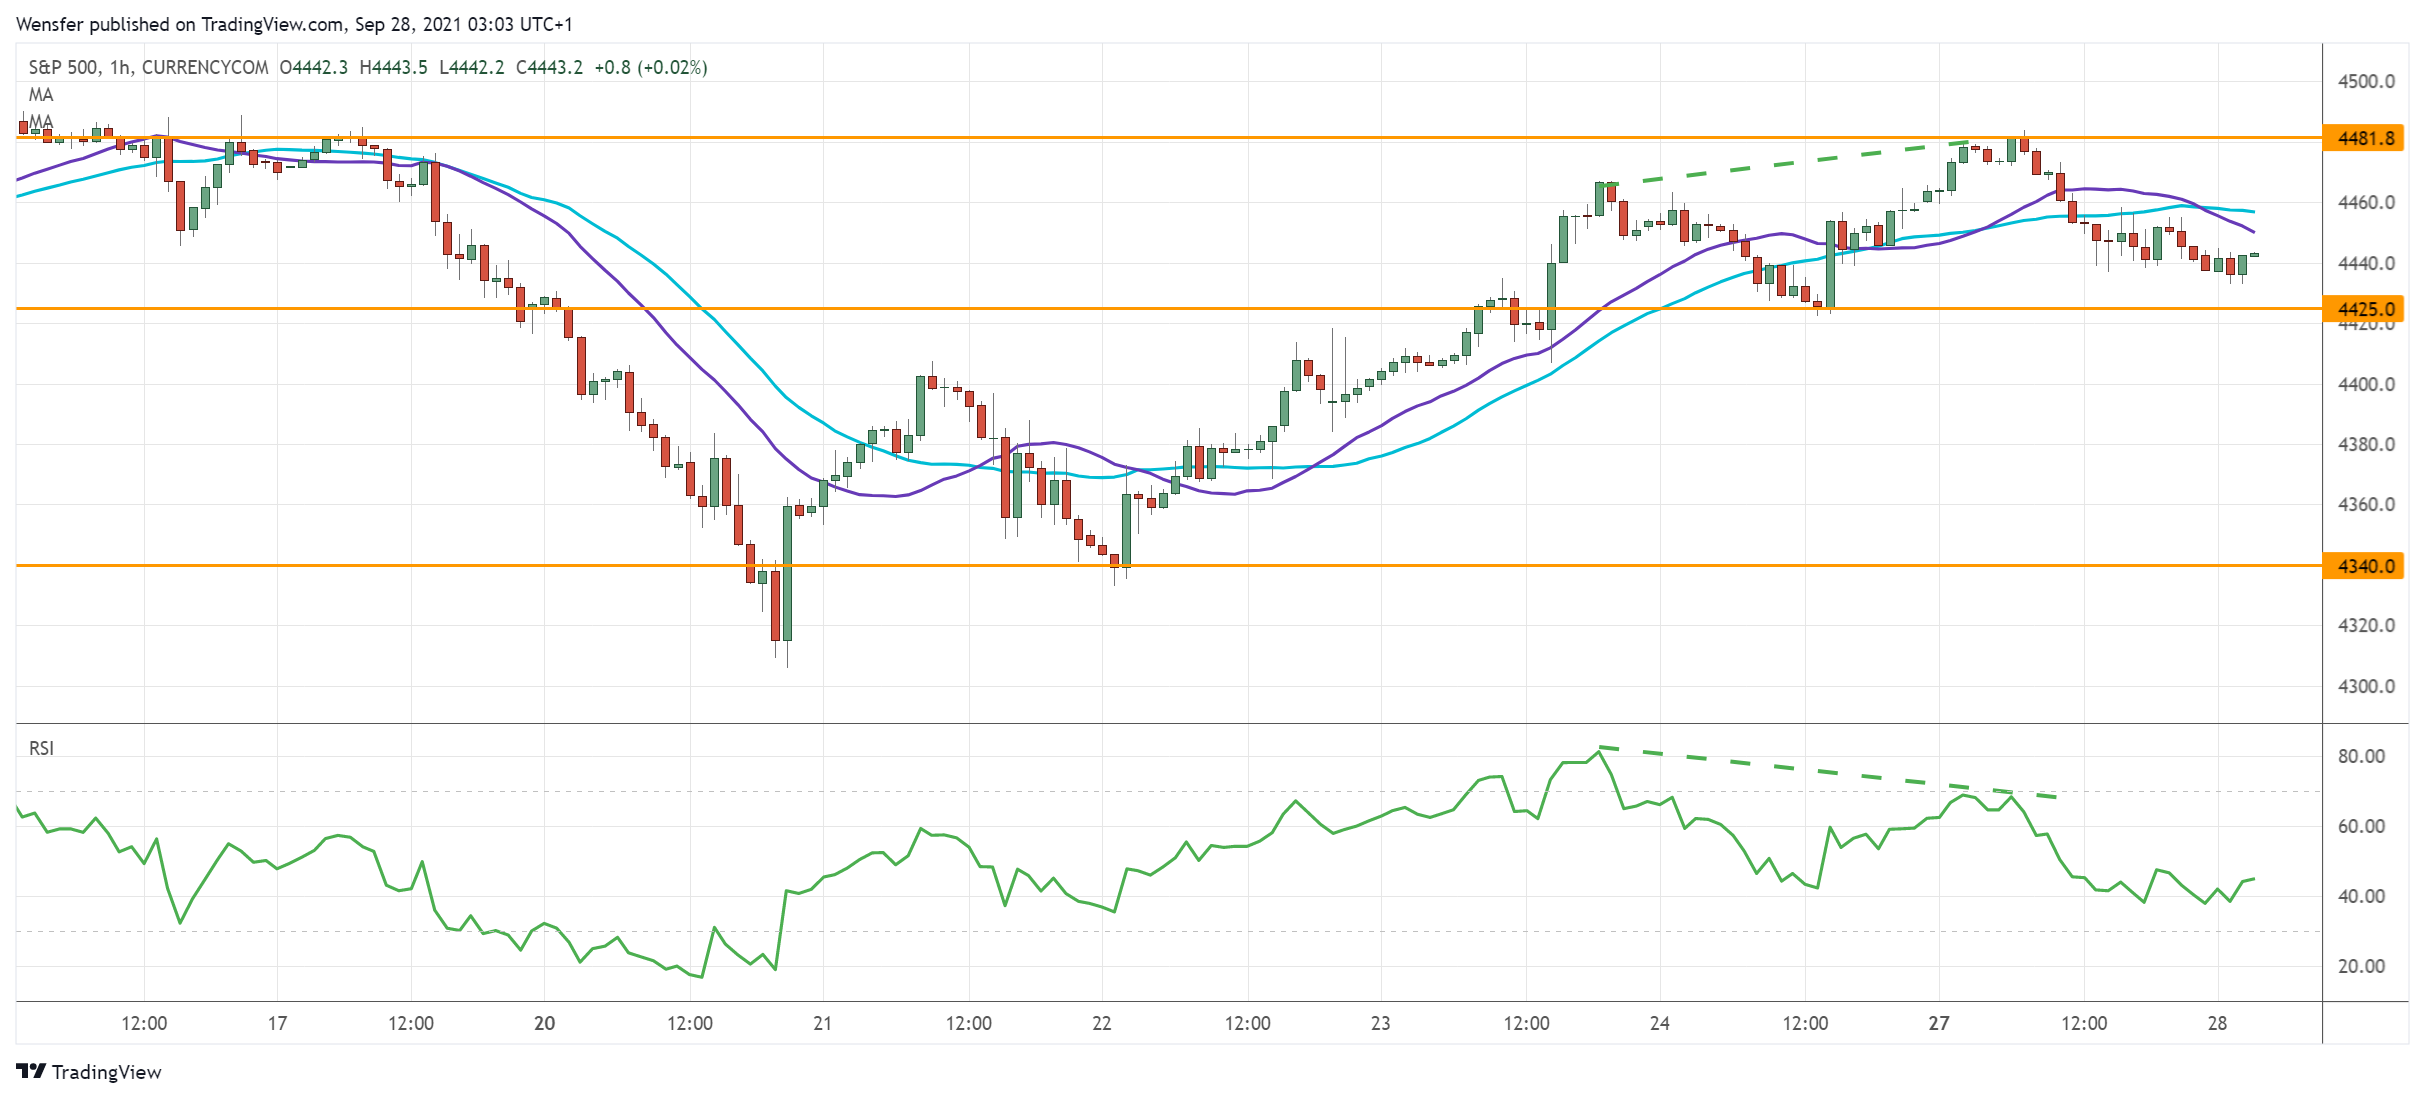
The Japanese yen weakened after the BOJ warned of a recovery delay in its meeting minutes. The euro has capitalized on its rebound from the daily demand zone around 128.00.
A close above 129.65 may have tipped the balance to the upside. A break above 130.10 would pave the way to the key resistance of 130.70 on the daily chart.
However, a descending RSI from the overbought zone is in contrast with the price’s higher highs. There is a risk of a pullback as the momentum slows down. 129.40 is the immediate support.
EUR/CHF Daily Outlook
Daily Pivots: (S1) 1.0813; (P) 1.0839; (R1) 1.0854; More....
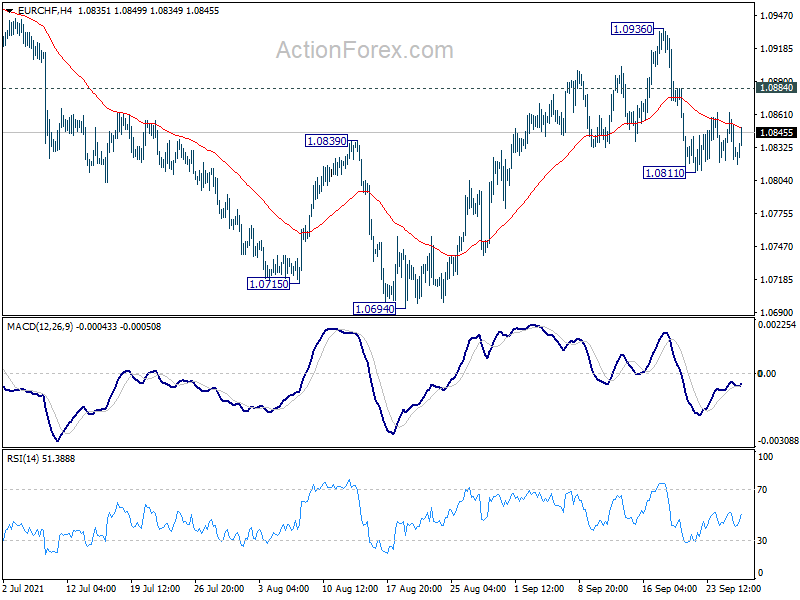
Intraday bias in EUR/CHF stays neutral for consolidation above 1.0811 temporary low. As noted before, rebound from 1.0694 has possibly completed at 1.0936 already. Break of 1.0811 will turn bias to the downside and resume the fall for retesting 1.0694 low. On the upside, however, above 1.0884 minor resistance will turn bias back to the upside for 1.0936 resistance again.
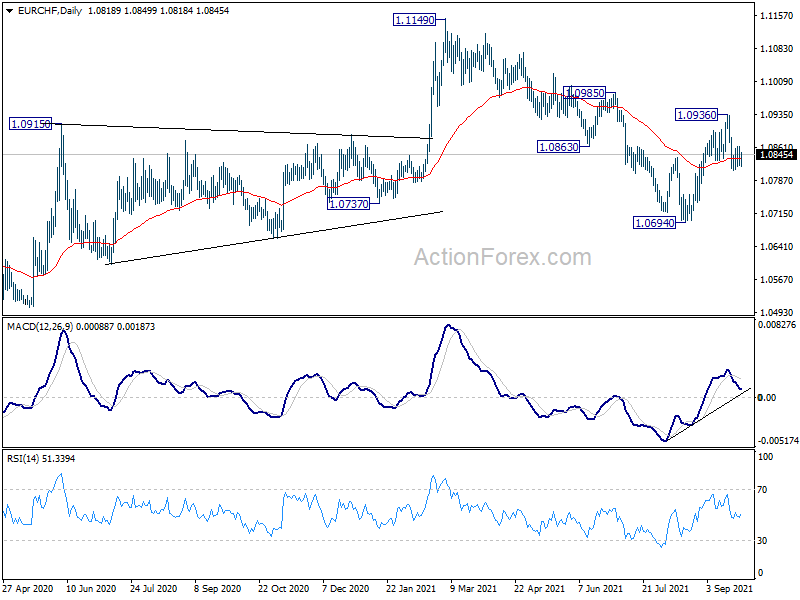
In the bigger picture, the stronger than expected rebound from 1.0694 and break of 55 week EMA (now at 1.0861) mixes up the medium term outlook. On the upside, break of 1.1149 will resume the whole rise from 1.0505 (2020 low). On the downside, break of 1.0694 will revive some medium term bearishness for 1.0505 and below.
EUR/USD Tests Major Support
The US dollar found support from better-than-expected durable goods orders.
The pair gave up all its gains from the rally in late August. This indicates an erosion in the bullish sentiment.
The euro’s latest rebound has been capped by 1.1750. Sellers are pushing towards the critical floor at 1.1665. And its breach would lead to the last line of defense at 1.1600 from November last year.
An oversold RSI may bring in some buying interest, though buyers will need to lift 1.1820 before they could hope for a bullish reversal.