

Sample Category Title
EUR/JPY Breakout Could Occur
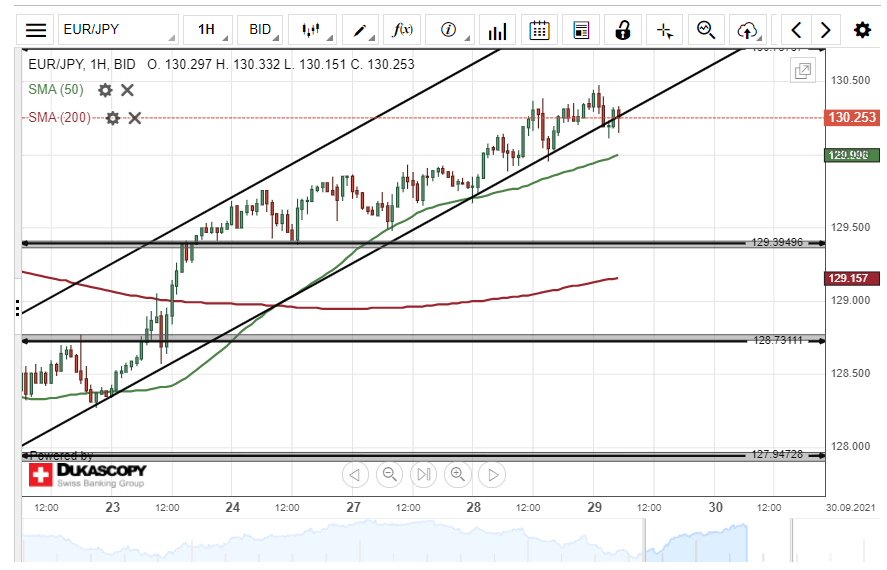
The EUR/JPY currency pair bounced off a support level, formed by the 50– hour SMA at 129.71 on Tuesday. As a result, the common European currency surged by 73 pips or 0.56% against the Japanese Yen during Tuesday's trading session.
Currently, the exchange rate is trading near the lower boundary of an ascending channel pattern and could be set for a breakout.
If the breakout occurs, a decline towards the support level at 129.50 could be expected within this session.
However, if the channel pattern holds, buyers could target the 131.00 level during Wednesday's trading session.
USD/JPY Daily Outlook
Daily Pivots: (S1) 111.09; (P) 111.36; (R1) 111.79; More...
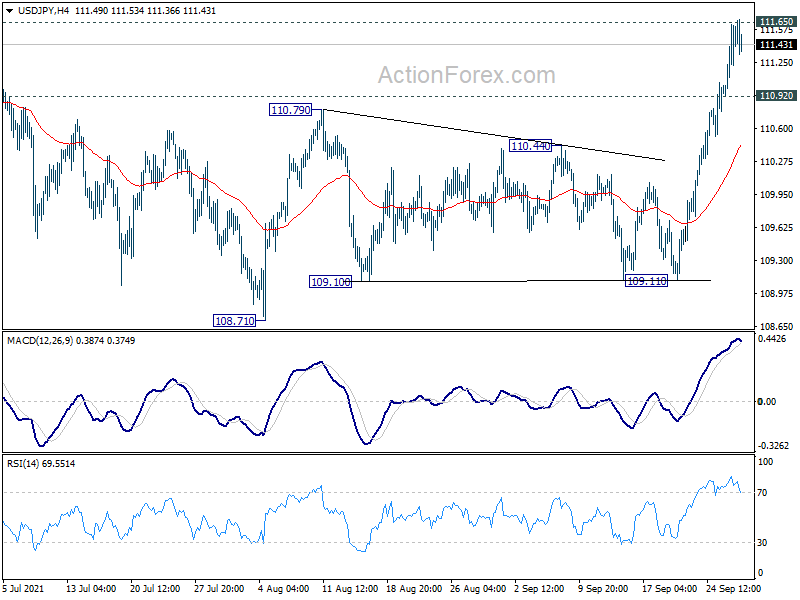
No change in USD/JPY's outlook. Intraday bias remains on the upside with focus on 111.65/71 resistance zone. Sustained break there will resume the up trend from 102.58, and suggest larger bullish trend reversal. Further rally would be seen to 114.54 resistance next. On the downside, however, break of 110.92 minor support will delay the bullish case and turn intraday bias neutral first.
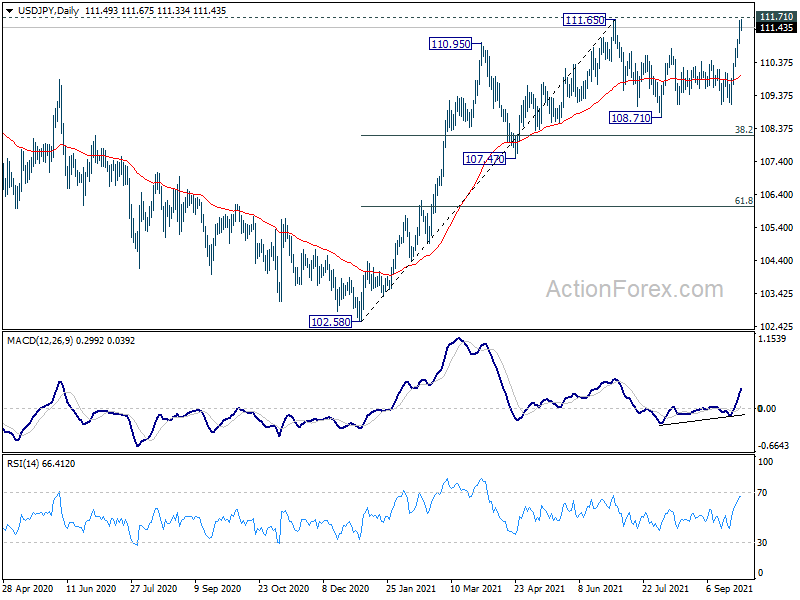
In the bigger picture, medium term outlook is staying neutral with 111.71 resistance intact. The pattern from 101.18 could still extend with another falling leg. Sustained trading below 55 day EMA will bring deeper fall to 107.47 support and below. Nevertheless, strong break of 111.71 resistance will confirm completion of the corrective decline from 118.65 (2016 high). Further rise should then be seen to 114.54 and then 118.65 resistance.
USD/JPY Pressing 110.6/7 as Treasury Yields Extend Rally
Dollar is currently the strongest one for the week so far, as helped by strong rally in treasury yields as well as pull back in stocks. Yen also stays week but the selling in crosses is cushioned by uncertain risk sentiment. Sterling is also soft with eyes on the energy troubles. But overall development is mixed in crosses with some resilience seen in Euro, Aussie and Canadian, while New Zealand Dollar is pressured.
Technically, we'd continue to focus on 111.65/71 key resistance zone in USD/JPY. Sustained break of this zone would signal larger bullish trend reversal. As the same the, if that happens, we'd look at EUR/USD's reaction to 1.0633 low to confirm if that's about underlying buying momentum in Dollar.
In Asia, at the time of writing, Nikkei is down -2.36%, back below 30k handle. Hong Kong HSI is down -0.39%. China Shanghai SSE is down -1.47%. Singapore Strait Times is up 0.08%. Japan 10-year JBG yield is down -0.0076 at 0.067. Overnight, DOW dropped -1.63%. S&P 500 dropped -2.04%. NASDAQ dropped -2.83%. 10-year yield rose 0.050 to 1.534.
US 5-yr yield breaks 1% handle, NASDAQ lost 2.8%
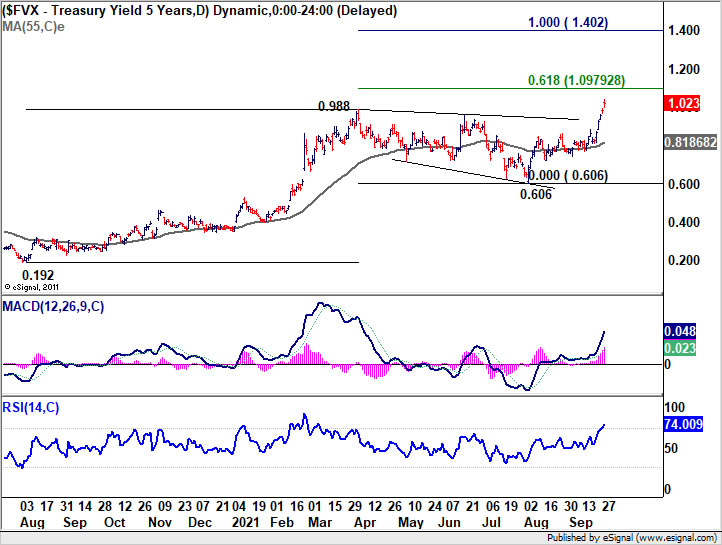
The strong rally in US treasury yields continued overnight, with 5-year yield closing up 0.040 at 1.023, back above 1% handle finally. The break of 0.988 high indicates resumption of whole up trend from 0.192. Next target is 61.8% projection of 0.192 to 0.988 from 0.606 at 1.098. For now, we're not expecting a strong break there, at least for the first attempt.
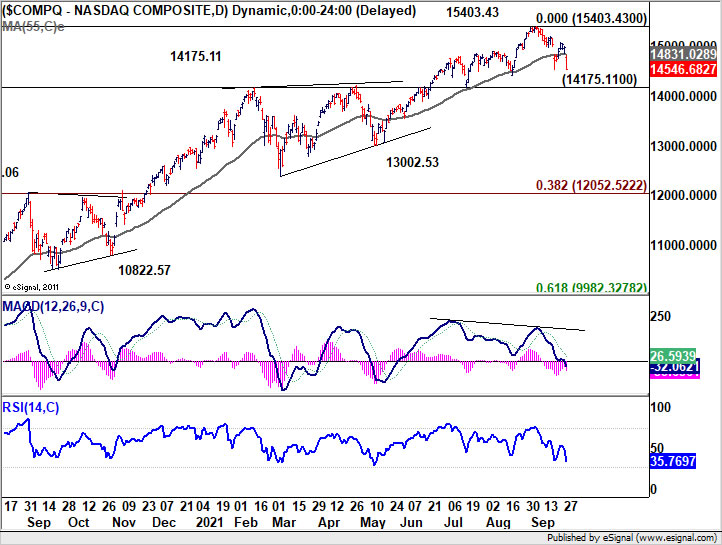
US stocks tumbled deeply together with the surge in treasury yields. NASDAQ lost -2.83% to close at 14546.68, back below 55 day EMA. For now, while deeper correction cannot be ruled out, we'd look for strong support from 14175.11 resistance turned support to contain downside and bring rebound. However, sustained break of 14175.11, accompanied by a strong break of 1.098 in FVX mentioned above, could indicate that the underlying trend in the stock markets has turned. That would open up the case for NASDAQ to drop further to 13002.52 support and possibly below in the medium term.
Fed Bostic: We are on firm footing towards a full recovery
Atlanta Fed president Raphael Bostic said yesterday that, "at the end of the day the trajectory of the economy is solid." He added, "my models and the data I am seeing suggest we are on firm footing towards a full recovery and momentum is going to continue strong even amidst the rise of Delta."
Separately, Fed Chair Jerome Powell told the Senate Banking Committee, "what I said last week was that we had all but met the test for tapering." He added, "I made it clear that we are, in my view, a long way from meeting the test for maximum employment."
ECB Kazimir: PEPP will be terminated with the end of the pandemic
ECB Governing Council member said Peter Kazimir said "Concerns about the cliff effect (of ending PEPP) cannot automatically mean demands for increasing the standard programs (APP)". "There is no automatic formula," he said. "We'll be deciding according to conditions at the given time."
He also said, the PEPP has been "functioning very well and naturally it is now in the final stage of its life cycle." "It's a special tool designed for a special situation, and it will be phased out when it's not needed anymore," he added. "The market seems to understand that this tool will be terminated with the end of the pandemic."
"If inflation remains elevated next year because of supply bottlenecks, my concern is that it could spill into wage negotiations for the following year as well," he said. But "we are not seeing this happening in key countries so far."
Japan's GPIF will not investment in Chinese government bonds
Japan's Government Pension Investment Fund (GPIF) said it will not investment in Chinese government bonds, even though FTSE Russell's World Government Bond Index starts to include them in October. GPIS is the world's largest pension fund, with total assets of JPY 192T.
Masataka Miyazono, president of GPIF, said, "Chinese government bonds cannot be settled in an international settlement system that can be used for other major government bonds. The market's liquidity is still limited compared with the size of GPIF's investment scale. Trading of futures is not allowed for foreign investors."
On the data front
UK BRC shop price dropped -0.5% yoy in August. Looking ahead, Swiss ZEW expectations, UK mortgage approvals and M4 money supply, Eurozone economic sentiment will be released in European session. Later in the day US will release pending home sales. But major focuses would likely be on comments of ECB President Christine Lagarde, BoE Governor Andrew Bailey, BoJ Governor Haruhiko Kuroda, and Fed Chair Jerome Powell.
USD/JPY Daily Outlook
Daily Pivots: (S1) 111.09; (P) 111.36; (R1) 111.79; More...
No change in USD/JPY's outlook. Intraday bias remains on the upside with focus on 111.65/71 resistance zone. Sustained break there will resume the up trend from 102.58, and suggest larger bullish trend reversal. Further rally would be seen to 114.54 resistance next. On the downside, however, break of 110.92 minor support will delay the bullish case and turn intraday bias neutral first.
In the bigger picture, medium term outlook is staying neutral with 111.71 resistance intact. The pattern from 101.18 could still extend with another falling leg. Sustained trading below 55 day EMA will bring deeper fall to 107.47 support and below. Nevertheless, strong break of 111.71 resistance will confirm completion of the corrective decline from 118.65 (2016 high). Further rise should then be seen to 114.54 and then 118.65 resistance.
Economic Indicators Update
| GMT | Ccy | Events | Actual | Forecast | Previous | Revised |
|---|---|---|---|---|---|---|
| 23:01 | GBP | BRC Shop Price Index Y/Y Aug | -0.50% | -0.80% | ||
| 8:00 | CHF | ZEW Expectations Sep | -7.8 | |||
| 8:30 | GBP | Mortgage Approvals Aug | 73K | 75K | ||
| 8:30 | GBP | M4 Money Supply M/M Aug | 0.30% | 0.10% | ||
| 9:00 | EUR | Eurozone Economic Sentiment Indicator Sep | 117.5 | |||
| 9:00 | EUR | Eurozone Services Sentiment Sep | 18.8 | 16.8 | ||
| 9:00 | EUR | Eurozone Industrial Confidence Sep | 13.4 | 13.7 | ||
| 9:00 | EUR | Eurozone Consumer Confidence Sep F | -4 | |||
| 9:00 | EUR | Eurozone Business Climate Sep | 1.75 | |||
| 14:00 | USD | Pending Home Sales M/M Aug | 1.10% | -1.80% | ||
| 14:30 | USD | Crude Oil Inventories | -3.5M |
US 5-yr yield breaks 1% handle, NASDAQ lost 2.8%
The strong rally in US treasury yields continued overnight, with 5-year yield closing up 0.040 at 1.023, back above 1% handle finally. The break of 0.988 high indicates resumption of whole up trend from 0.192. Next target is 61.8% projection of 0.192 to 0.988 from 0.606 at 1.098. For now, we're not expecting a strong break there, at least for the first attempt.
US stocks tumbled deeply together with the surge in treasury yields. NASDAQ lost -2.83% to close at 14546.68, back below 55 day EMA. For now, while deeper correction cannot be ruled out, we'd look for strong support from 14175.11 resistance turned support to contain downside and bring rebound. However, sustained break of 14175.11, accompanied by a strong break of 1.098 in FVX mentioned above, could indicate that the underlying trend in the stock markets has turned. That would open up the case for NASDAQ to drop further to 13002.52 support and possibly below in the medium term.
Japan’s GPIF will not investment in Chinese government bonds
Japan's Government Pension Investment Fund (GPIF) said it will not investment in Chinese government bonds, even though FTSE Russell's World Government Bond Index starts to include them in October. GPIS is the world's largest pension fund, with total assets of JPY 192T.
Masataka Miyazono, president of GPIF, said, "Chinese government bonds cannot be settled in an international settlement system that can be used for other major government bonds. The market's liquidity is still limited compared with the size of GPIF's investment scale. Trading of futures is not allowed for foreign investors."
Fed Bostic: We are on firm footing towards a full recovery
Atlanta Fed president Raphael Bostic said yesterday that, "at the end of the day the trajectory of the economy is solid." He added, "my models and the data I am seeing suggest we are on firm footing towards a full recovery and momentum is going to continue strong even amidst the rise of Delta."
Separately, Fed Chair Jerome Powell told the Senate Banking Committee, "what I said last week was that we had all but met the test for tapering." He added, "I made it clear that we are, in my view, a long way from meeting the test for maximum employment."
Market Morning Briefing: Pound Plunged Sharply Yesterday To 1.3520
STOCKS
Global equities trade lower and may continue to fall for the near term before any reversal is seen again. Dow and Dax can fall towards 34000-33500 and 15200-15000 respectively while Nikkei and Shanghai may break below 29400 and 3500 to head lower. Nifty and Sensex needs to sustain the recovery seen yesterday else could be vulnerable to a sharp decline over the next few sessions that could drag them lower towards 17400/200 and 59000 respectively.
Dow (34299.99, -569.38, -1.63%) fell sharply and failed to break above 35000-35250 region possibly pausing at current levels. A dip to 34000-33500 cannot be negated on the downside.
DAX (15248.56, -325.32, -2.09%) fell sharply and while the momentum continues, a further decline towards 15000 looks possible before a pause is seen. 15200-15000 is an important zone.
Nikkei (29442.14, -741.82, -2.46%) plunged more than 700 points in a single session. A fall to 29000-28500 cannot be negated if the fall continues with such strong momentum.
Shanghai (3523.22, -79.00, 2.20%) has broken below immediate support near 3550-3525 and while it trades below 3525, it can fall towards 3450-3400 in the near term. However, we would see if the index bounces while above 3500.
Nifty (17748.60, -106.50, -0.60%) dipped to levels below 17600 yesterday and recovered but will the fall in global equities drag down Nifty towards 17400/200 or will the recovery seen yesterday take it higher to 18000 again? We would wait to see how it fares today.
Sensex (59667.60,-410.28, -0.68%) fell below 60000 yesterday but we would wait to see if it continues to fall lower today also and slowly head towards support at 59000.
COMMODITIES
Crude prices have fallen as expected from respective resistance zone and can come down further in the near term. However we would wait for confirmation on a decline below 74 on WTI and below 76 on Brent. Gold tested 1728 and rose back but we cannot negate a fall again towards 1725-1700. However we would be careful at current levels. Silver has dipped too and can test 22 before bouncing back higher. Copper is bullish towards 4.30/40 while above 4.00/10
Brent (78.11) came down well as expected as resistance near $80.75 holds on Brent. A decline towards $75-70 looks possible eventually but we would need initial confirmation on a break below $76 for ensuring a top is in place.
WTI (74.40) has also fallen as expected and could be headed towards $72-71 on the downside in the near term. Similar to Brent, we would need confirmation of a reversal on a break below $74 on WTI.
Gold (1738.30) fell to test 1728 unable to rise past 1780 on the upside. A slow fall to 1725-1700 cannot be negated while below 1780. However we would be careful at current levels.
Silver (22.55) has come down to test 22.40/50 and while above 22, there are chances of a decent fall towards 22 before rising back towards 23-23.50 in the medium term. .
Copper (4.2460) has dipped a bit but remains bullish towards 4.30/40 while above crucial support at 4.0/10.
FOREX
Volatility continues in currencies. Aussie and Pound fell sharply but are likely to recover. Dollar Index has crucial resistance near 93.80-94.00 which if holds can drag it lower towards 93.50-92.75 soon. Euro can trade sideways while above 1.1665 between 1.1750-1.1665 but a break on the downside to test 1.1625-1.16 cannot be negated. EURJPY tests important resistance at 130.50 and can fall from there. Dollar Yen may not rise above 112 and eventually come off while 112 holds. USDCNY is likely to trade within 6.44/45-6.48 region. USDINR can test 74.20/25 before falling off from there. Break above 74.25 may take it higher to 74.45/50.
Dollar Index (93.708) tested 93.80 yesterday. Note that 93.80-94.00 is an important resistance zone and while that holds, the index could come off in the near term towards 93.50-93.00.
Euro (1.1683) although below 1.17 has not sustained break below 1.1665 and hence could show some sideways range within 1.1665-1.1750 region for sometime. Our bearish view for medium term towards 1.1625-1.1600 remains intact but would gain weightage on a sustained break below 1.1665. Such a fall could be rather slow. We remain cautious near current levels.
EURJPY (130.19) almost tested 130.50 before coming off from there. While 130.50 holds as decent resistance, a rise to 131 or higher seems difficult. Any rejection from here can take the cross down to 129.50 again.
Dollar-Yen (111.46) may find difficulty to rise above 112 and could decline from there back towards 111.20-110.80 in the coming sessions while resistance at 112 holds.
Aussie (0.7243) has risen slightly from 0.7225 seen yesterday. A rise from current levels is needed for Aussie to move up towards 0.73 eventually. Watch price action near current levels.
Pound (1.3544) plunged sharply yesterday to 1.3520. While above 1.35, there is still scope to see a bounce back to 1.36/37 in the medium term. Any break below 1.35 would make it vulnerable to a sharp fall in the coming weeks.
USDCNY (6.4666) opened sharply higher near 6.4751 but has fallen from there. While resistance near 6.47/48 holds, the pair can be ranged within 6.48-6.45/44 for the medium term.
USDINR (74.0450) tested 74.1175 on the onshore markets but has tested 74.25 on the NDF. A fall from there is expected towards 73.90/80 before again resuming to rise further. We may look for initial resistance at 73.20/25 and higher near 73.45/50 which is likely to hold for the medium term. Downside is likely to be limited to 73.80.
INTEREST RATES
The US Treasury yields continue to move up. But we see limited room left on the upside as important resistances are coming up on the charts. As such we will be cautious for a possible reversal in the Treasury yields either from here itself or after a slight extension on the upside. The German yields sustain higher and can rise further from here before reversing lower again. The 10Yr and 5Yr GoI can rise in the near-term to test their key resistances and then reverse lower.
The US 2Yr (0.30%), 5Yr (0.1.01%), 10Yr (1.54%) and the 30Yr (2.09%) Treasury yields have risen further. The 10Yr and 30Yr have risen above 1.5% and 2% respectively. It will have to be seen if the yields are reversing lower from here itself or after a slight extension towards 1.6% (10Yr) and 2.2% (30Yr). The price action in the next few sessions will need a close watch.
The German 2Yr (-0.70), 5Yr (-0.55%), 10Yr (-0.20%) and 30Yr (0.26%) yields continue to move up. Our view of seeing a test of 0.3%-0.35% on the 30Yr remains intact. The 10Yr can rise to -0.1% on a break above -0.20%. Thereafter we can expect the yields to come down again.
The Indian 10Yr GoI (6.2281%)has surged further yesterday and can head up towards 6.25%-6.26% as mentioned yesterday. The 5Yr GoI (5.6749%) on the other hand fell to a low of 5.6236% yesterday but had risen back well from there. 5.7% is the key immediate resistance which if broken can take the 5Yr up to 5.76% and higher in the coming days. Support is at 5.64%.
Elliott Wave View: Nasdaq (NQ_F) 5 Swing Bearish Sequence Favors More Downside
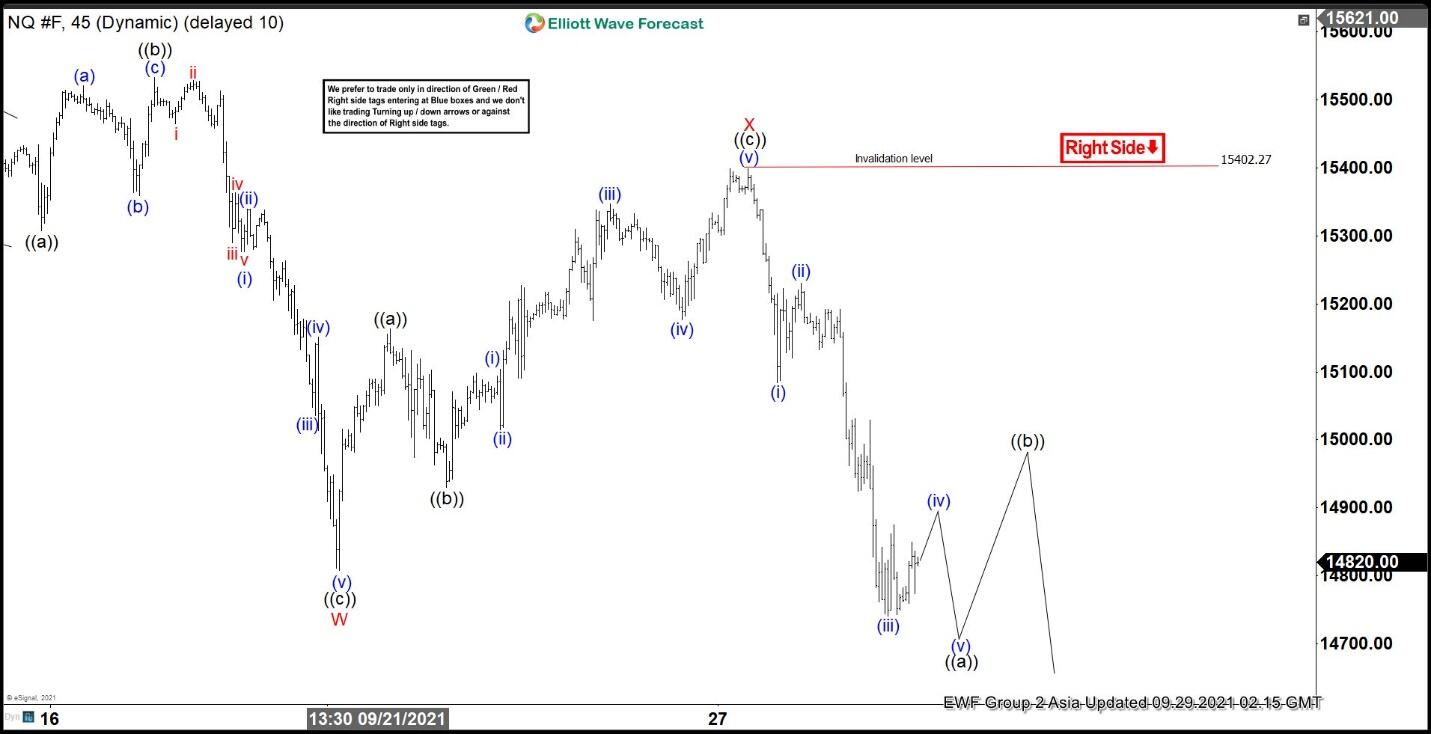
Short Term view in Nasdaq (NQ_F) suggests the decline from Sept 6, 2021 peak is unfolding as a double three Elliott Wave structure. Down from Sept 6 peak, wave W ended at 14807.5 as a zigzag structure. Wave ((a)) of W ended at 15307.75 and rally in wave ((b)) of W ended at 15532.50. The third leg wave ((c)) of W lower ended at 14807.50. Rally in wave X has also ended at 15402.27 as a zigzag structure. Up from wave W, wave ((a)) ended at 15163.25, pullback in wave ((b)) ended at 14930.50, and wave ((c)) of X ended at 15402.27.
Index has turned lower within wave Y with internal subdivision as a zigzag structure. Down from wave X, wave (i) ended at 15084 and bounce in wave (ii) ended at 15230.75. Wave (iii) lower ended at 14740.75. Expect a rally in wave (iv) to follow and then another turn lower to finish wave (v) as well as wave ((a)). Afterwards, it should rally in wave ((b)) to correct cycle from September 27 peak before the decline resumes again. Near term, as far as pivot at 15402 high remains intact, expect rally to fail in 3, 7, or 11 swing for more downside.
NQ_F 45 Minutes Elliott Wave Chart
Crude Oil Price Rallies While Dollar Extends Increase
Key Highlights
- Crude oil price started a fresh rally above $70.00 and $75.00.
- A key rising channel is forming with support near $74.30 on the 4-hours chart of XTI/USD.
- EUR/USD extended its decline below the 1.1700 support zone.
- GBP/USD declined heavily below 1.3650 and 1.3600.
Crude Oil Price Technical Analysis
After forming a support base above $70.00, crude oil price started a fresh rally against the US Dollar. The price broke the $72.50 resistance zone to move into a positive zone.
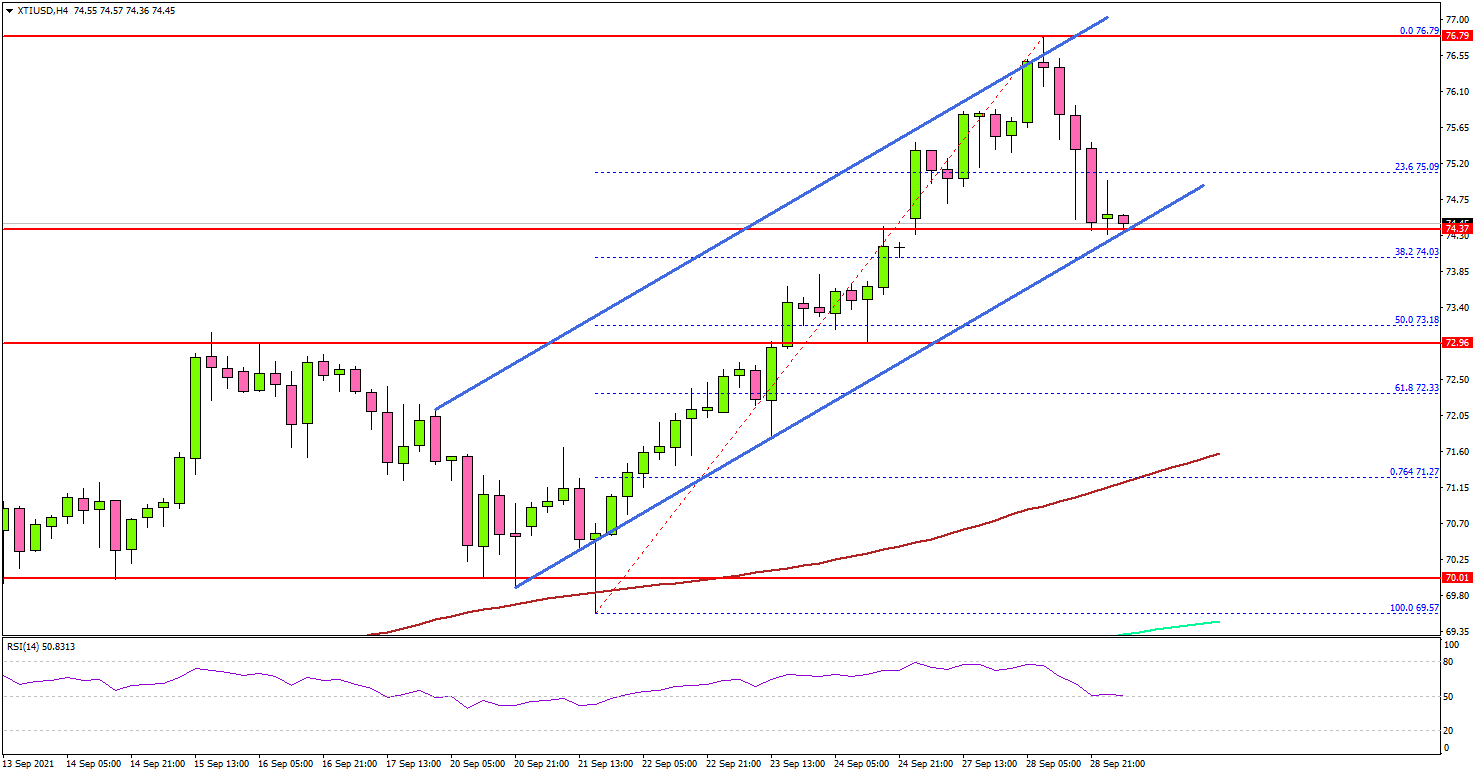
Looking at the 4-hours chart of XTI/USD, the price even climbed above the $75.00 resistance zone. The price even spiked above $76.50, and it settled above the 100 simple moving average (4-hours, red) and the 200 simple moving average (4-hours, green).
A high was formed near $76.79 before it started a minor downside correction. There was a break below the $75.50 level. On the downside, an immediate support is near the $74.40 level.
The first major support is near $74.30. There is also a key rising channel forming with support near $74.30 on the same chart. The next major support is near $73.20 and the 50% Fib retracement level of the upward move from the 69.57 swing low to $76.79 high.
Any more losses could open the doors for a move towards the $72.00 support. On the upside, an initial resistance is near the $75.50 level. The next major resistance is near the $76.50 level, above which the price could rise towards the $78.00 level.
Looking at EUR/USD, the pair started a fresh decline below the 1.1700 support zone. Besides, GBP/USD accelerated lower below the key 1.3600 support zone.
Economic Releases to Watch Today
- Euro Zone Consumer Confidence for Sep 2021 – Forecast -4, versus -4 previous.
- Euro Zone Services Sentiment for Sep 2021 – Forecast 16.5, versus 16.8 previous.
- US Pending Home Sales for August 2021 (YoY) - Forecast +14.5%, versus -8.5% previous.
Eco Data 9/29/21
[php_everywhere instance="1"]