

Sample Category Title
USD Gains As US Yields Continue To Rise
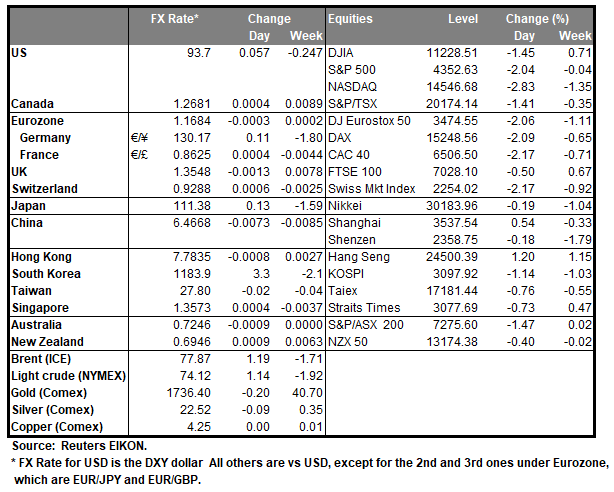
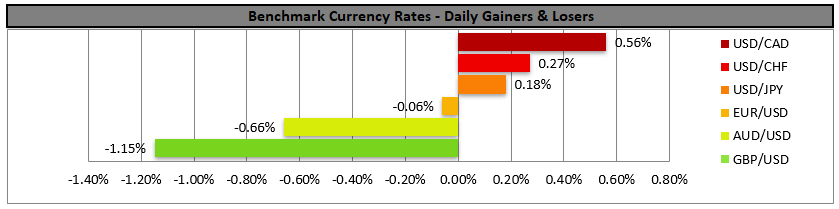
The USD tended to gain against some of its major counterparts yesterday as US yields continued to rise and investors prepare for a possible tapering of the Fed’s QE program. It should be noted that Fed Chairman Powell yesterday warned US lawmakers that the acceleration of inflation could outlast prior expectations, highlighting the bank’s hawkishness, while he is scheduled to make more statements today, this time at ECB’s central banking forum. At the same time US yields continue to rise and its characteristic that the 10 year yield reached a new three month high. Also, in US fundamentals we note the stalemate in the US Congress standoff, about the rise or elimination of the US national debt ceiling. Should the debt ceiling not rise or be eliminated by US lawmakers, we may see the US government running out of money in the next month. US stock markets suffered substantial losses, with all three main indexes being in red territory for the day and the tech sector being particularly victimised by the market’s mood, while also gold dropped as the USD strengthened and US yields continued to rise. We may see fundamentals continuing to lead the market as only a few high impact financial releases are due out from the US today.
The USD index rose yesterday floating just above the 93.70 (S1) resistance line, which has for now, turned to support. As the index broke the upper boundary of its prior upward channel movement, the rise seems to have accelerated thus maintaining our bullish outlook. The RSI indicator below our 4-hour chart is near the reading of 70 confirming the bulls’ dominance yet that may imply that a correction lower could be in the cards for the index. Please note that the pair is currently at levels last reached one month ago and prior to that not visited by the index since November last year. Should the bulls actually continue to guide the index we may see it aiming for the 94.10 (R1) resistance line. Should the bears take over, we may see the index breaking below the 93.70 (S1) and aim if not breach the 93.20 (S2) support level.
Pound falls as fuel shortages seem to persist
The pound dropped against the USD, EUR and JPY yesterday as worries for the recovery of the UK economy along with a risk off sentiment were present in the markets, and its characteristic that the fuel shortages in various petrol stations in the UK are still present. The UK government seems about ready to deploy the military in order to face the supply issues present in the energy sector, given that lorry drivers are in short supply to actually transport the fuel to the stations. Also panic buying of fuel seems to be present in the UK intensifying the issue further and its characteristic that vendors are reported to have started to ration sales. On the other hand, pound traders may keep in the back of their minds, BoE’s confident stance, which could provide some support for the sterling, should market worries ease somewhat. We expect that given the lack of high impact financial releases from the UK, fundamentals may take the lead, guiding the pound.
GBP/USD dropped yesterday breaking the 1.3600 (R1) support line, now turned to resistance. We tend to maintain a bearish sentiment for the pound given that the pairs’ RSI indicator below our 4-hour chart is at the reading of 30, albeit some signs of stabilisation seem to be present. Should the selling interest be extended we may see the pair aim if not break the 1.3430 (S1) support line, while should a correction higher take place we may see cable breaking the 1.3750 (R1) line, paving the way for the 1.3750 (R2) level.
Other economic highlights today and the following Asian session:
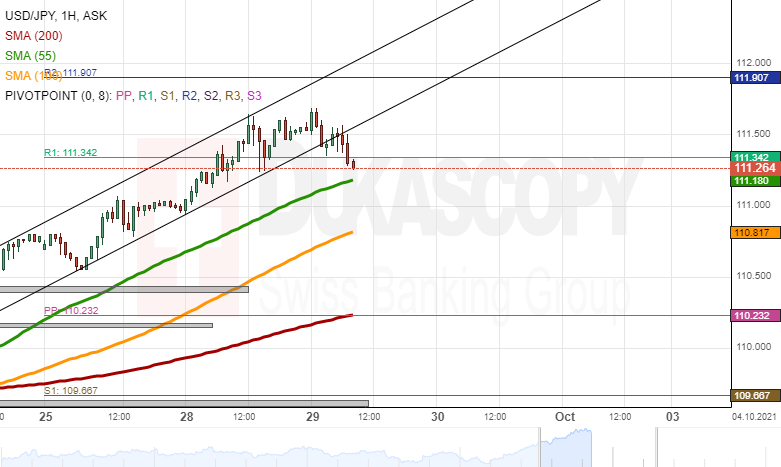
Today during the European session, we get Eurozone’s business climate and economic sentiment for September. In the American session, we get Canada’s producer prices for August, the US pending home sales and the weekly EIA crude oil inventories. During tomorrow’s Asian session, we get Japan’s preliminary industrial production for August and China’s manufacturing PMIs for September.
USD index H4 Chart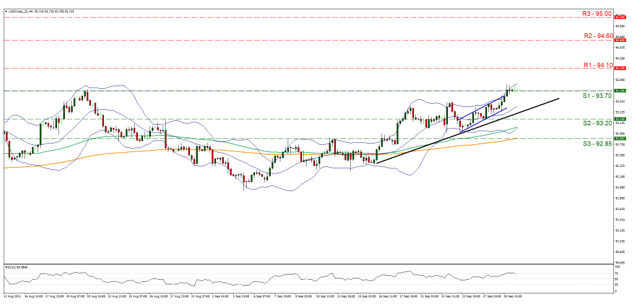
Support: 93.70 (S1), 93.20 (S2), 92.85 (S3)
Resistance: 94.10 (R1), 94.60 (R2), 95.00 (R3)
GBP/USD H4 Chart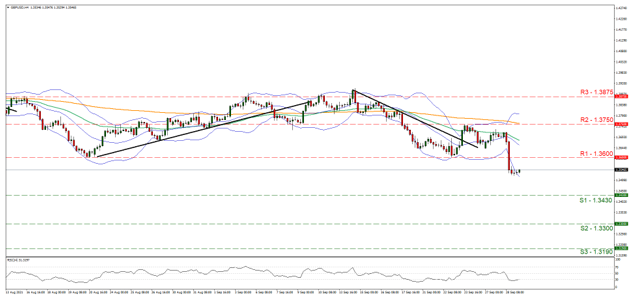
Support: 1.3430 (S1), 1.3300 (S2), 1.3190 (S3)
Resistance: 1.3600 (R1), 1.3750 (R2), 1.3875 (R3)
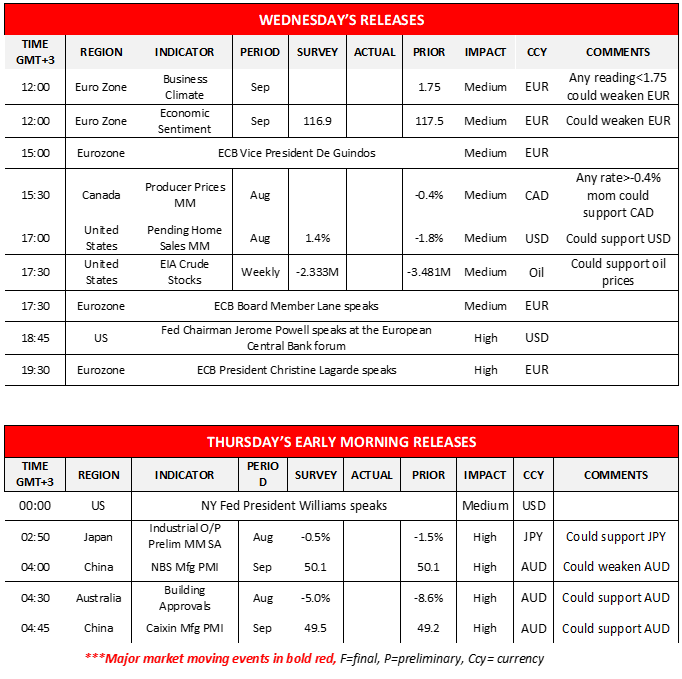
EUR/USD Analysis: Reveals New Pattern
First of all, on Wednesday the EUR/USD currency exchange rate reached a new low level, as it almost touched the 1.1650 mark. In addition, the currency exchange rate has revealed a channel down pattern, which has guided it since September 24.
In the case of the rate continuing to decline, the pair might look for support in the weekly S2 simple pivot point at 1.1648 and the 1.1650 mark. A passing of these levels could result in an eventual decline to the 1.1613 level, where the weekly S3 simple pivot point was located at.
On the other hand, a recovery from the lower trend line of the channel down pattern or the weekly S2 and the 1.1650 level could aim at the resistance of the channel. Note that a passing of the upper trend line of the channel could result in a surge up tot eh 1.1685 level, where the weekly S1 simple pivot point was located at.
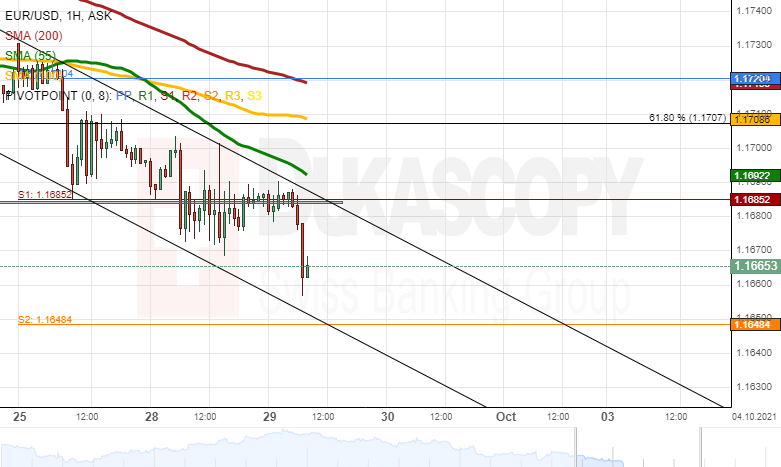
GBP/USD Analysis: Plummets To 1.3500
The Tuesday drop of the GBP/USD consolidated during the second part of the day's trading. On Wednesday morning, the pair resumed the decline, as the rate almost touched the 1.3500 mark. Moreover, the pair had no technical support as low as 1.3463, where the weekly S3 simple pivot point was located at.
In the case that the GBP/USD pair reaches below the 1.3500 level, it would look for support in the weekly S3 simple pivot point at 1.3463. Afterwards, below the pivot point, the 1.3450 mark could provide support.
Meanwhile, a potential recovery might encounter resistance in the weekly S2 simple pivot point before aiming at the cluster of summer low levels from 1.3573 to 1.3608.
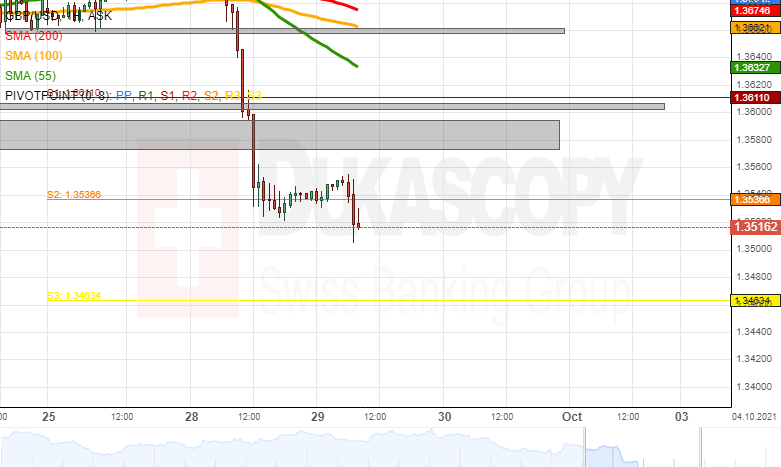
USD/JPY Analysis: Breaks Pattern
Since September 23, the USD/JPY was sharply surging in a channel up pattern. On Wednesday morning, the rate booked a new high level, as it touched the 111.68 level. However, the booking of the new high level was followed by a decline. The decline passed below the lower trend line of the narrow channel up pattern, which captured the rate's surge.
The decline of the pair could find support in the 55-hour simple moving average near the 111.20 level. Below the 55-hour SMA, the 100-hour simple moving average near 110.80 could provide support. Meanwhile, note that the simple R1 simple pivot point at 111.34 managed to provide support for a couple of hours during Wednesday's morning hours.
In the case of the USD/JPY recovering, the pair might find resistance, first in the weekly R1 simple pivot point at 111.34. Afterwards, the weekly R2 simple pivot point at 111.91 could act as resistance. Above the pivot points, the 112.00 level could hold the pair down.
Gold Analysis: Books New Low Level
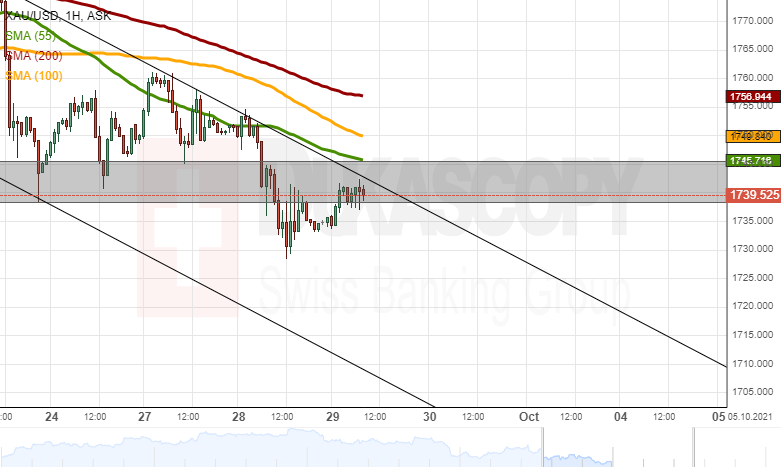
The yellow metal's price has passed below previous September low levels. On Tuesday, the pair touched a new low level by reaching the 1,730.00 mark. Afterwards, the commodity began a recovery.
On Wednesday, the rate had recovered to the 1,740.00 level. Meanwhile, Dukascopy Analytics spotted that the pair has been declining in a channel down pattern since September 23. On Wednesday morning, the yellow metal's price was testing the resistance of the mentioned channel. In addition, the 55-hour SMA had approached the rate from above and was located near 1,745.00.
If the rate bounces off the combined resistance of the upper trend line of the channel down and the 55-hour simple moving average, a test of the support of the 1,730.00 could occur. Below the 1,730.00 mark, the 1,700.00 could serve as a major support level. On the other hand, a potential passing of the resistance levels would almost immediately find resistance in the 100-hour simple moving average at 1.750.00. Above the 100-hour SMA, the 200-hour SMA at 1,757.00 might serve as resistance.
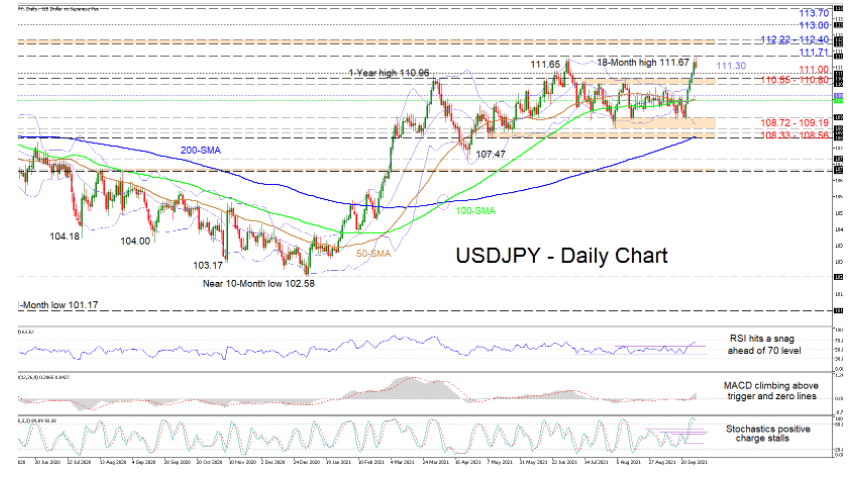
USDJPY Critical Resistance Of 111.71 Opposes Gains
USDJPY is confronting the March 2020 rally high of 111.71 for a second time in nearly three months after its recent bullish propulsion from around the 109.00 handle. The 200-day simple moving average (SMA) is defending the medium-term positive structure, while the marginal upturn in the 50- and 100-period SMAs, is indicating the recent intensity in positive price action.
The short-term oscillators are reflecting the battle buyers are encountering in pushing above the crucial 111.71 resistance boundary. Despite the MACD strengthening over its red trigger and zero lines, the RSI is struggling to extend higher into overbought territory. Moreover, above the 80 level, the positive charge in the stochastic oscillator has weakened, though the %K line has yet to confirm sellers have the upper hand.
If buyers retake the reins and manage to conquer the tough 111.71 barricade, they may jump for the 112.22-112.40 border, formed between the February 2020 and April 2019 highs respectively. Successfully breaking above this resistance belt could then boost buyers’ confidence to propel for the 113.00 handle and the vital 113.70 December 2018 high.
Otherwise, if the 111.71 obstacle stands firm and sellers drive the price beneath the upper Bollinger band at 111.30, downside limitations could commence from the 111.00 hurdle ahead of the support region of 110.55-110.80, moulded by the inside swing highs. Moving lower, the area between the mid-Bollinger band at 110.07 and the 100-day SMA at 109.87 may help the pair find its feet. Yet, if the drop in price persists, the reinforced support base of 108.72-109.19 could attempt to terminate additional deterioration in the pair. However, should the price retracement prevail beneath the 108.72 trough, the adjacent support band of 108.33-108.56 could come under attack.
Summarizing, USDJPY is exhibiting a slight weakness in upward impetus however, its neutral-to-bullish tone remains intact above the 110.55-110.80 barrier.
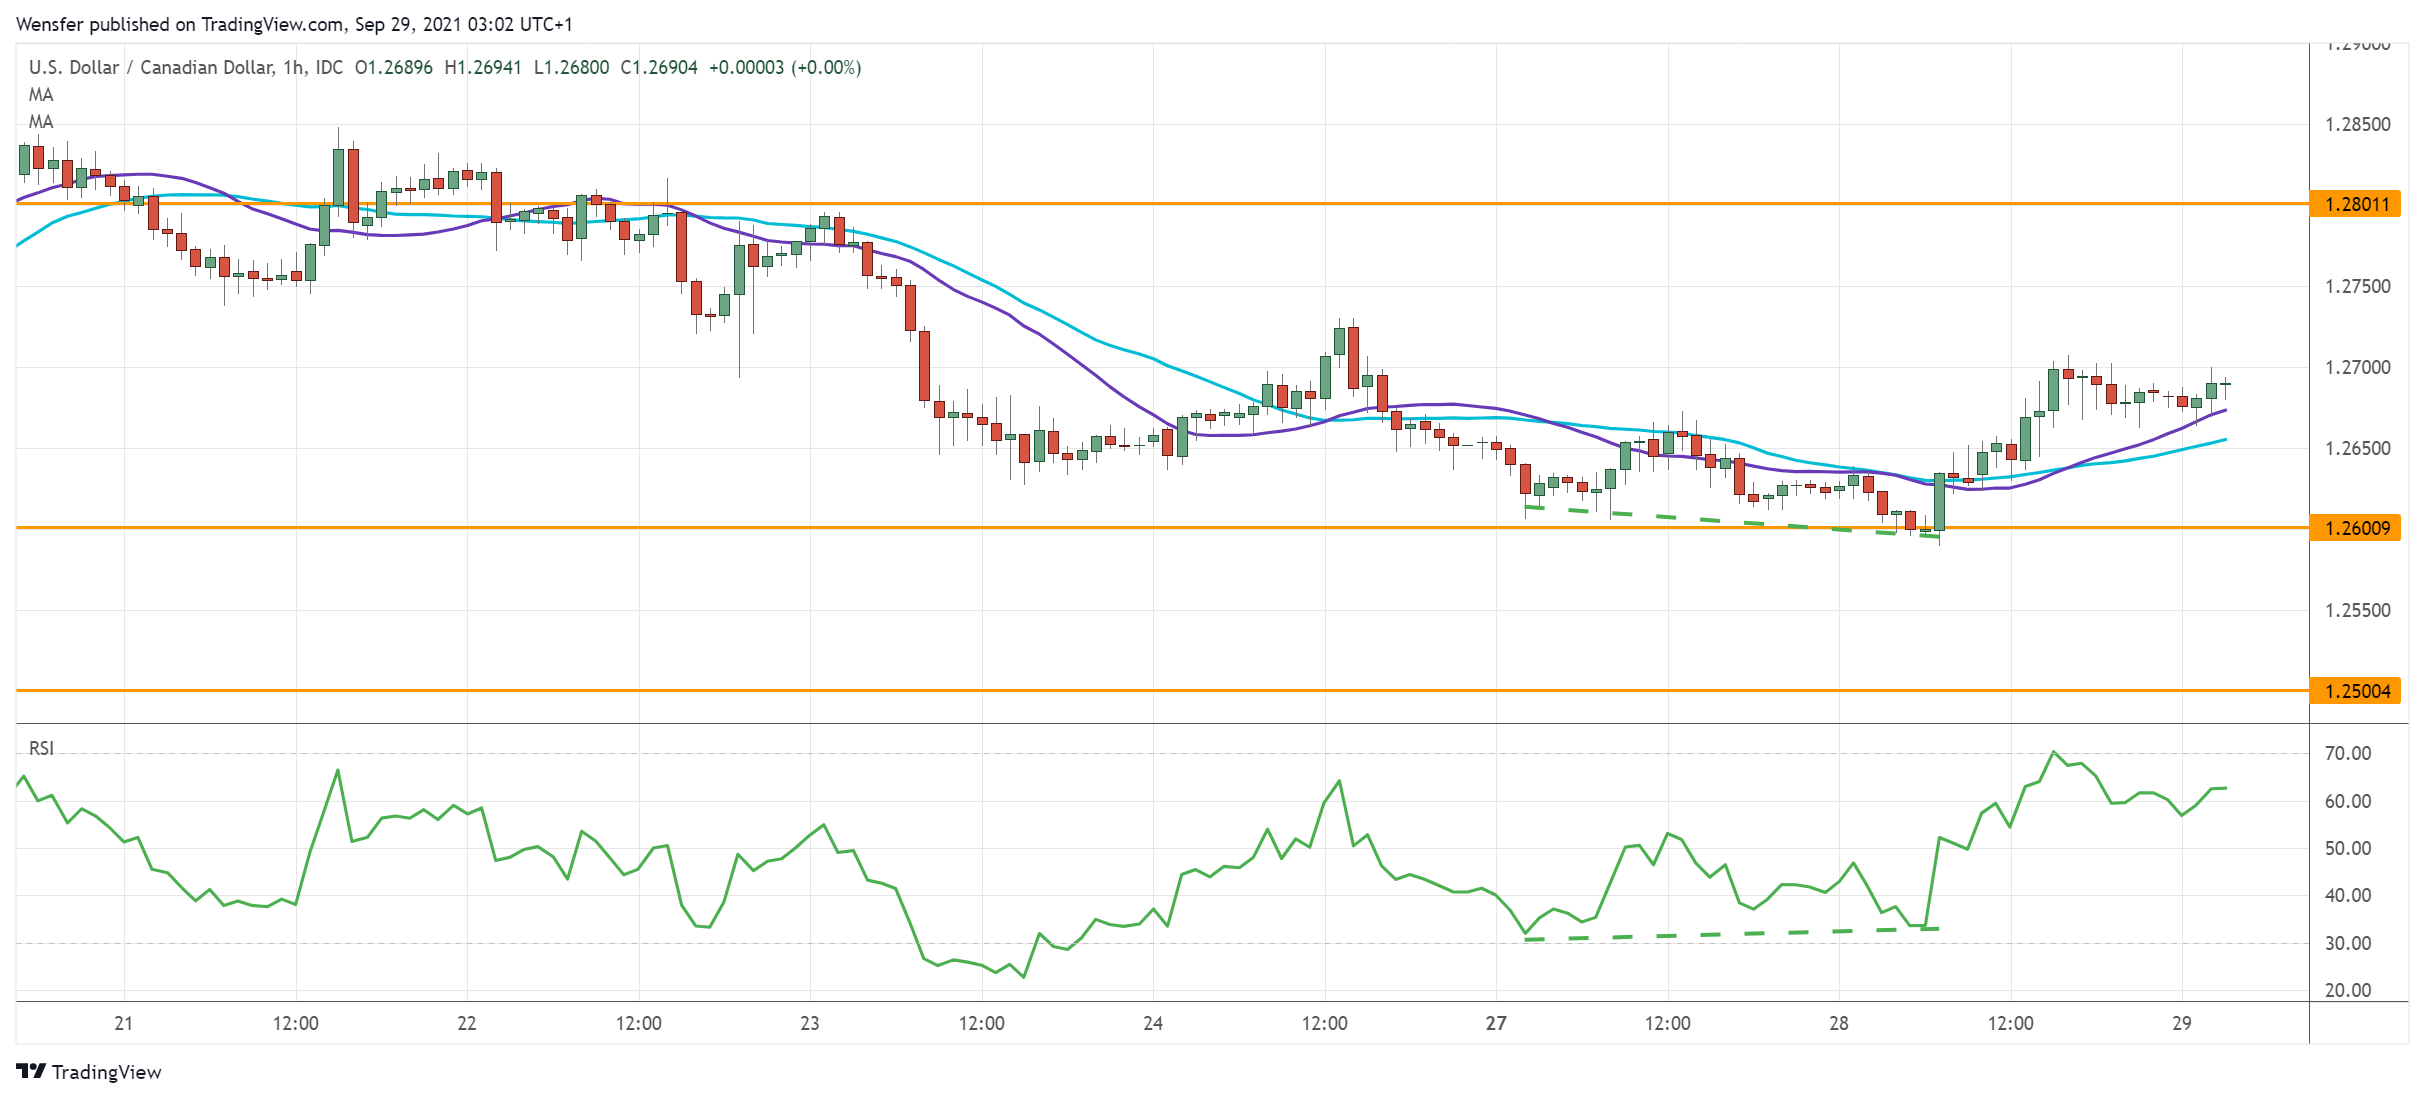
USD/CAD Bounces Off Support
The Canadian dollar is under pressure as oil prices retreat. The pair saw buying interest at 1.2600, which is major support for a four-month-long rally on the daily timeframe.
The RSI’s bullish divergence indicates that the selling pressure may have waned.
A break above the immediate resistance (1.2670) would prompt sellers to cover. 1.2800 near September’s peak could be the target should a rebound gain traction.
On the downside, a bearish breakout may send the price to the psychological level of 1.2500.
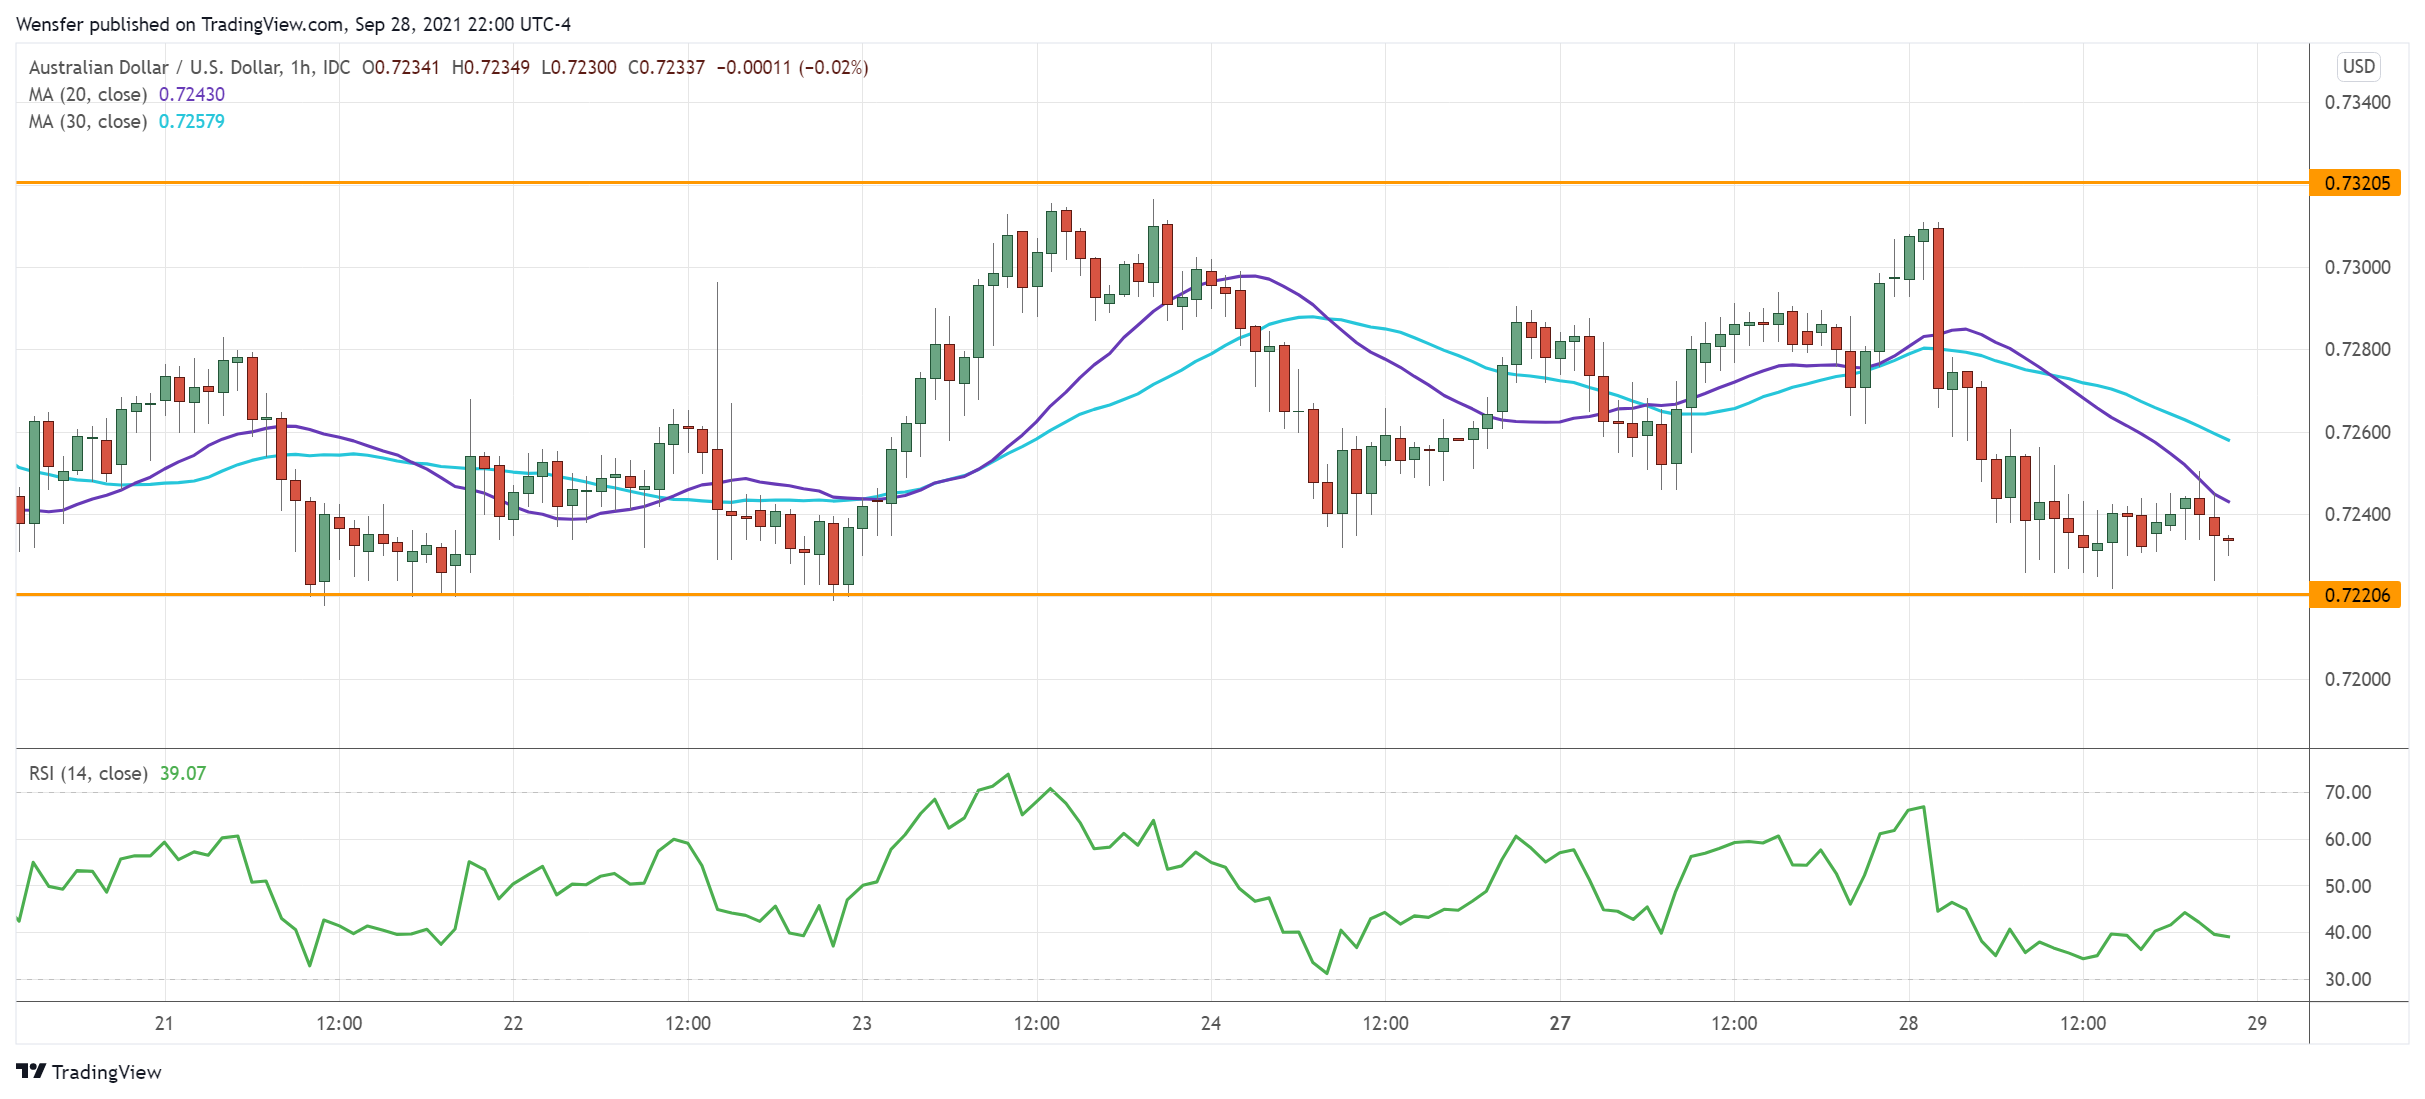
AUD/USD Hits Resistance
The Australian dollar inched higher after a smaller contraction in August’s retail sales.
The pair has found strong support at 0.7220. Three consecutive tests are an indication of solid interest in keeping the Aussie afloat.
0.7320 is the first resistance ahead. Its breach may shake the sellers out and trigger a rebound to 0.7410.
Otherwise, a fall below the said support would cause a deeper correction to the critical level of 0.7105. Erasing all of the gains from late August would seriously dent buyers’ optimism for a rally.
XAU/USD Lacks Support
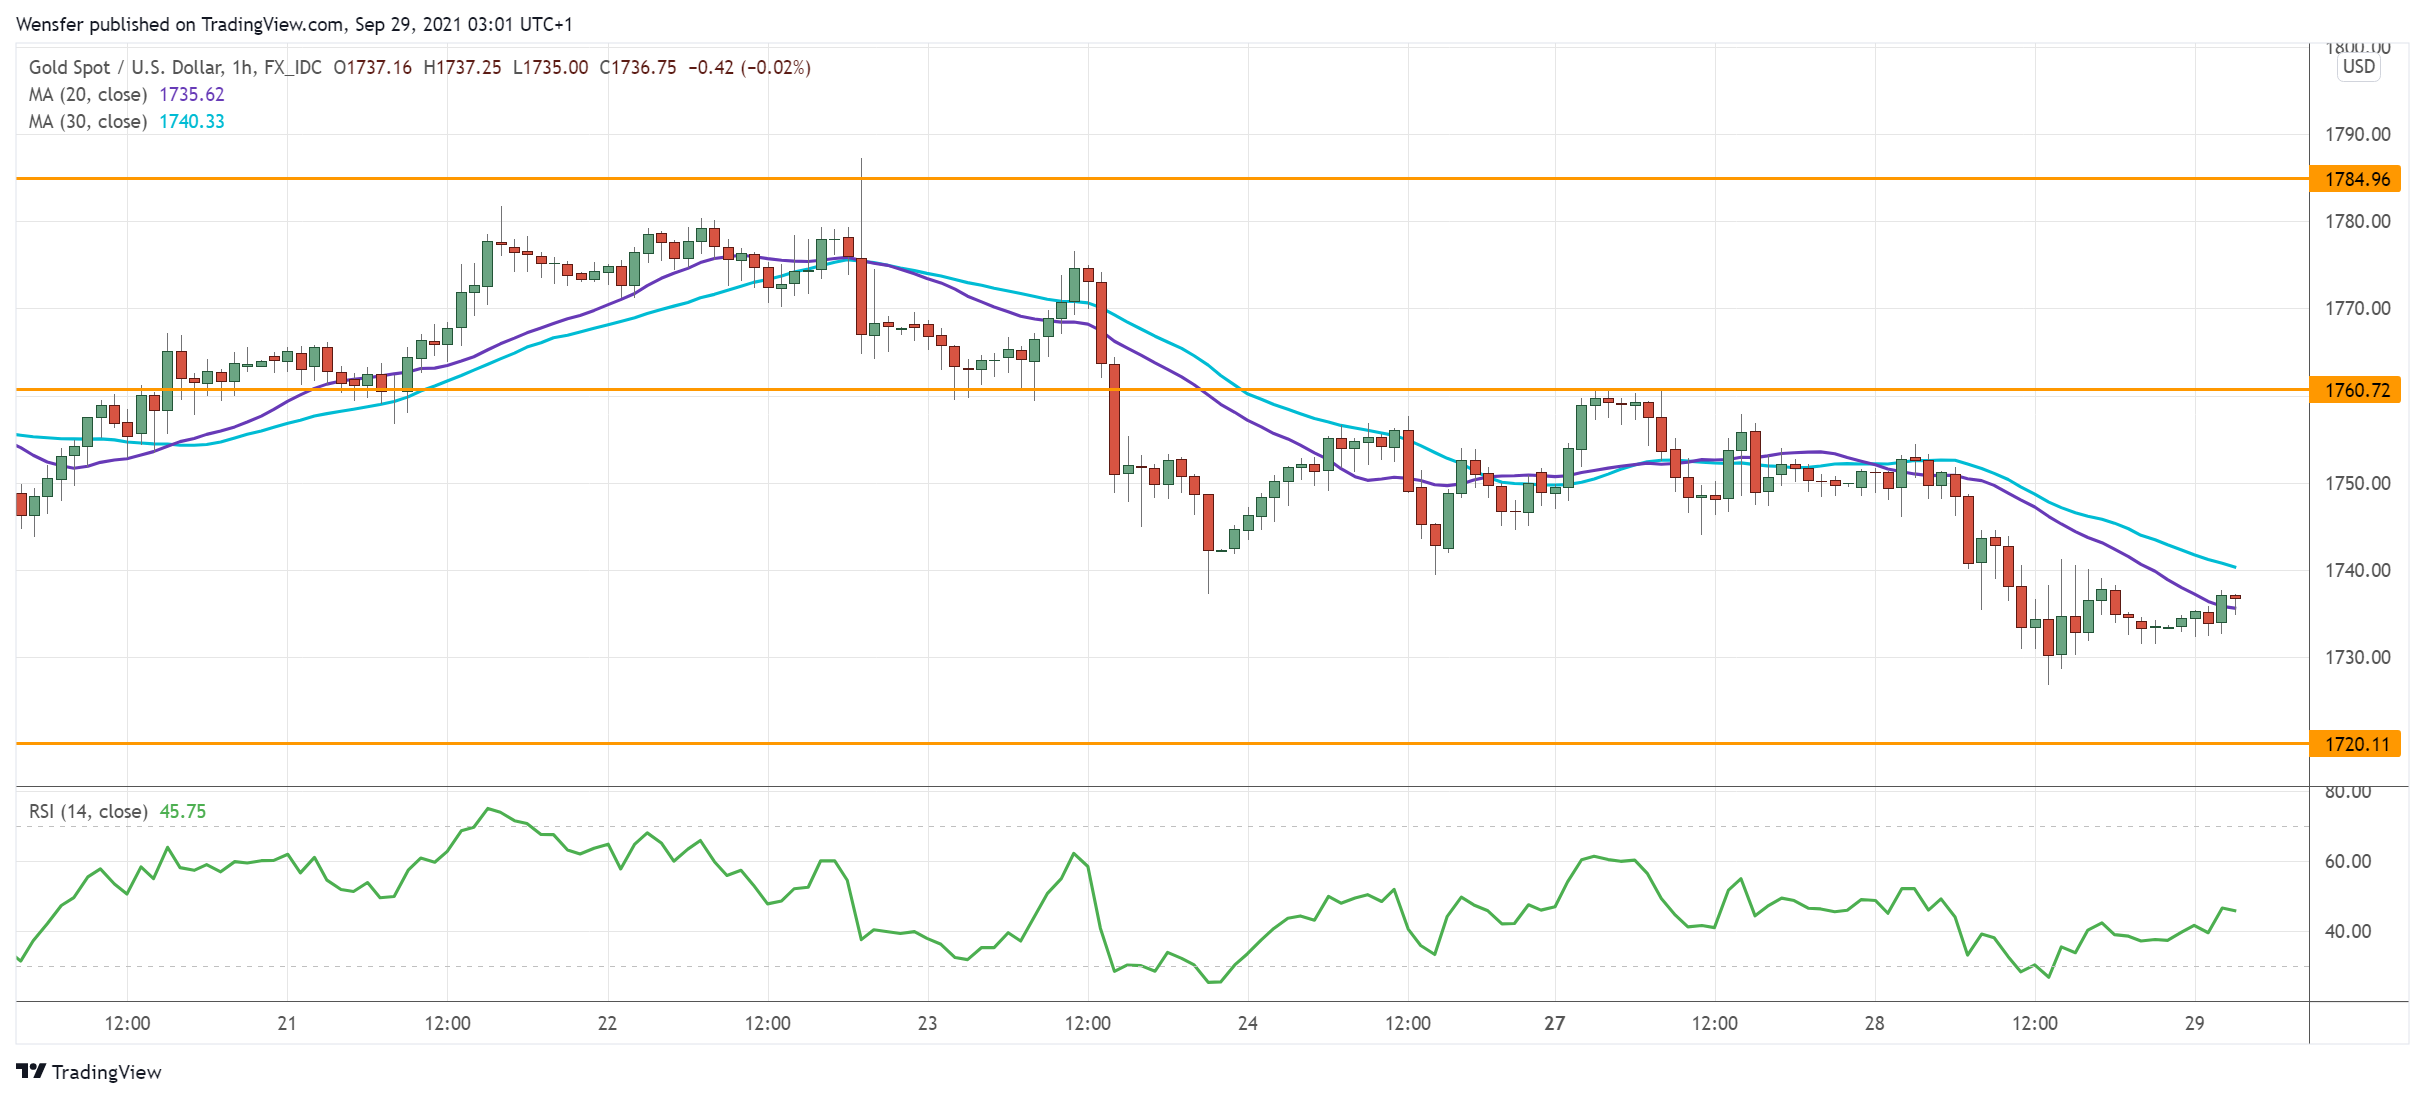
Gold slumps due to rising US Treasury yields. The demand zone around 1745 has failed to contain the market’s pessimism.
The latest bounce has been an opportunity to sell into strength, reinforcing the bearish bias. A combination of loss-cutting and fresh selling would raise the downward momentum.
The precious metal is heading towards 1720. A breakout would trigger an extended sell-off to the August low at 1680. The bulls have the daunting task of lifting 1760 before they could expect a meaningful rebound.
The Dollar Is Pushing Its Way Up
USD is squeezing its main rivals amid a reassessment of the Fed's monetary policy outlook. In addition, pressure on long-term bonds is intensifying as US lawmakers do not agree in any way on the increase in the debt ceiling, adding to market nervousness.
Historically, the transition from one phase of the monetary policy cycle to the next by the Federal Reserve becomes the main driver of the markets for a few months and only loses its force after an impressive amount of time and after a considerable revaluation. Interestingly, however, a similar turnaround on the part of other central banks goes much more mildly.
The Dollar index rose to its highest since last November, signalling a shift from a prolonged consolidation to an upward trend. At this stage, the strengthening of the Dollar looks quite tempered but going beyond the established boundaries is often accompanied by increased volatility.
We have previously noted that upward pressure in the USD could persist until the end of QE, i.e., until about the middle of next year, creating conditions for the Dollar to strengthen by about 7% from current levels into the 100 area on the DXY.
GBPUSD's 1.2% drop during Tuesday became the latest illustration that Dollar's buyers are not shy to move out of established ranges. Having started from a level near 1.3700, the active selling of the Pound stopped only near 1.3520, pushing the pair back to lows since mid-January, despite recent hawkish comments from the Bank of England.
USDJPY is up 2.4% over the last seven days, bouncing from the lower end of its trading range since June to the highs from March 2020 at 111.7. The Dollar has not traded steadily above 112 Yen since late 2018.
It is also worth paying attention to the pattern change in the stock markets. On Tuesday, the S&P500 underwent a selloff, losing more than 2% to 4375 after touching the 50-day moving average at 4450 from below. This short-term trend line has shifted from support to resistance, indicating a change in market sentiment from buying on declines to selling on rises.
The latest pattern indicates that the market is ready for a deeper correction, probably towards the 200-SMA area, which is now near 4145. Long-term investors, however, should be aware that the current market overpricing is caused by policy normalisation, not by an economic crisis. So it would hardly be sensible to prepare to see a bear market start with a fall below 3640, where the index was last November.