Sample Category Title
ECB: The Day Of Reckoning Will Come Sooner Or Later
Markets
You know something's wrong when stocks and bonds sell off in lockstep. The simple answer is fear that structurally higher inflation risks weighing on growth -" both via consumption and eventually via investments -" with central banks eventually obliged to tighten the screws on monetary policy despite the nature of the (supply-side) inflation shock. End result: stagflation. Add a little bit of nervousness on the US debt ceiling debate (US Treasury secretary Yellen warns for October 18 default deadline) and US stock markets end the day 1.6% (Dow) to 2.8% (Nasdaq) lower. Main European indices similarly lost around 2.5%. Technical pictures show more and more cracks in the ruling buy-the-dip pattern with the rest of the week serving as a real test. The US yield curve bear steepened with yields rising by 2.4 bps (2-yr) to 9.2 bps (30-yr). Details showed both real rates (Fed action expected) and inflation expectations adding to the moves. The US 10-yr yield closed above 1.53% retracement (62% retracement on March/July decline) with the US 30-yr yield breaking out of the 1.8%-2.05% trading range in place since July. A very weak US consumer confidence coincided with intraday lows on core bonds markets. The US Treasury ended its end-of-month refinancing operation with a disappointing $62bn 7-yr Note sale. The auction bid cover was near recent average, but the auction stopped almost a full bp above the 1:00 PM bid side. German yields added 0.1 bp (2-yr) to 2.3 bps (10-yr) in a daily perspective. The rise in European yields remains solely contributable to higher inflation expectations with several market gauges approaching 2% for the first time in many years. The ECB for its part keeps denying the inconvenient truth, but the day of reckoning will come sooner or later. ECB hot shots de Guindos and Lane are scheduled to speak at the ECB forum today and serve as a wildcard for trading. After European close, the forum features a panel discussion with G4 central bank chairman. Overall, the same trading dynamics as earlier this week will remain at play. Asian bourses don't escape the gauntlet this morning. Eco data are confined to EC economic confidence data.
The dollar's performance against the euro was telling. EUR/USD closed at 1.1683 from an 1.1695 open without really testing the YTD low at EUR/USD 1.1664 despite very fertile USD trading conditions ((real) rate divergence, risk aversion). The jury is still out, but it tentatively supports our case that sufficient USD positive news is discounted with investors knowing that the euro's moment of clarity will come once the ECB embraces the global normalization swing. The real rate argument primed in USD/JPY which tested the post-Covid high at 111.66. Sterling suffered the same fate as the less liquid, smaller, currencies with EUR/GBP (0.8631) closing at the highest level since mid-July.
News headlines
According to a draft budget, the Polish government aims to reduce the 2022 budget deficit to 2.9% of GDP as solid economic growth and improved tax collection are expected to improve public finances. The budget forecasts assume economic growth of 4.6% in 2022 compared to 4.9% expected this year. The public debt, as measured according to the EU general government debt methodology, is expected at 56.6% of GDP in 2022 and is seen decreasing further 52.9% by end 2025. Yesterday, rating agency Standard and Poor's slightly downwardly revised its forecast for Polish Growth next year from 5.4% to 5.3%. According to S&P private consumption supported by a strong labour market and loose fiscal policy will continue to support economic growth. On the FX markets, the Polish zloty yesterday was an important victim of the higher core yields and the risk-off sentiment. EUR/PLN jumped from sfrating agency Standard and Poor's slightly downwardly revised its forecast for Polish Growth next year from 5.4% to 5.3% 4.ub 4.60 to the 4.63 area.
US September consumer confidence (conference Board) as published yesterday declined to the lowest level since February (109.3 from 115.2). The decline was both due the assessment of current conditions (143.4 from 148.9) and the expectations component (86.6 from 92.8). Consensus estimates were for a near stabilization. The decline was rather broad-based across different subcategory measures by the survey. Amongst others, also the labour market balance (jobs Plentiful-jobs hard to get) eased from 44.4 to 42.5.
GBP/JPY Daily Outlook
Daily Pivots: (S1) 150.15; (P) 151.36; (R1) 152.17; More...
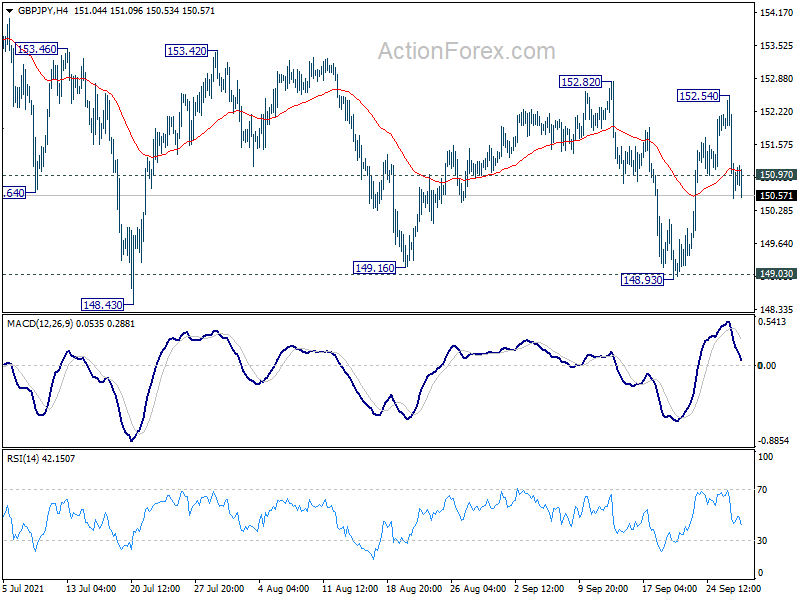
GBP/JPY's break of 150.97 minor support argues that rebound from 148.93 might have completed. Intraday bias is back on the downside for 149.03 key support again. Firm break there will carry larger bearish implications. On the upside, firm break of 152.82 will suggest that correction from 156.05 has completed, and turn near term outlook bullish for retesting this high.
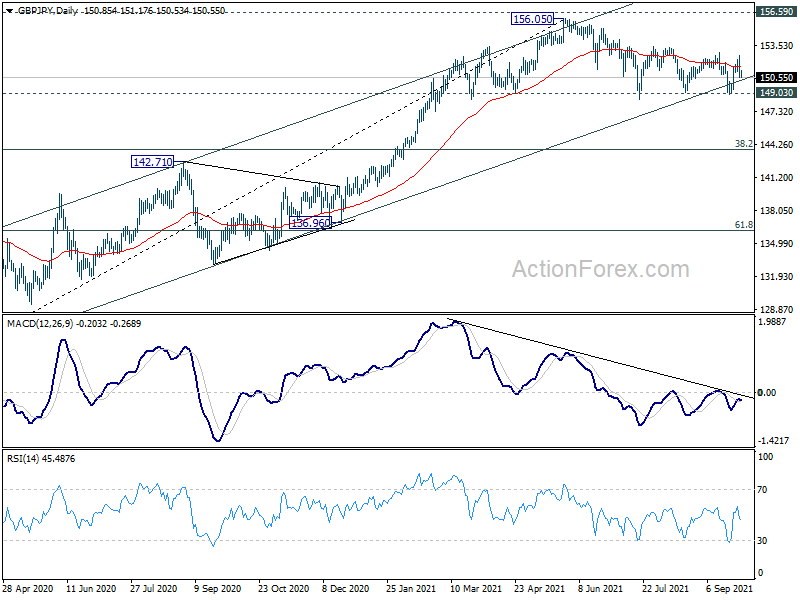
In the bigger picture, rise from 123.94 is seen as the third leg of the pattern from 122.75 (2016 low). As long as 149.03 support holds, such rise would still resume at a later stage. However, sustained break of 149.03 support will indicate rejection by 156.59. Fall from 156.05 would be at least correcting the whole rise from 123.94. Deeper fall would be seen back 38.2% retracement of 123.94 to 156.05 at 143.78 first.
EUR/JPY Day Outlook
Daily Pivots: (S1) 129.85; (P) 130.11; (R1) 130.56; More....
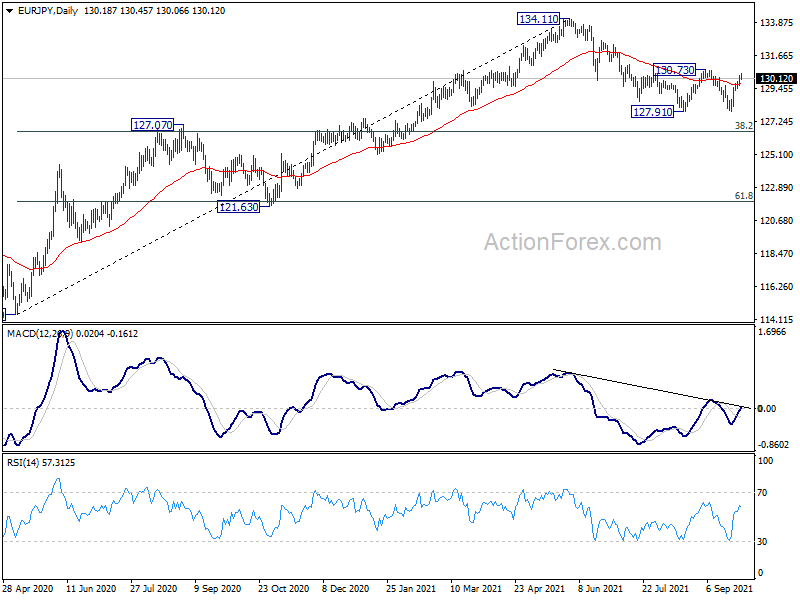
Intraday bias in EUR/JPY remains on the upside for 130.73 resistance. Firm break there will argue that correction from 134.11 has completed and turn near term outlook bullish for retesting this high. On the downside, break of 129.36 minor support will turn bias back to the downside for retesting 127.91 instead.
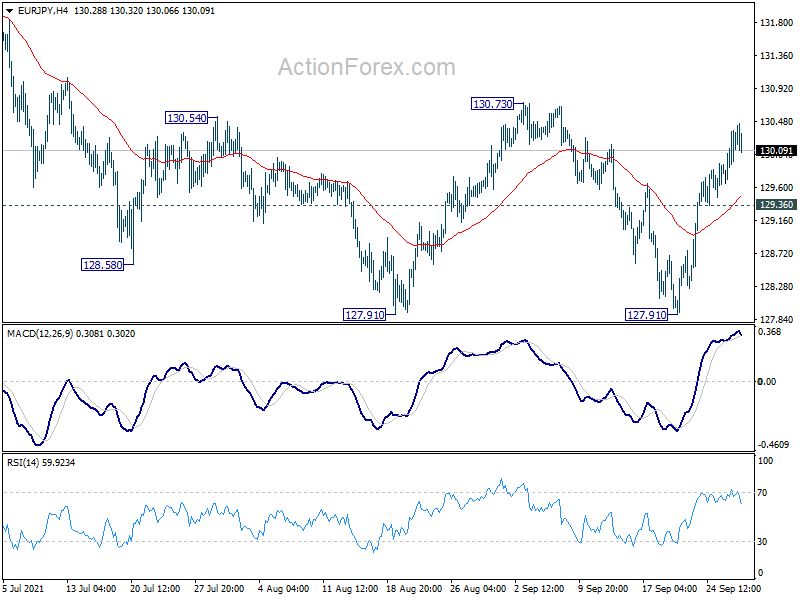
In the bigger picture, rise from 114.42 is seen as a medium term rising leg inside a long term sideway pattern. As long as 127.07 resistance turned support holds, further rise is still expected to retest 137.49 (2018 high). However, firm break of 127.07 will argue that the medium term trend has reversed, deeper fall would be seen to 61.8% retracement of 114.42 to 134.11 at 121.94.
EUR/GBP Daily Outlook
Daily Pivots: (S1) 0.8557; (P) 0.8599; (R1) 0.8672; More...
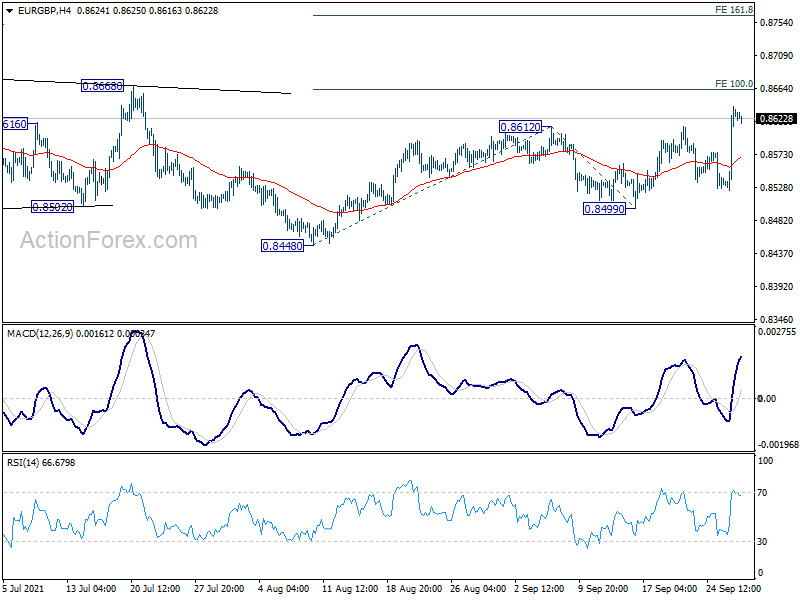
EUR/GBP's rebound from 0.8448 resumed by breaking 0.8612 resistance. Intraday bias is back on the upside for 0.8668 key structural resistance next. Sustained break there will be a strong sign of larger bullish reversal. Next target will be 161.8% projection of 0.8448 to 0.8612 from 0.8499 at 0.8764.
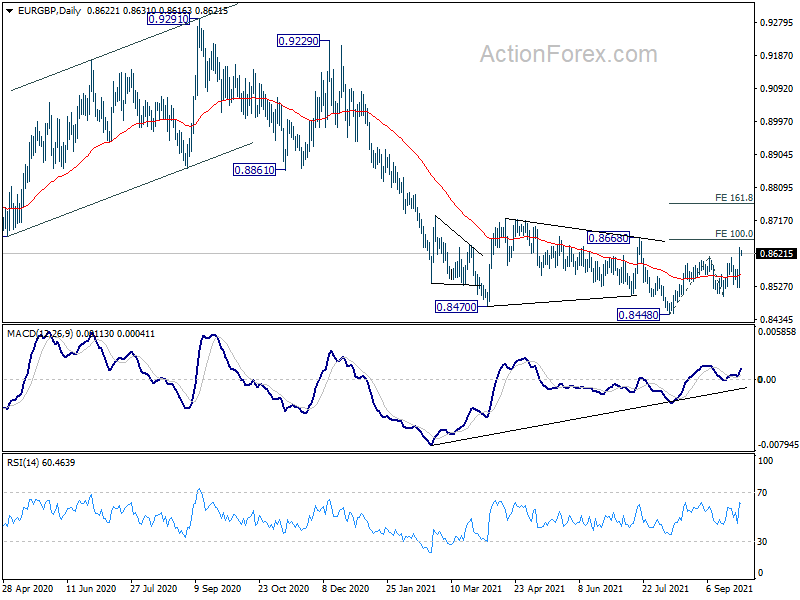
In the bigger picture, price actions from 0.9499 (2020 high) are still seen as developing into a corrective pattern. Deeper fall could be seen as long as 0.8668 resistance holds, towards long term support at 0.8276. However, firm break of 0.8668 resistance would argue that a medium term bottom was already formed. Stronger rise would be seen to 0.8861 support turned resistance to confirm completion of the corrective pattern.
EUR/AUD Daily Outlook
Daily Pivots: (S1) 1.6036; (P) 1.6100; (R1) 1.6197; More...
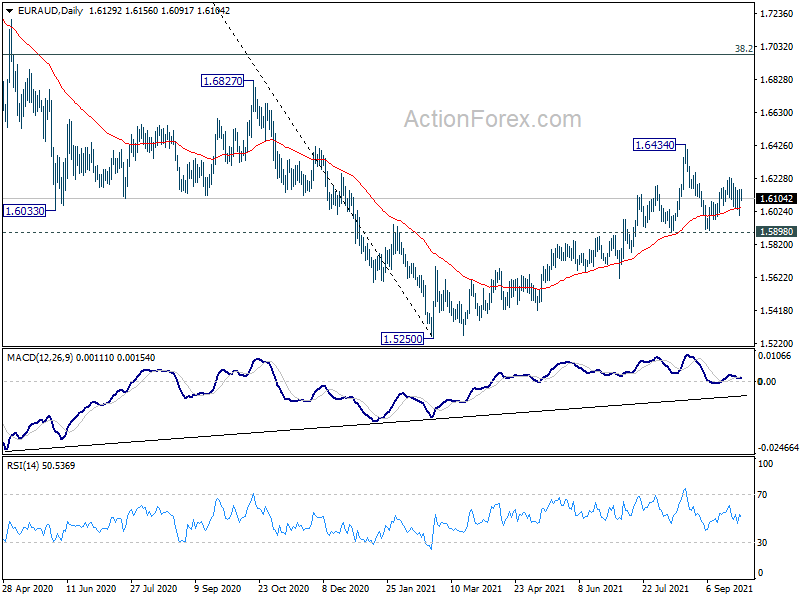
Intraday bias in EUR/AUD is turned neutral for the current recovery. On the upside, above 1.6232 will resume the rebound to retest 1.6434 high. Overall, rise form 1.5250 is still in favor to continue as long as 1.5898 support holds. However, sustained break of 1.5898 will argue that whole rise from 1.5250 has completed, and turn near term outlook bearish.
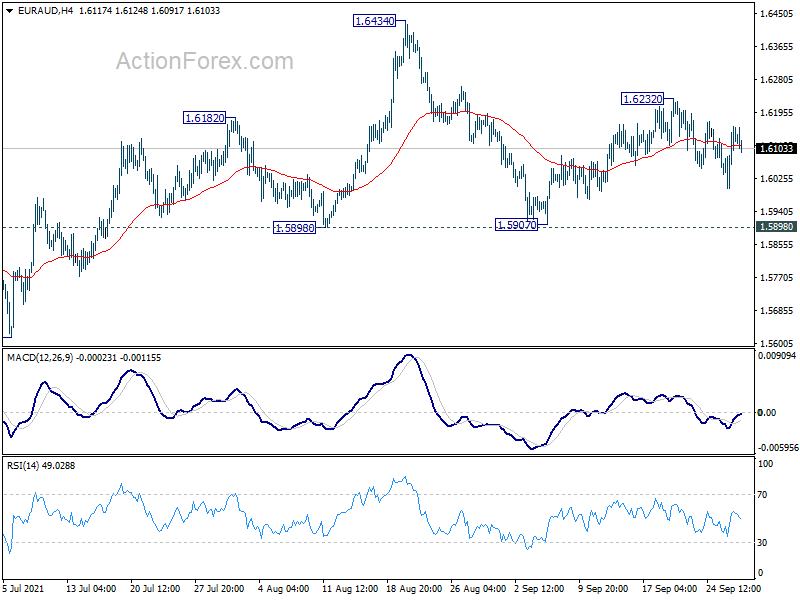
In the bigger picture, rise from 1.5250 medium term bottom is currently seen as a correction to the down trend from 1.9799 first. Stronger rise could be seen to 38.2% retracement of 1.9799 to 1.5250 at 1.6988 next. We'd tentatively expect strong resistance from there to limit upside, at least on first attempt. Meanwhile, break of 1.5898 support will indicate that the rebound has completed. Larger down trend from 1.9799 might be ready to resume through 1.5250 low.
EUR/CHF Daily Outlook
Daily Pivots: (S1) 1.0836; (P) 1.0848; (R1) 1.0870; More....
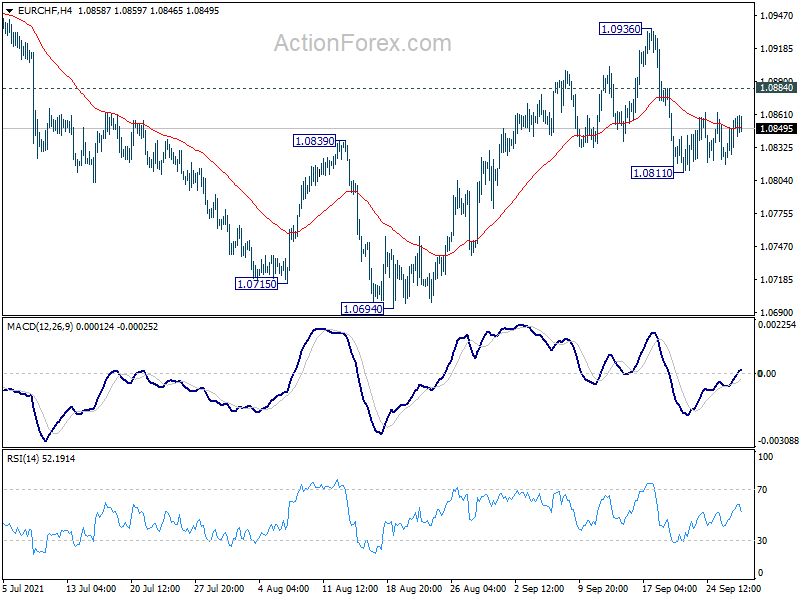
EUR/CHF is staying in consolidation from 1.0811 low and intraday bias remains neutral first. As noted before, rebound from 1.0694 has possibly completed at 1.0936 already. Break of 1.0811 will turn bias to the downside and resume the fall for retesting 1.0694 low. On the upside, however, above 1.0884 minor resistance will turn bias back to the upside for 1.0936 resistance again.
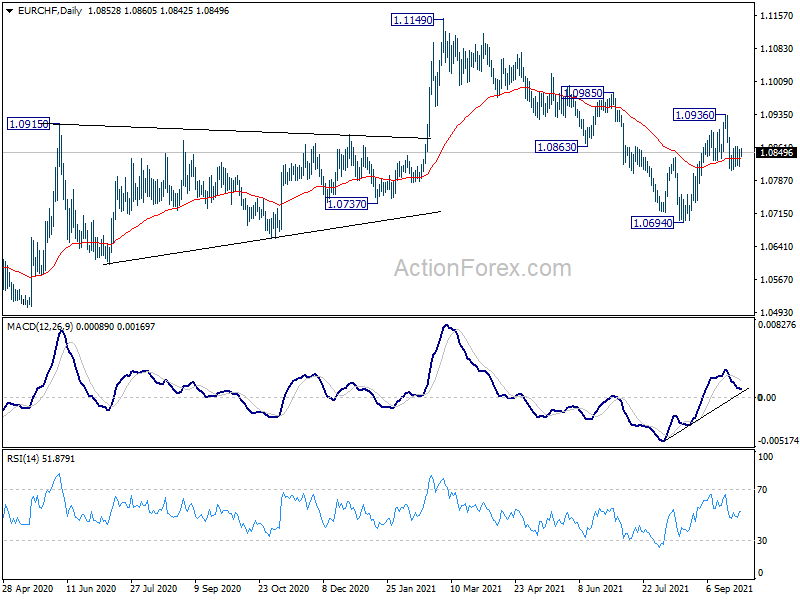
In the bigger picture, the stronger than expected rebound from 1.0694 and break of 55 week EMA (now at 1.0861) mixes up the medium term outlook. On the upside, break of 1.1149 will resume the whole rise from 1.0505 (2020 low). On the downside, break of 1.0694 will revive some medium term bearishness for 1.0505 and below.
Daily Technical Analysis
EUR/USD
Current level - 1.1688
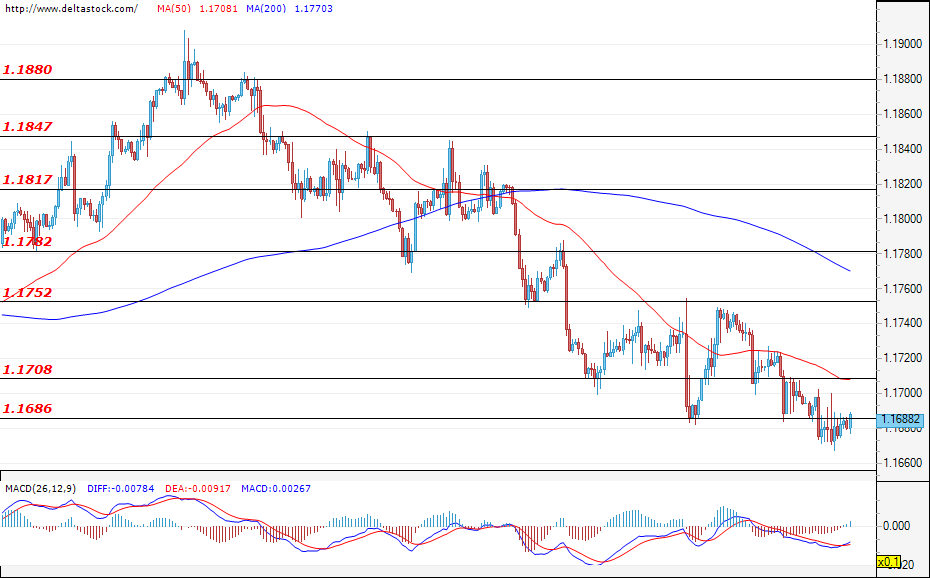
The situation with the currency pair is remaining unchanged since the previous trading session and, at the time of writing the analysis, we are seeing the euro consolidate against the dollar around the support level at 1.1686. The bulls are currently managing to limit the sell-off down to the mentioned support, but in case of a bearish dominance, we can expect a shift towards the next significant support area at 1.1600. Today, investors' attention will be focused on the statement of the FED chair Jerome Powell (15:45 GMT).
| Resistance | Support | ||
| intraday | intraweek | intraday | intraweek |
| 1.1708 | 1.1782 | 1.1686 | 1.1600 |
| 1.1752 | 1.1817 | 1.1600 | 1.1450 |
USD/JPY
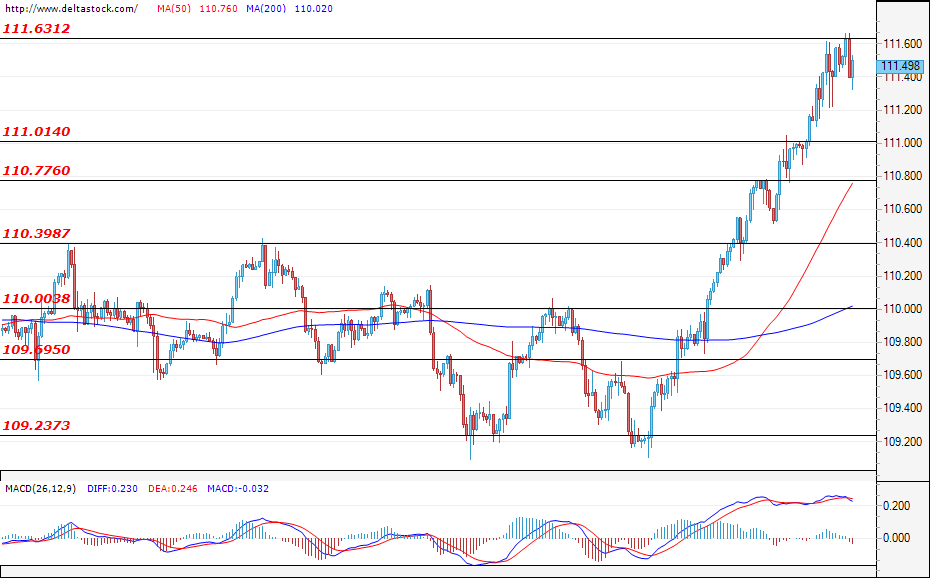
Current level - 111.45
The situation with the currency pair is remaining unchanged since the previous trading session and, at the time of writing the analysis, we are seeing the euro consolidate against the dollar around the support level at 1.1686. The bulls are currently managing to limit the sell-off down to the mentioned support, but in case of a bearish dominance, we can expect a shift towards the next significant support area at 1.1600. Today, investors' attention will be focused on the statement of the FED chair Jerome Powell (15:45 GMT).
| Resistance | Support | ||
| intraday | intraweek | intraday | intraweek |
| 111.60 | 112.15 | 111.01 | 110.40 |
| 112.15 | 113.50 | 110.77 | 110.00 |
GBP/USD
Current level - 1.3543
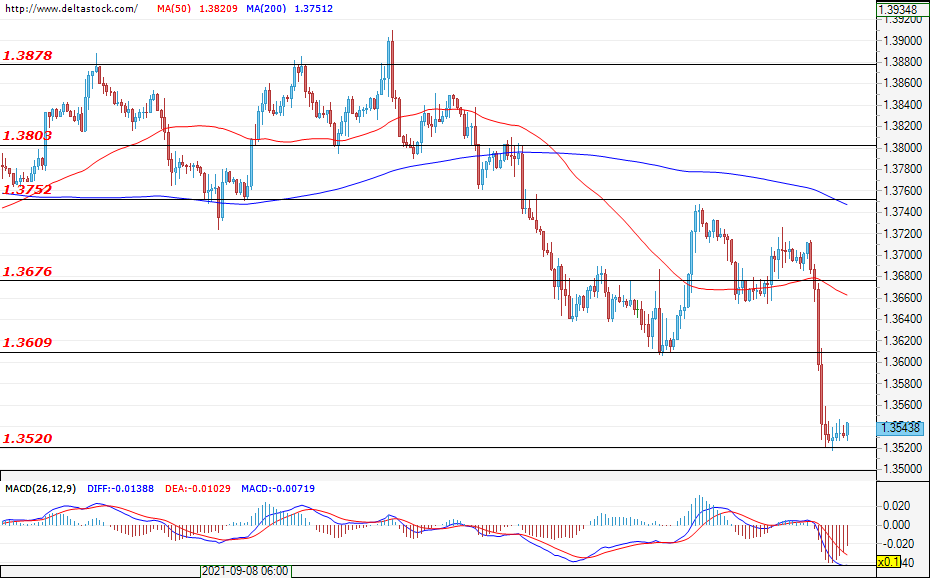
The pound lost roughly a figure and a half of its value against the U.S. dollar during the last trading session. At the time of writing, we are seeing a consolidation in the support area at 1.3520. For the time being, the bulls manage to withstand the pressure coming from the bears, but a possible seller predominance and a successful breach of the mentioned support would lay the foundations for a deepening of the sell-off towards the next significant support at 1.3445.
| Resistance | Support | ||
| intraday | intraweek | intraday | intraweek |
| 1.3609 | 1.3752 | 1.3520 | 1.3400 |
| 1.3676 | 1.3803 | 1.3445 | 1.3250 |
XAUUSD Is Possibly Bullish
Technical analysis
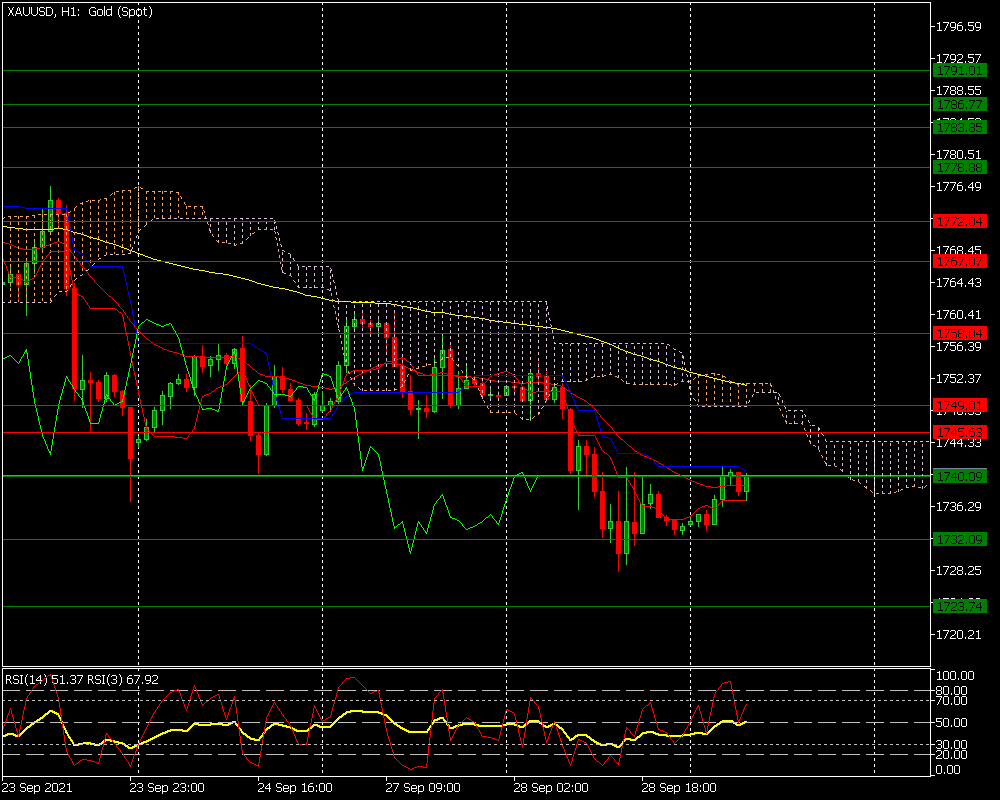
The RSI(14), the RSI(3) and the CCI point to a possible upwards movement
The Ichimoku indicator displays a possible switch to a bullish sentiment.
Most likely scenario - BUY
Target prices: 1,745 1,749
Alternative scenario - SELL
Target prices: 1,732 1,723
Key levels
Support 1,745 1,749
Resistance 1,732 1,723
GBPUSD Slips As US Bond Yields Converge With UK Oil Shortage
US equities slipped on Tuesday as Treasuries jumped to the highest level in more than three months. The Dow Jones index declined by more than 600 points while the S&P 500 and Nasdaq 100 index fell by more than 90 and 400 points, respectively. The technology sector was among the worst-performing in Wall Street as fears of a more hawkish Federal Reserve rose. The yield of the 10-year Treasury bonds rose to 1.53% while the 30-year rose to 2.07%. While investors believe that the economy is doing well, there are concerns about how this growth will continue when the Fed starts tapering its asset purchases.
The US dollar index rose to the highest level in months as investors rushed to its safety as global risks rise. In the US, there is a risk that the country will run out of money if Congress won’t raise the debt ceiling. In testimony in Congress, Janet Yellen said that the government will run out of funds by October 16. Also, there is the ongoing risk of energy prices. China, the second-biggest economy in the world, is facing a major electricity shortage. Similarly, in the UK, many petrol stations have shut down because of the shortage of truck drivers. There is also the ongoing risk of Evergrande, the second-biggest real estate company in China.
The economic calendar will have some key events today. Later, the US will publish the latest pending home sales numbers. The data is expected to show that pending home sales increased by 1.8% in August after falling by 1.4% in the previous month. On Tuesday, S&P CoreLogic Case-Shiller National Home Price Index rose 19.7% in the first seven months of the year. That was the highest level on record. Other key numbers scheduled for today are the EIA inventory data, Canada’s retail and industrial price index, UK mortgage data, and Eurozone’s consumer and business confidence data.
EURUSD
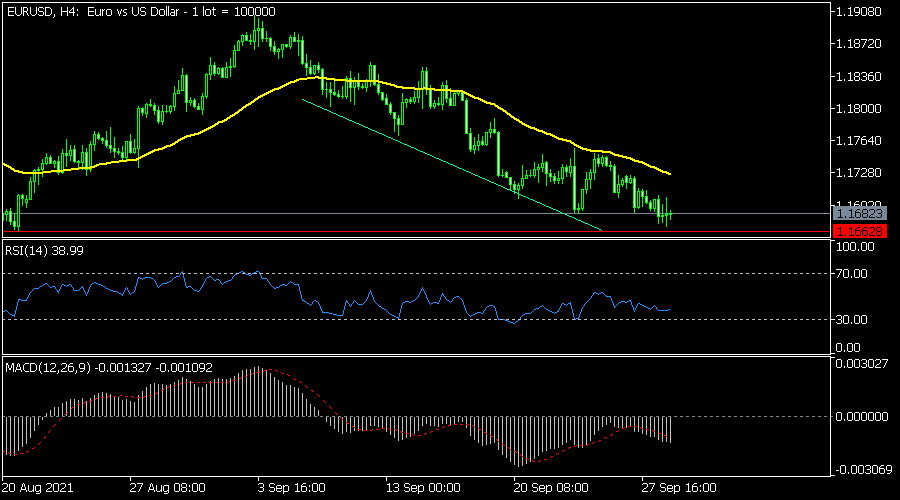
The EURUSD has been in a strong bearish trend in the past few weeks. The pair has managed to move from a high of 1.1905 to a low of 1.1670. On the four-hour chart, the pair has also formed a descending channel and moved below the 25-day and 15-day moving averages. The MACD has remained below the neutral level while the RSI is at 40. The pair is also approaching the key support level at 1.1662. Therefore, there is a likelihood that the pair will maintain a bearish trend as bears target the next support at 1.1600.
NDX100
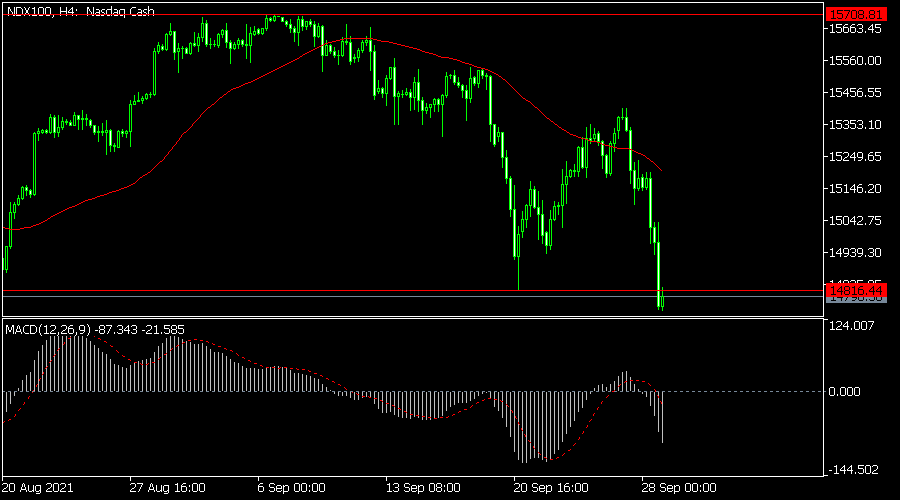
The Nasdaq 100 index tumbled sharply as the sell-off of technology stocks continued. The index declined to a low of $14,470, which was a few points below last week’s low of $14,815. On the four-hour chart, the index has dropped below the short and long term moving averages. It has also moved below the lower side of the bearish flag pattern while the MACD has declined to the lowest level since September 20. Therefore, the index will likely keep falling with the next key support being at $14,500.
GBPUSD
The GBPUSD crashed hard as the energy crisis in the UK coincided with a jump in US Treasuries. The pair fell to a low of 1.3520, which was the lowest level in more than 7 months. It declined below the key support level at 1.3600 while the Relative Strength Index (RSI) moved to the oversold level. The MACD has also moved below the neutral level. Therefore, the pair will likely keep falling in the near term.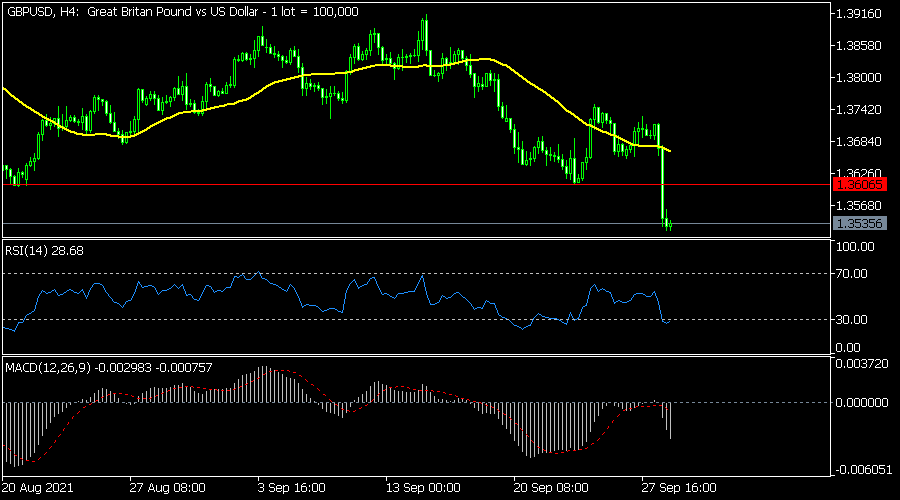
USD/CAD Daily Outlook
Daily Pivots: (S1) 1.2614; (P) 1.2661; (R1) 1.2727; More...
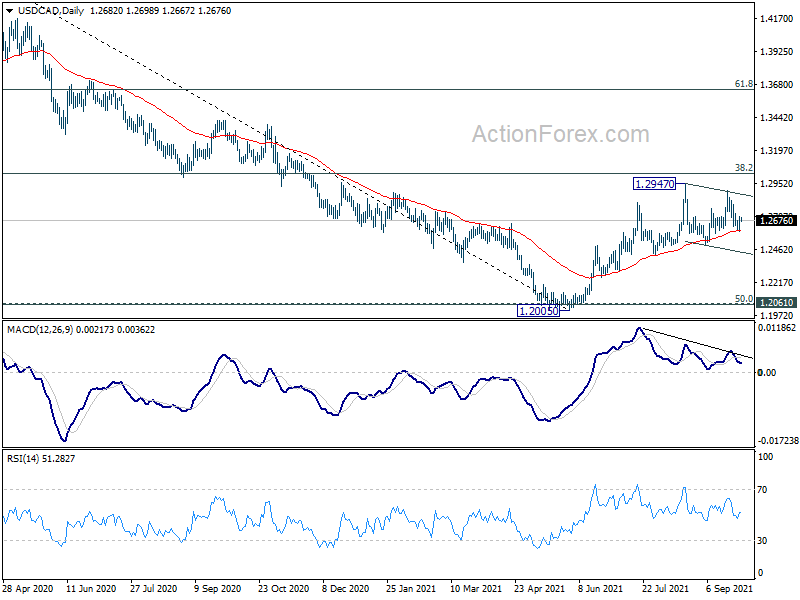
Intraday bias in USD/CAD is turned neutral with current recovery. On the downside, break of 1.2592 will resume the fall from 1.2891, as the third leg of the pattern from 1.2947, to 1.2492 support and possibly below. On the upside, above 1.2729 minor resistance will turn bias back to the upside for 1.2891/2947 resistance zone instead. Overall, with 1.2421 support intact, rise from 1.2005 should still be in progress for another rally through 1.2947 at a later stage.
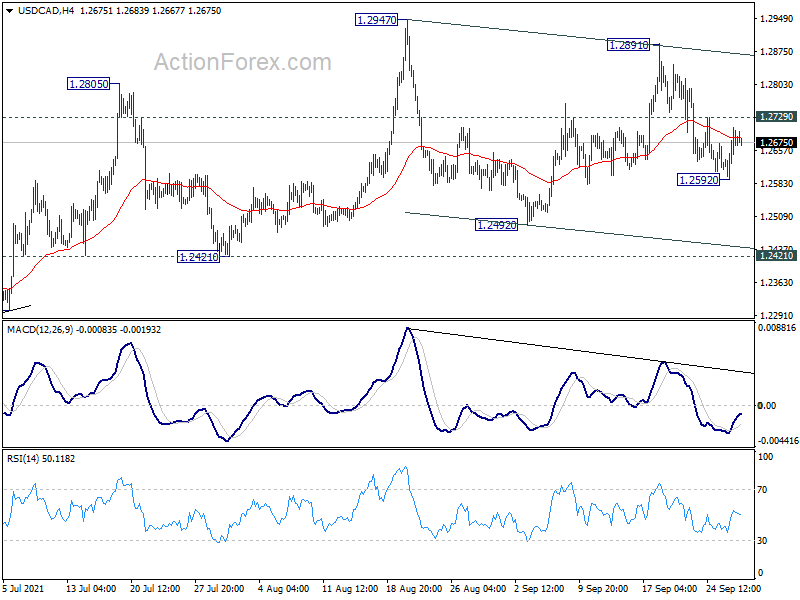
In the bigger picture, fall from 1.4667 is seen as the third leg of the corrective pattern from 1.4689 (2016 high). It should have completed after hitting 1.2061 (2017 low) and 50% retracement of 0.9406 to 1.4689 at 1.2048. Sustained break of 38.2% retracement of 1.4667 to 1.2005 at 1.3022 will pave the way to 61.8% retracement at 1.3650 and above. Overall, medium term outlook remains neutral at worst with 1.2048/61 support zone intact.