Sample Category Title
Hong Kong HSI takes another beating as selloff in property stocks spreads
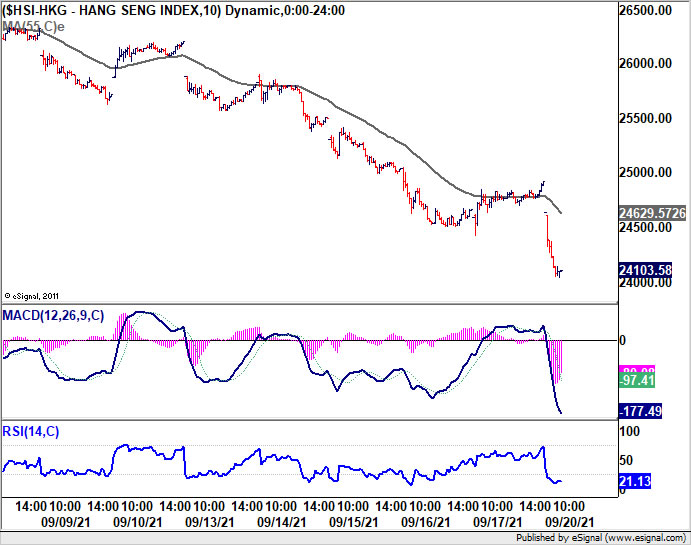
Asian markets are trading in risk-off mode, as Hong Kong stocks are taking another beating while Japan and China are on holiday. Selloff in shares of the troubled Chinese giant Evergrande Group is spreading to other property stocks. The group has just announced over the weekend to start repaying its wealth management products with real estates.
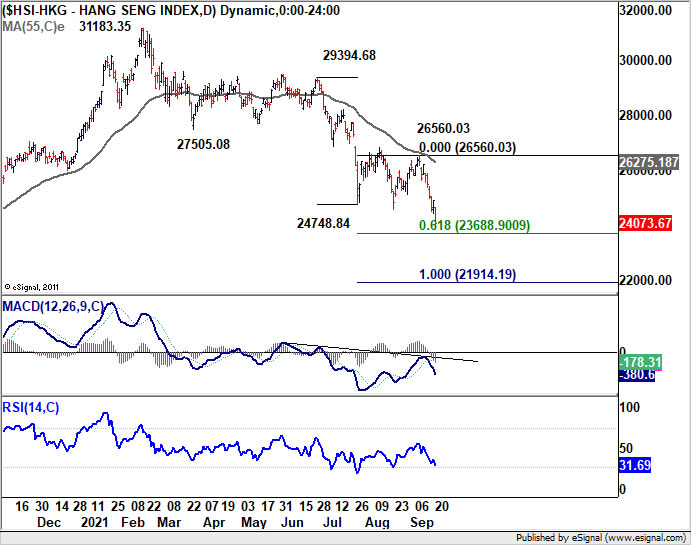
At the time of writing, Hong Kong HSI is down more than -3.4% or -850 pts. As for the near term, 61.8% projection of 29394.68 to 24748.84 from 26560.03 at 23688.90 would be an important level to defend this week. Some support could be seen there to bring at least some consolidations first. However, any further downside acceleration could easy push HSI through the level to 100% projection at 21914.19. That's a possible scenario considering the FOMC event risk this week.
Eco Data 9/20/21
[php_everywhere instance="1"]
FOMC Preview: Fed to Affirm Tapering Could Come This Year. Focus Turns to Dot Plot
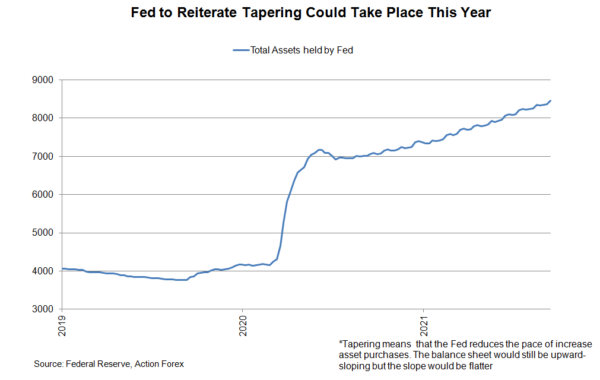
Since the Jackson Hole symposium and the FOMC minutes, the pandemic has worsened in the US, while economic growth appears to be losing steam. These suggest that all monetary policy measures will stay unchanged with asset purchases staying at US$120B per month and the Fed funds rate target at 0-0.25%. We don't expect any breakthrough news about QE tapering. The Fed would likely reiterate that it could happen some time this year, without making formal announcement. The updates on the median dot plot will draw close attention. This whole picture could be different with only one or two members change views. The Fed’s staff will also release the latest economic projections at the meeting.
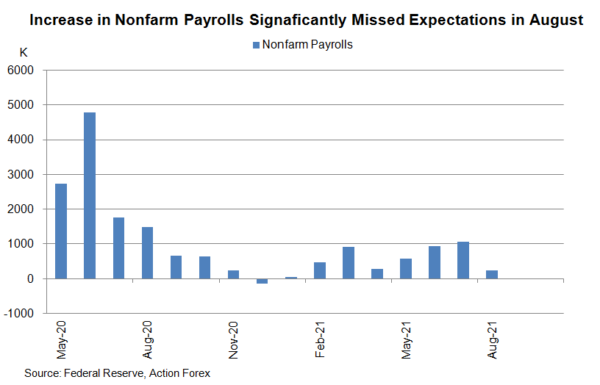
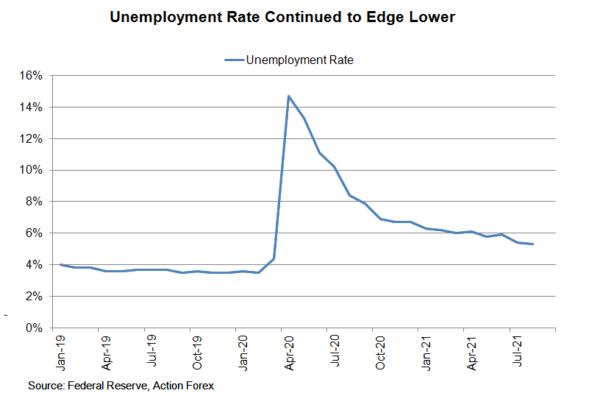
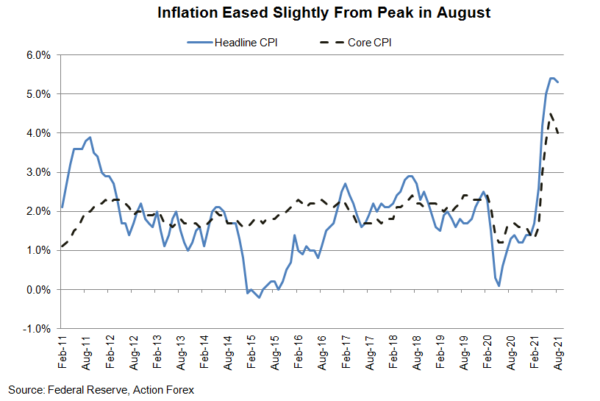
Economic recovery has shown signs of moderation. Nonfarm payrolls increased +235K in August, much weaker than consensus of +750K and +1053K in July. The unemployment rate slipped -0.2 ppt to 5.2%, in line with expectations. On inflation, headline CPI eased to +5.3% y/y in August, from +5.4% a month ago. However, it remains more than double of the Fed’s target. Core CPI, which excludes food and energy prices, slowed to +4% y/y in August, from July’s +4.3%. On a positive note, household spending remains firm. Retail sales surprised to the upside, gaining +0.7% m/m in August, after a -1.8% drop in July. This was probably helped by wage increase. Average hourly earnings expanded +4.3% y/y from +4.1% in July. This exceeded consensus of a +4% gain. Against this backdrop, the Fed’s staff could slightly revise lower GDP growth forecast for this year. The projection of inflation should, however, be upgraded.
 There is no urgency for the Fed to rush into making a formal announcement of QE tapering this month. Yet, Fed Chair Jerome Powell should reiterate the stance that “substantial further progress” has been “met for inflation”, and “there has also been clear progress toward maximum employment”. He would likely reiterate that “if the economy evolved broadly as anticipated, it could be appropriate to start reducing the pace of asset purchases this year”.
The median dot plot would be an important highlight of the meeting. Back in June, the median dot plots projected two rate hikes by 2023. Even in 2022, there were 7 out of 18 participants anticipating one or two hikes in 2022, up from only four in March. Things can turn more hawkish if one or two more members bring their forecast forward to 2022. Meanwhile, the median projection could shift to three hikes if just two members lift their target from 0.50% to 0.75%.
Forex and Cryptocurrency Forecast
EUR/USD: Awaiting US Fed Decision
The dollar continues to strengthen, and the EUR/USD pair moves south. Starting on Monday September 13 at 1.1810, it ends the five-day run at 1.1730. The movement is certainly not very strong, only 80 points. But it must be taken into account that it was 1.1908 two weeks ago, on September 03.
US retail sales statistics were much better than expected. Sales showed a 0.7% increase in August, although according to the forecast, should have decreased by 0.8%. The number of repeat applications for unemployment benefits, which was supposed to decrease by 72K, fell by 187K.
Such strong statistics raised the likelihood that the Fed will announce the curtailment of $ 120 billion of the quantitative easing (QE) program to 55% at its next meeting on September 21-22.
As a result of the dollar emission, carried out by the FRS for the last year and a half, the US national debt has grown to 130% of GDP, and the budget deficit exceeds a trillion dollars. As a result, it is not just about winding down the fiscal and credit stimulus, but also a shift to a tight fiscal policy. The Democratic Party and President Biden's Administration have introduced a draft tax reform to the U.S. Congress, which includes a sharp increase in federal income taxes. If passed, the tax rate in such states as New York or California could exceed 60%. In addition, a three per cent wealth tax is proposed for the first time in US history.
The stock market responded to all this news with active sales. The S&P500 index fell 4,550 to 4435, the Dow Jones dropped 35517 to 34510 in two weeks. The gold price also fell 4.5%.
As for Europe, it was gripped by the real panic associated with the record rise in gas prices, which at one point reached $970 per 1,000 cubic metres. (It was 2.8 times lower a year ago). In anticipation of the autumn-winter heating season, the necessary energy reserves are only 75% (according to other estimates, only 50%). Such energy shortages could not only drive up prices but also reduce production. And this is fraught with a new recession and will definitely not benefit the common European currency.
By far the most important event of the coming week will be the Federal Reserve meeting on September 21-22. The interest rate is likely to remain unchanged at 0.25%. Therefore, first of all, investors are waiting for signals or even a concrete decision about the beginning of the QE curtailment. As we have written before, more members of the Fed's leadership are taking a hawkish stance and supporting a reduction in the asset purchase program as early as this year. And if the hawks win at this meeting, we can expect a sharp strengthening of the dollar, and a further fall in stock indices and gold prices.
At the moment, 60% of experts vote for the rise of the US currency and the decline of the EUR/USD pair, while 30%, on the contrary, believe that nothing will happen at the Federal Reserve meeting and the pair will win back north. The remaining 10% of analysts abstain from forecasts.
The indicator readings on D1 are as follows. Among the oscillators, 75% are colored red and 25% give signals that the pair is oversold. Among the trend indicators, 100% point to the south.
Support levels are 1.1705, 1.1665, 1.1600 and 1525. Resistance levels are 1.1770, 1.1800, 1.1845, 1.1908, 1.1975, 1.2025 and 1.2100.
In addition to the Fed meeting, events in the coming week include the release of German and Eurozone PMI statistics on Thursday September 23.
GBP/USD: BoE Hawks vs Fed Hawks
The British pound, although down against the dollar, is generally holding up better than the common European currency. As expected by most analysts (60%), the GBP/USD pair went north on Monday and tested the 1.3900 high the next day, helped by good statistics from the UK labor market. This was followed by a reversal, a gradual decline and the pair's finish at 1.3730. As a result, it failed to update the two-week low of 1.3725, although it was very keen to do so.
The GBP/USD pair hardly reacted to the above forecast inflation data in Britain (CPI rose 3.2% in August vs. 2.0% in July vs. 2.9% forecast). However, such indicators reinforce the hawks' position at the Bank of England. So far, the forces of "hawks" and "doves" are equal there. According to Bank Governor Andrew Bailey, four members supported raising the key interest rate and four opposed at the last meeting of the Monetary Policy Committee (MPC).
Analysts believe that the likely rate hike in February 2022 will support the pound and further declines in the GBP/USD pair will be limited. If that expectation grows into confidence, the UK currency could move up strongly.
We will not only have an important meeting of the US Federal Reserve this week, but also a meeting of the Bank of England on Thursday, September 23, from which investors also want to receive signals on the timing of tightening monetary policy. And here, in contrast to the EUR/USD forecast, most experts side with the pound. 65% of analysts vote for the growth of the GBP/USD pair, and 35% for its further decline. But the technical indicators' readings are 100% in line with the previous pair.
Resistances are at levels 1.3765, 1.3810, 1.3910, then 1.3960, 1.4000 and 1.4100. The bulls aim to refresh the June 01 high at 1.4250. Supports are in zones 1.3700-1.3725, 1.3665 and 1.3600.
USD/JPY: Zero Again
The coming week can be safely called the week of the central banks. In addition to the US Federal Reserve and Bank of England meetings, investors will learn the views of the People's Bank of China and the Bank of Japan on the economic situation in their countries on Wednesday September 22, as well as decisions on interest rates of their national currencies. With a probability close to 100%, the yen rate will remain the same, at minus 0.1%. But BOJ leaders have a lot more to think about: they need to fill the economy's 22 trillion yen (approx. $200 billion) deficit.
However, the USD/JPY pair reacts to such figures and the news quite calmly. Unnecessary excitement is not needed in a quiet Japanese harbor.
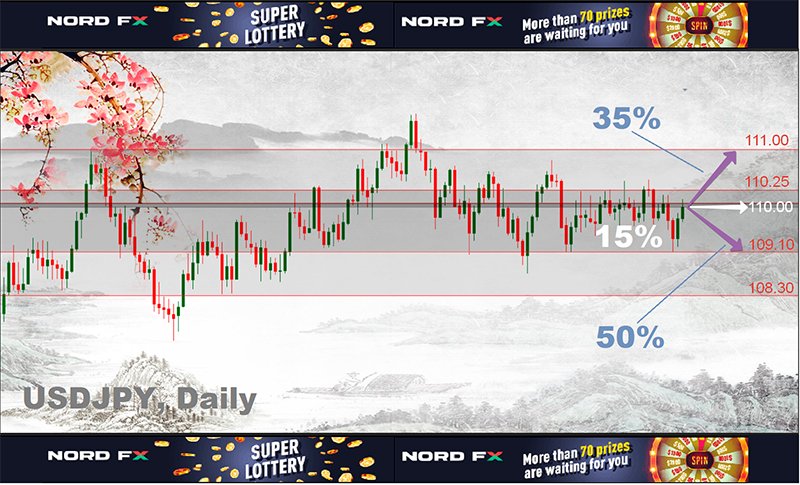
The USD/JPY pair has been moving along the 110.00 horizon since last March, making rare attempts to get out of the 108.30-111.00 trading channel. So this time, having started the five-day week at 109.85, it finished the week almost at the same place where it started, at the level of 109.95. At the same time, the experts' forecast can be considered to have come true: most of them (50%) sided with the bears last week and 35% took a neutral stance. Everything went exactly according to this scenario: at first the pair went down sharply, and then, having reached a strong medium-term support at 109.10, it failed to break it, turned around and went back.
The pair was supported by positive US retail sales statistics. In addition, according to a number of experts, the outflow of Japanese capital into foreign bonds did not allow it to go far down. Japanese investors hardly bought any bonds from other countries in 2021. But the sharp rise in US Treasuries yields pushed them to buy more than 1.76 billion yen worth of securities this Thursday. That has become a record since last November.
The experts' forecast for the near future looks like this: 50% of them side with the bears once again, 35% with the bulls, and 15% have taken a neutral stance. As for the indicators on D1, there is a complete diversity among the oscillators after such week results, while the green ones have a convincing advantage for the trend indicators.
Support levels are unchanged: 109.60, 109.10, 108.70 and 108.30. The dream of the bears (it seems already unrealizable) is to retest the April low of 107.45. The nearest resistance levels are 110.15, 110.25, 110.55, 110.80, 111.00 and 111.65. The ultimate goal of the bulls is still the same: to reach the cherished height of 112.00.
CRYPTOCURRENCIES: Black to Slightly Greenish
El Salvador entered into force a law recognizing bitcoin as a legal means of payment on Tuesday, September 7. And the quotes of the flagship cryptocurrency fell by 18% in a matter of hours: from $52,870 to $43,205. The market is slowly trying to recover after this "black" day. At the time of writing this review, the BTC/USD pair had risen to the $47,300-48,000 zone. Of course, it's not much, which is why the past week can only be described as "slightly greenish."
The Crypto Fear & Greed Index has risen by only 2 points, from 46 to 48, and is in the central neutral zone. The total crypto market capitalization remained virtually unchanged, at $2.120 trillion compared to $2.100 trillion a week ago.
The news background looks "slightly greenish" too. The most interesting news is that Panama has decided to follow El Salvador's example. A draft law on cryptocurrencies was presented to the Congress of this country. Panama currently uses the US dollar as a means of payment. If the law is passed, it will also be possible to use BTC and ETH. Unlike El Salvador, the Panamanian option does not provide for the mandatory use of cryptocurrencies, that is, citizens and companies will be able to freely decide whether they want to accept cryptocurrencies or be limited to just the dollar.
The law has not yet been passed, but analysts are already wondering how the market will react to its entry into force. Should we wait for another "black" day of the calendar, as in the case of El Salvador?
One more piece of news. Analytics software provider MicroStrategy additionally purchased 5,050 BTC at $48,099. This was announced by the head of the company Michael Saylor. As of September 12, MicroStrategy owns 114,042 BTC. A total of $3.16 billion was spent on their purchase, thus the average cost was $27,713 per coin.
Other US companies that have made similar large investments in cryptocurrency include Jack Dorsey's Square and Elon Musk's Tesla. Now they are set to be joined by billionaire Alan Howard's Brevan Howard Asset Management hedge fund, which opened a dedicated BH Digital division for these purposes.
Influencers continue to predict a great future for major cryptocurrencies. So, Austrian economist Ronald-Peter Stöferle, managing partner of investment company Incrementum AG, said that "in five to ten years, bitcoin will rise to heights that we cannot currently imagine." At the same time, the top manager noted that the next phase of bitcoin's growth has not yet begun. According to him, the rise in price of bitcoin will occur when the asset becomes "a means of inflation protection during the ongoing large monetary experiments."
Ark Invest CEO Cathie Wood expects bitcoin to rise to $500,000 within five years. In a conversation with CNBC, Wood explained that the validity of her forecast will depend on whether companies continue to diversify their bitcoin reserves and whether institutional investors decide to place 5% of assets in it.
The head of Ark Invest also highlighted the potential of Ethereum, saying that her company will likely continue to adhere to a 60% Bitcoin and 40% Ethereum strategy.
In terms of shorter-term forecasts, crypto trading veteran Ton Vays believes that the BTC/USD pair will complete the current correction relatively soon, and then rise sharply to six-digit levels. Vays explained that the recent move in the BTC price is reminiscent of July, when the flagship cryptocurrency fell to a one-year low below $29,000 and then aggressively rose to $52,000 in less than six weeks.
According to Ton Vays, bitcoin is likely to fall short and give traders an opportunity to buy near the $40,000 level. After that, it will sharply bounce off this support and rush upward. "The $40,000 low will come either next week or may be delayed until early October, and then we will cross that area with a rise to $50,000 in mid to late October. We will be over $65,000 by early November, and probably $100,000 by the end of December," he said.
Dollar and Yen the Runaway Leader on Increasing Risk of Correction in Stocks
Dollar and Yen were the runaway leaders in the forex markets last week. While Fed is not quite likely to announce tapering this week, recent solid data argues that November would finally be the date. Stocks in US and Europe have been losing much upside momentum as central banks are starting to prepare for slowing down stimulus.
Besides there are concerns over re-escalating tension between China and US, with the latter's close allies of UK and Australia added to the mix. The scale of the impact of China's Evergrande trouble is also worrying, in the background of slowdown in the economy.
Overall, development in major indexes continue to point to increasing chance of a correction. Though, Yen was somewhat still supported additionally by the powerful Nikkei. On the other hand, Australian and New Zealand Dollars ended the the worst performing ones, together with Swiss Franc.
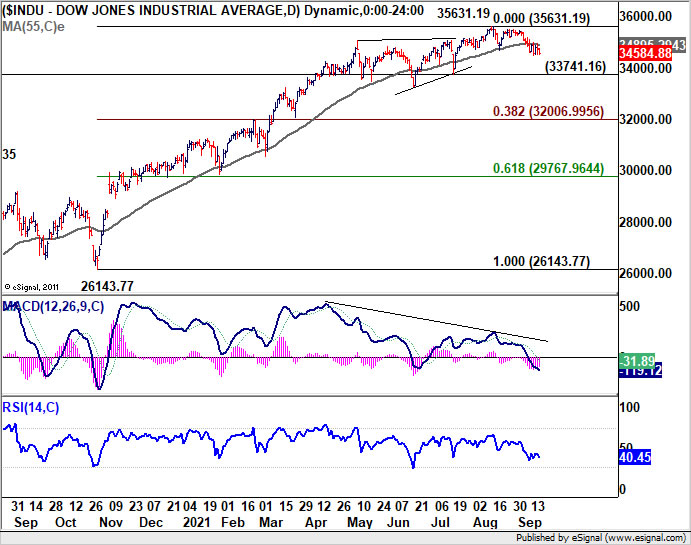
DOW capped by 55 day EMA, S&P 500 to test it soon
In last week's report, we've noted that DOW's break of 55 day EMA could be seen as a warnings for the US stock markets. Despite some recovery attempt DOW could stand back above the EMA. Considering bearish divergence condition in daily MACD, risk of a deeper correction continues to increase. For now, as long as 55 day EMA holds, we'd favor at least a take on 33741.16 support for the near term. Firm break there will argue that it's already in correction to whole up trend from 26143.77. In this case, next target would be 38.2% retracement of 26143.77 to 35631.19 at 32006.99.
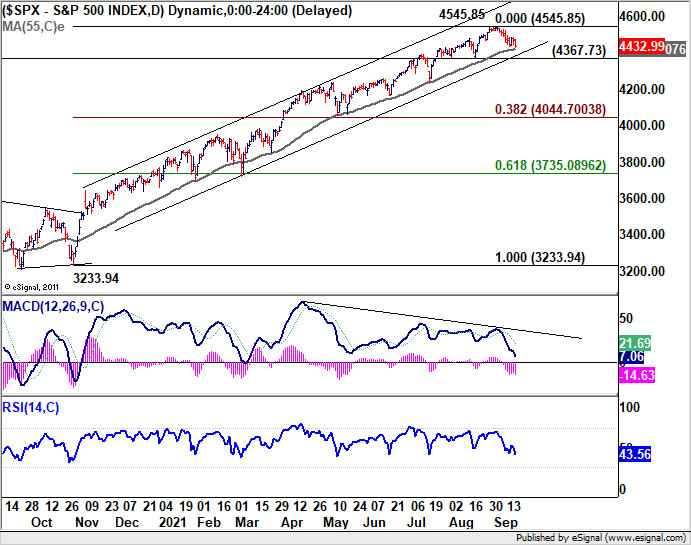
S&P 500 is so far still channelling well, supported multiple times by 55 day EMA too. But risk of a correction is also there considering bearish divergence condition in daily MACD. SPX might have a take on 55 day EMA this week. Sustained trading below there, followed by break of 4367.73 support, will align itself with DOW's selloff if that happens. In that case, we'd probably see SPX heading back to 38.2% retracement of 3233.94 to 4545.85 at 4044.70 before finding a bottom.
FTSE and DAX could also be starting a deep correction
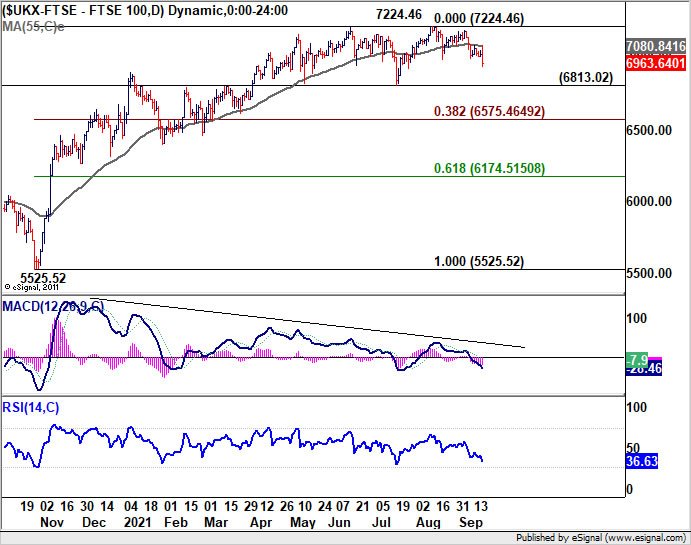
Over the Atlantic, FTSE is not looking better, as it appears to be rejected by 55 day EMA already. In the background, there is also bearish divergence condition in daily MACD. Deeper fall is in favor in the near term as long as 55 day EMA holds, for 6813.02 support. Break there will suggest that it's at least in corrective to whole rise from 5525.52, and target 38.2% retracement of 5525.52 to 7224.46 at 6575.46.
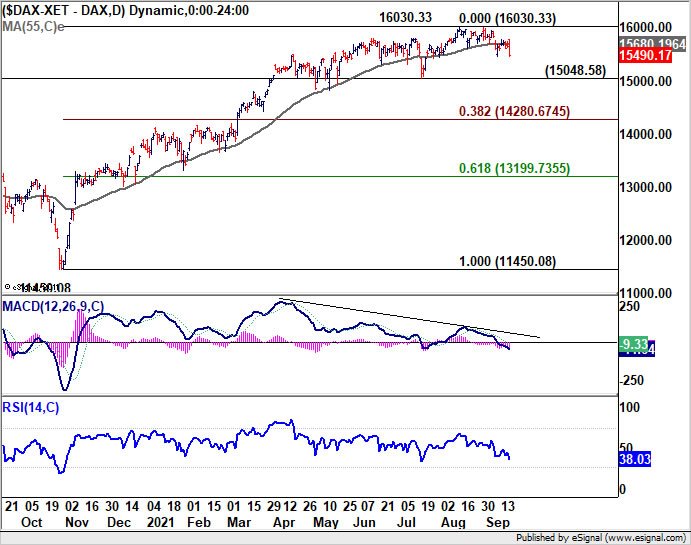
The picture of DAX is similar. If it couldn't bounce back above 55 day EMA soon, deeper fall would be in favor to 15048.58 support at least. Considering bearish divergence condition in daily MACD, break of 15048.58 will extend the decline as correction to the rise from 11450.08, to 38.2% retracement of 11450.08 to 16030.33 at 14280.67.
Nikkei made new 30-year high, but HSI extended down trend
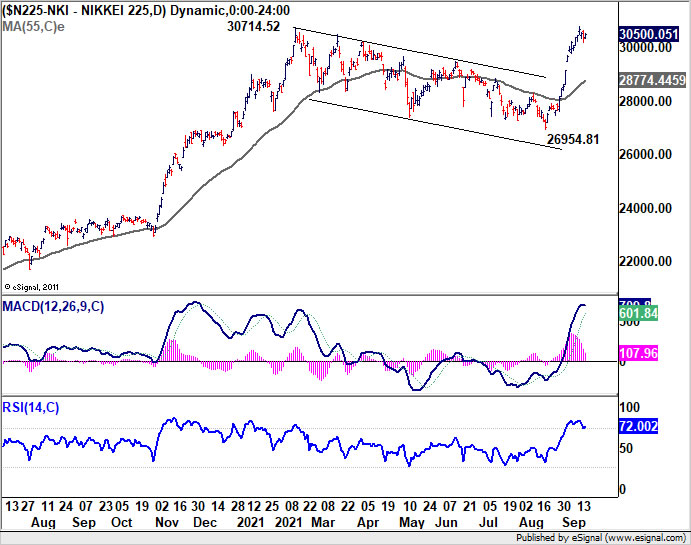
Over the pacific, the picture is very mixed, however. Nikkei extended its powerful near term rally and breached prior 30-year high at 30714.52. Overbought condition could be limiting upside for now, and a pull back cannot be ruled out. But downside should be contained well above 55 day EMA to set the stage for another rally. At that time, the break of 30714.52 would likely be full of conviction.
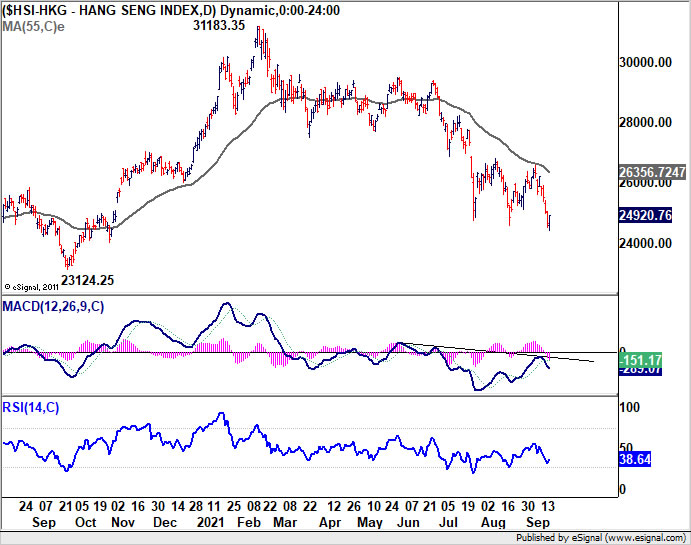
It's a totally different story for the Hong Kong HSI as it extended the down trend form 31183.35, after prior rejection by 55 day EMA. There is scope for a brief recovery higher, considering late Friday buying. But outlook will remain clearly bearish as long as 55 day EMA holds. Next down move could be powerful if we're seeing a deep correction in the US. 23124.25 support will be the target.
Dollar index on track to retest 93.72 resistance, possibly further to 94.46 fib level
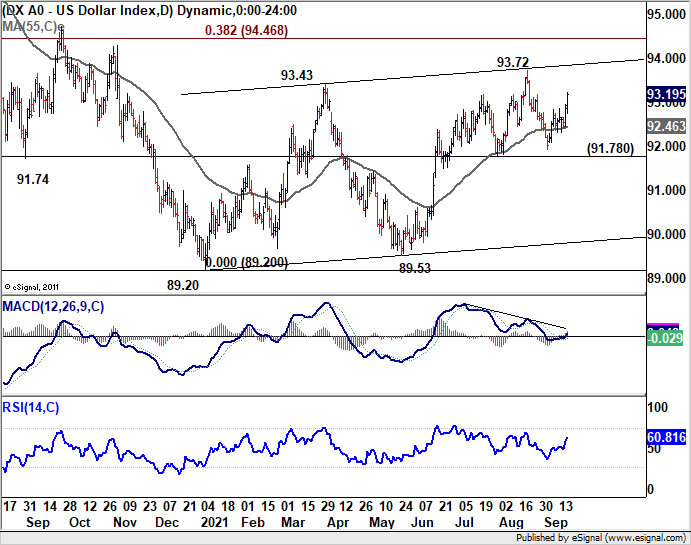
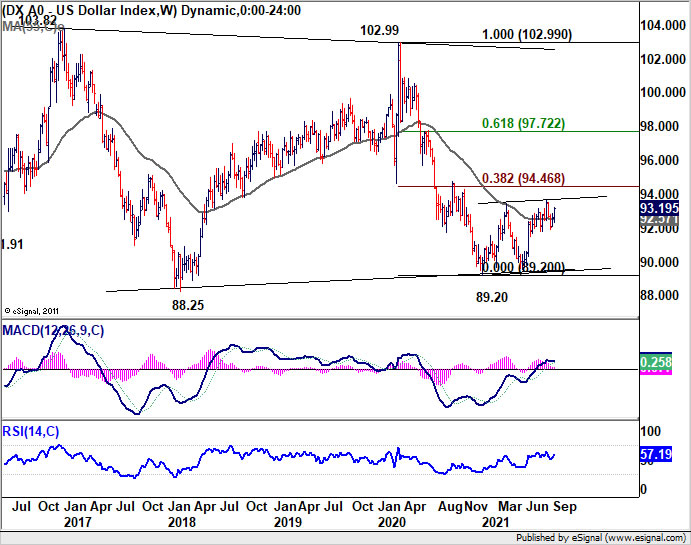
As for the Dollar index, we'd maintain that near term bullishness was defended together with 91.78 support. There is some upside prospect, on expectation of Fed tapering as well as risk aversion. Further rise is now in favor to retest 93.72 resistance. Break will extend the whole pattern from 89.20 to 38.2% retracement of 102.99 to 89.20 at 94.46, which is a major hurdle for the index to overcome.
Silver breached 22.36 support, ready to resume down trend
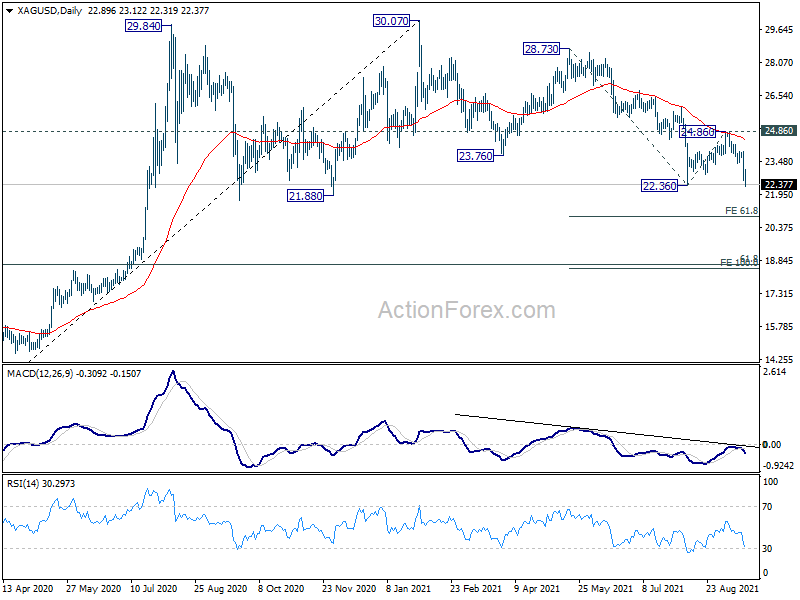
Dollar's strength was confirmed by the steep fall in Gold, and Silver too. Indeed, Silver has already breached 22.36 support, and larger fall from 30.07 should be well positioned to resume. Next target is 61.8% projection of 28.73 to 22.36 from 24.86 at 20.92. We'd look for some initial support from there to bring rebound.
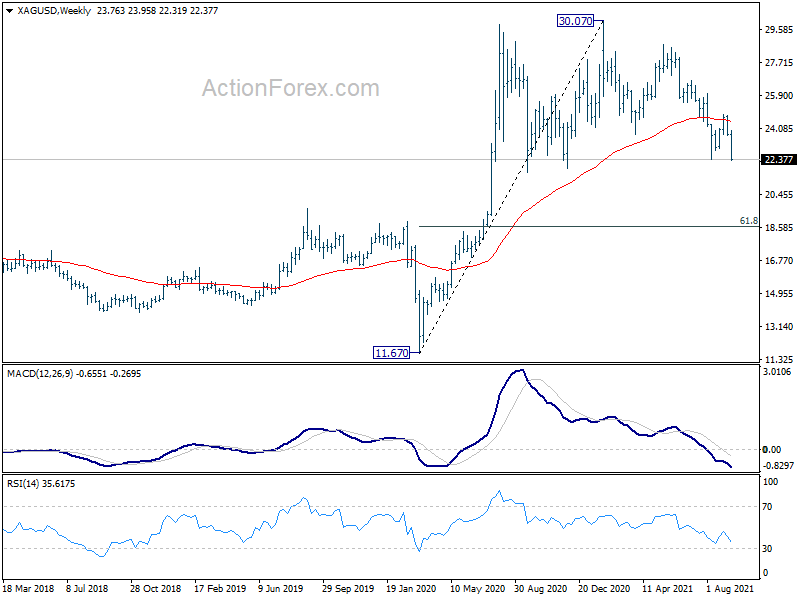
But it should also be noted that the rejection by 55 week EMA carries medium term bearish implication. The whole decline from 30.07 has the potential to drop to as low as 61.8% retracement of 11.67 to 30.07 at 18.69 before completion.
CHF/JPY in key support zone as fall from 122.74 resumed
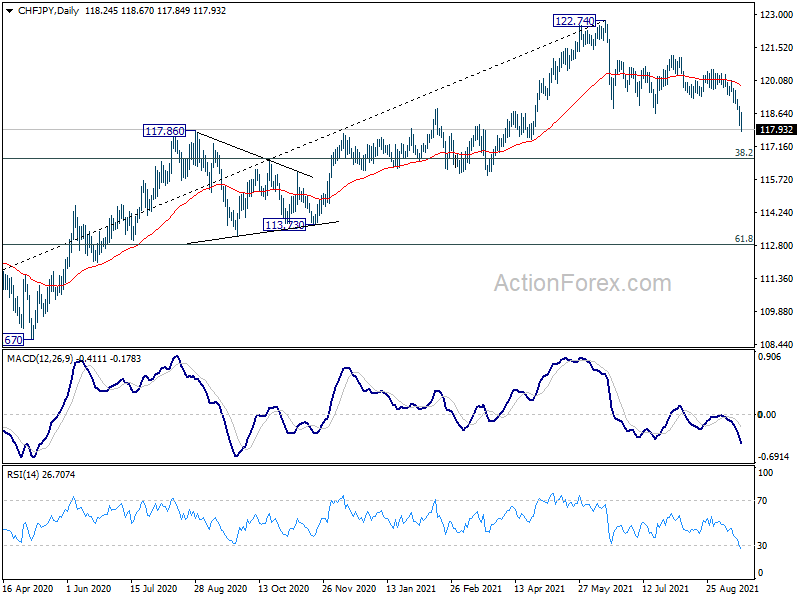
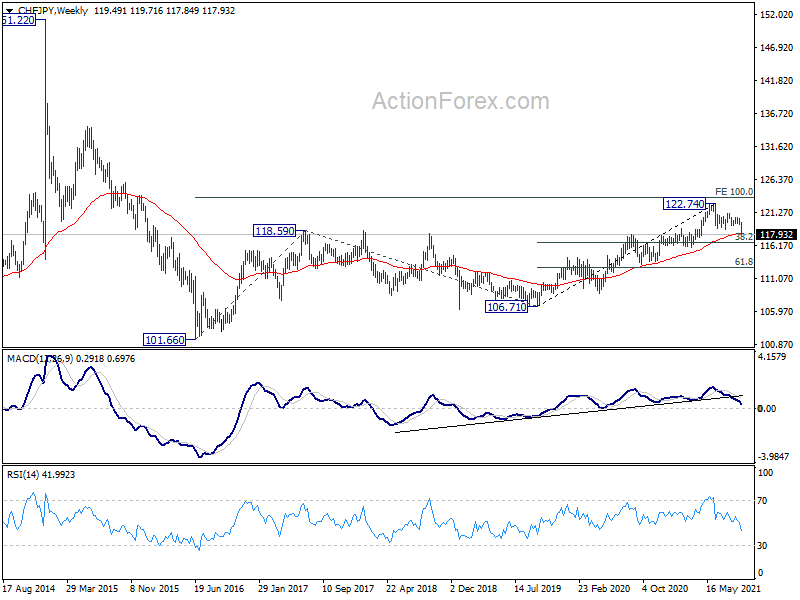
If the markets (except Japan) do turn into a deep risk-off mode, there is prospect for further even stronger rally in crosses. Yen has the potential to continue to outperform Swiss Franc as safe haven currency. As the fall from 122.74 resumed last week, it's now inside an important support zone between 38.2% retracement of 106.71 to 122.74 at 116.61 and 55 week EMA (now at 118.05). Sustained break there will be a strong indication of medium term bearish reversal. CHF/JPY could dive further to 61.8% retracement at 112.83 at least. But of course, the tide would turn if CHF/JPY could form a base at this zone and rebound.
USD/CAD Weekly Outlook
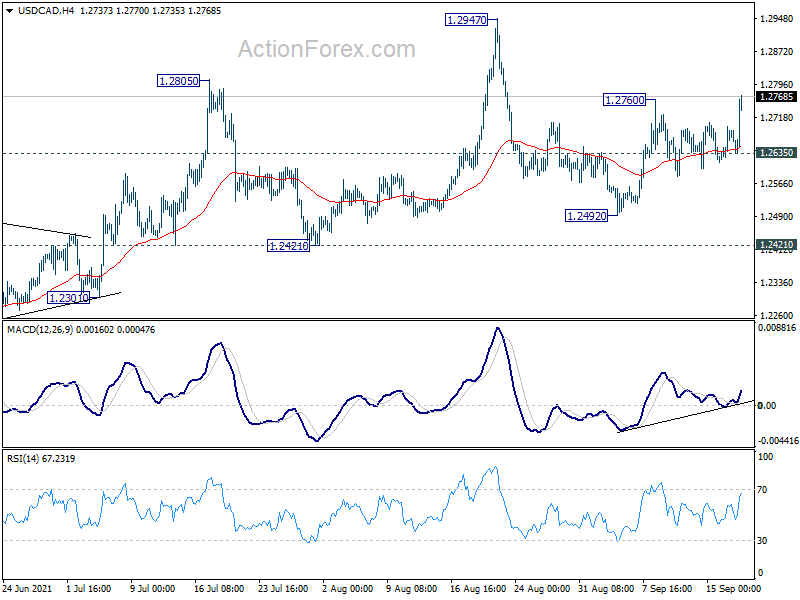
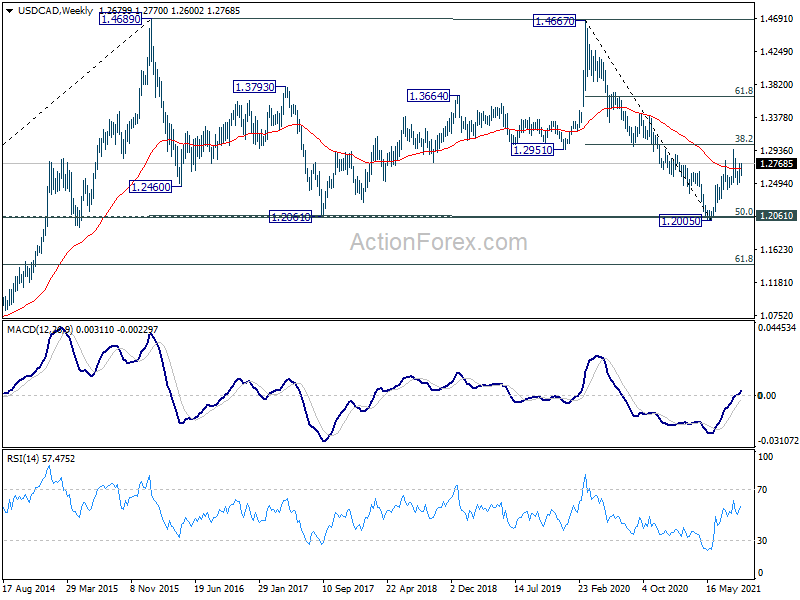
After some consolidations, USD/CAD's rebound from 1.2492 resumed by breaking through 1.2760. Initial bias is back on the upside this week for retesting 1.2947 high first. Also, larger rise from 1.2005 is still in progress with 1.2421 support intact. Break of 1.2947 will target 1.3022 fibonacci level next. On the downside, though, break of 1.2635 minor support will turn bias back to the downside for 1.2421 structural support.
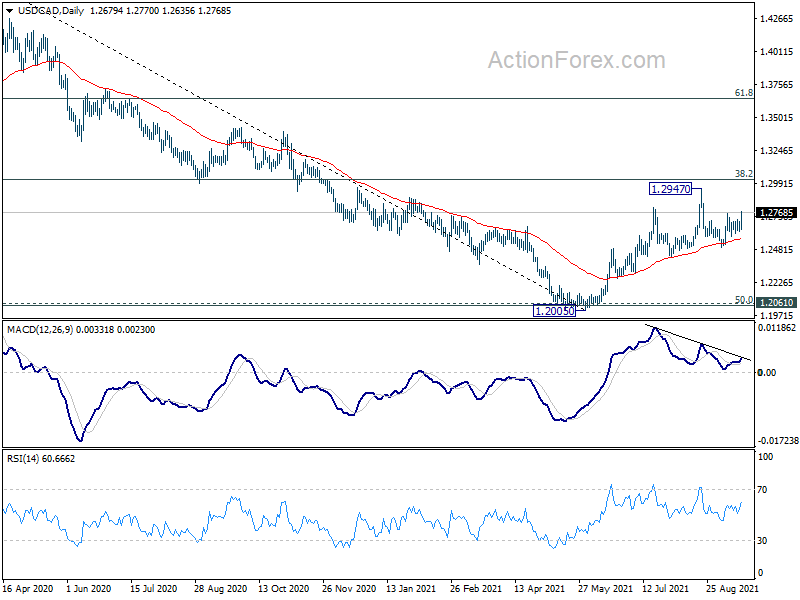
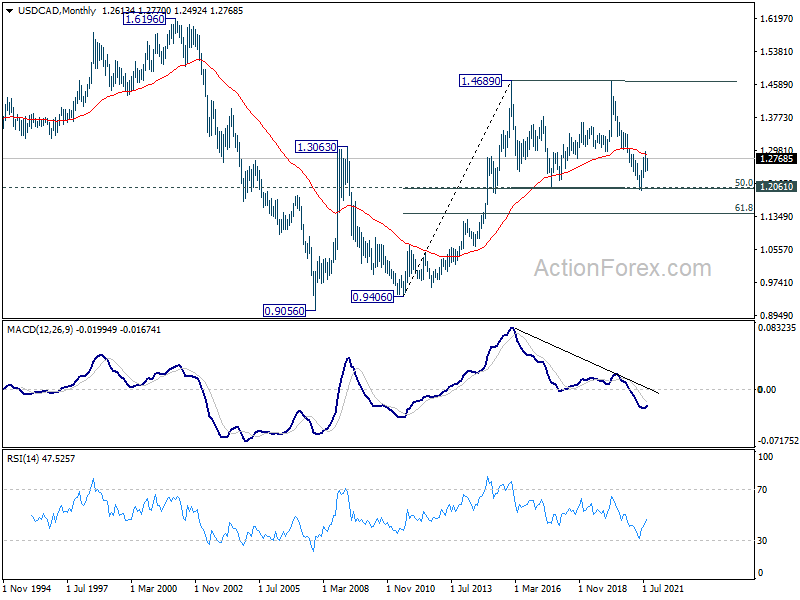
In the bigger picture, fall from 1.4667 is seen as the third leg of the corrective pattern from 1.4689 (2016 high). It should have completed after hitting 1.2061 (2017 low) and 50% retracement of 0.9406 to 1.4689 at 1.2048. Sustained break of 38.2% retracement of 1.4667 to 1.2005 at 1.3022 will pave the way to 61.8% retracement at 1.3650 and above. Overall, medium term outlook remains neutral at worst with 1.2048/61 support zone intact.
In the longer term picture, we're viewing price actions from 1.4689 as a consolidation pattern. Thus, up trend from 0.9506 (2007 low) is still expected to resume at a later stage. This will remain the favored case as long as 1.2061 support holds, which is close to 50% retracement of 0.9406 to 1.4689 at 1.2048. However, rejection by 55 month EMA, follow by firm break of 1.2061 support, will argue that USD/CAD has already started a long term down trend.
Fed Research – Preview: What to Do in a Bad Trade-Off?
Key takeaways
The Fed is in a difficult position amid slower growth and still high inflation. Given the weak jobs report and lower-than-anticipated inflation in August, we expect the Fed will refrain from providing more details at this meeting, as the Fed has already made it clear that tapering is set to begin before year-end.
We believe the tapering pace is more important than the timing. We continue to expect that tapering will be concluded in mid-2022.
We expect the Fed to raise the 'dots' by signalling the first rate hike in 2022 (up from 2023 currently). We still expect the first rate hike in H2 2022 in either September or December.
Fixed Income: We expect the imminent market reaction should be muted in the US fixed income market if we (and consensus) are right. However, we see risks tilted to the upside. We still forecast 10yr US Treasury yields in 2.0% in 12M.
FX: The continued push towards tighter global liquidity conditions (Chinese deleveraging, ECB fading PEPP and Fed tapering) is positive for the dollar. We continue to see downside risks to EUR/USD over the coming year, targeting 1.15 in 12M (1.13 in 15M).
CFTC Commitments of Traders – Net Longs Increased in Crude Oil Futures on Supply Disruption Concerns
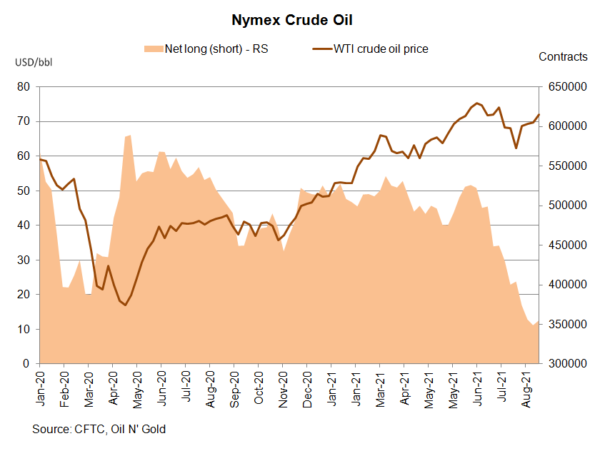
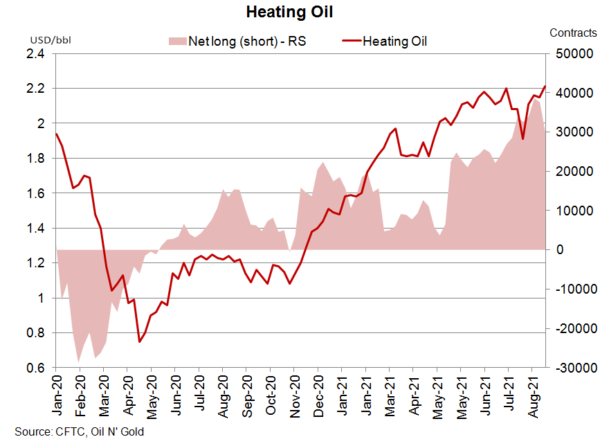
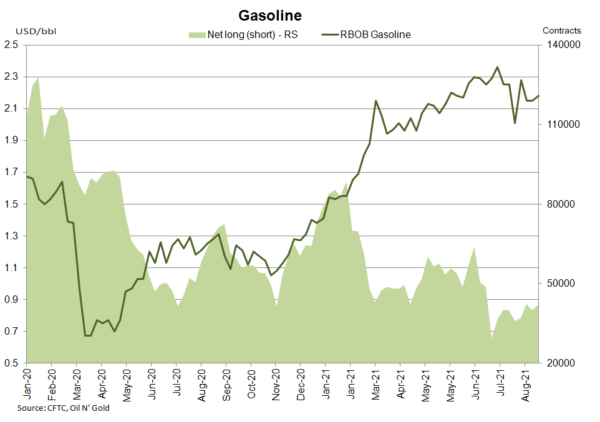
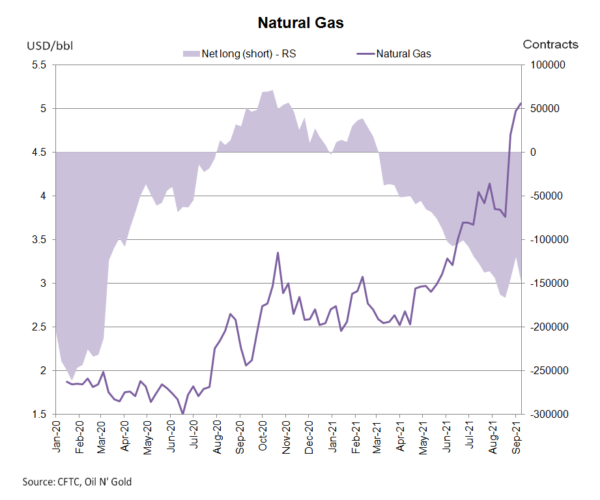
According to the CFTC Commitments of Traders report for the week ended September 14, NET LENGTH of crude oil futures rose +5 906 contracts to 355 064. Although Hurricane Nicholas receded, disruption to US Gulf crude output could take some time to recover. For refined oil products, NET LENGTH for heating oil declined -7 668 contracts to 29 991, while that for gasoline gained +2 114 contracts to 41 972. NET SHORT of natural gas futures soared +28 601 contracts to 148 579 during the week.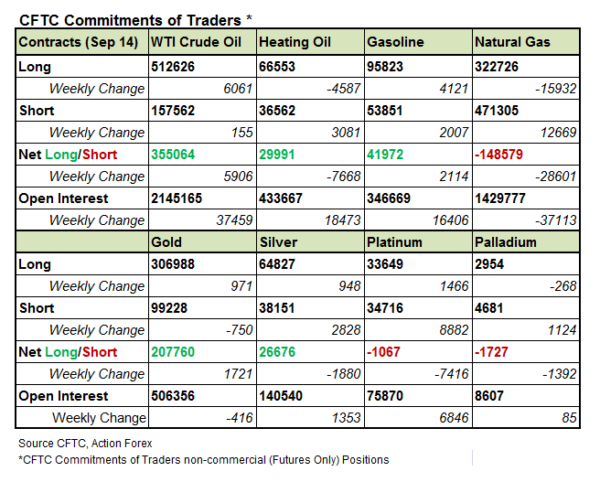
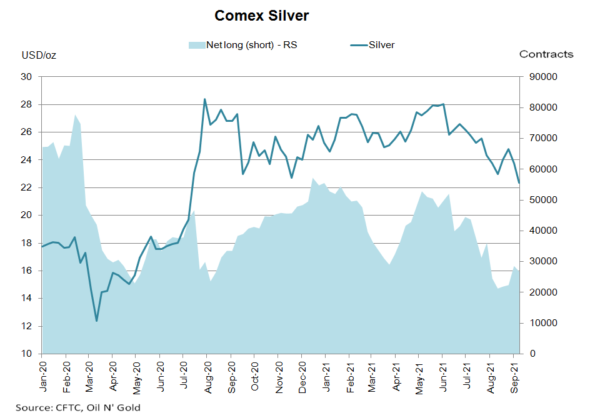
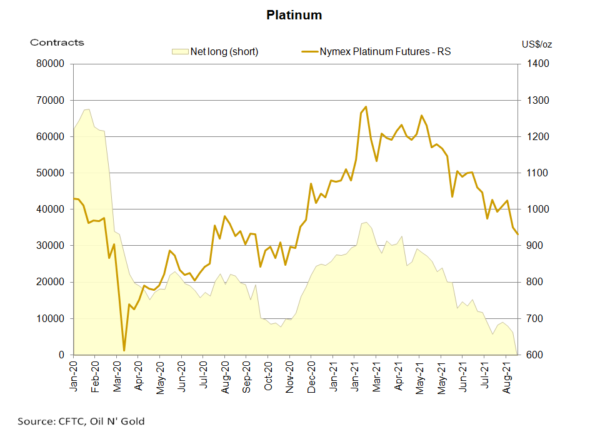
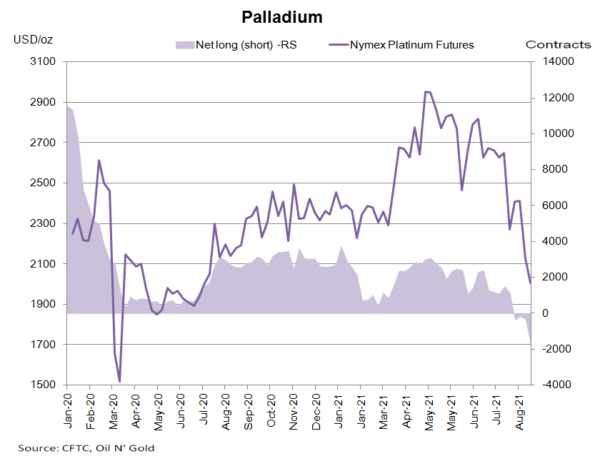
 Gold futures’ NET LENGTH gained +1 721 contracts to 207 760. Silver futures’ NET LENGTH dropped -1 880 contracts to 26 676. For PGMs, Nymex platinum futures drifted to NET SHORT of 1 067 contracts, while NET SHORT for palladium futures added +1 392 contracts of 1 727.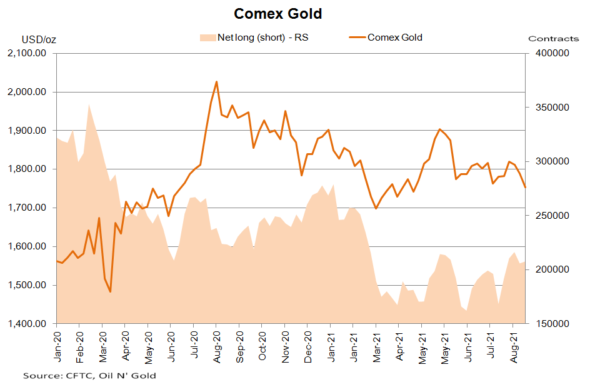
EUR/USD Weekly Outlook
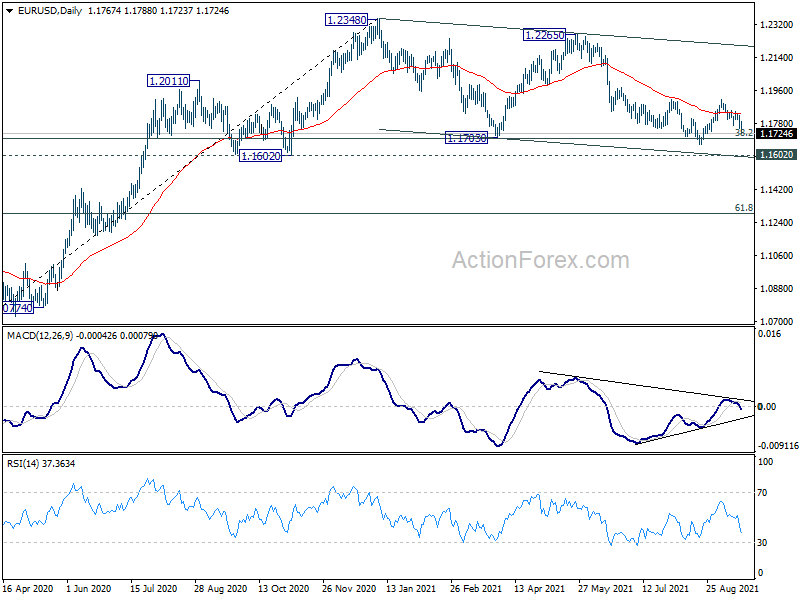
EUR/USD's fall from 1.1908 extended lower last week and the development argues that rebound from 1.1663 has completed at 1.1908 already, after rejection by 1.1907 resistance. Initial bias remains on the downside this week for retesting 1.1663. Firm break there will resume the fall from 1.2265, and the pattern from 1.2348 to 1.1602 key support next. On the upside, above 1.1788 will turn bias back to the upside for 1.1908 again.
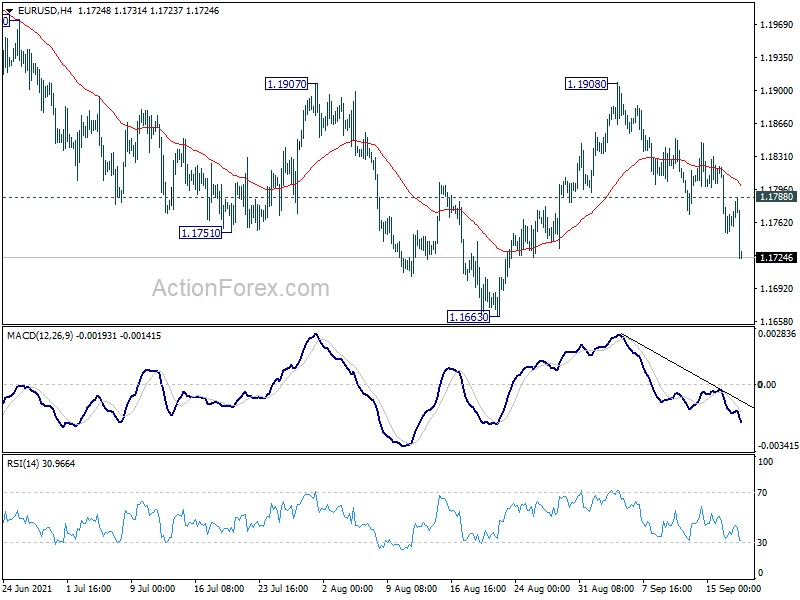
In the bigger picture, rise from 1.0635 is seen as the third leg of the pattern from 1.0339 (2017 low). Further rally remains in favors long as 1.1602 support holds, to cluster resistance at 1.2555 next, (38.2% retracement of 1.6039 to 1.0339 at 1.2516). However sustained break of 1.1602 will argue that the rise from 1.0635 is over, and turn medium term outlook bearish again. Deeper fall would be seen to 61.8% retracement of 1.0635 to 1.2348 at 1.1289 and below.
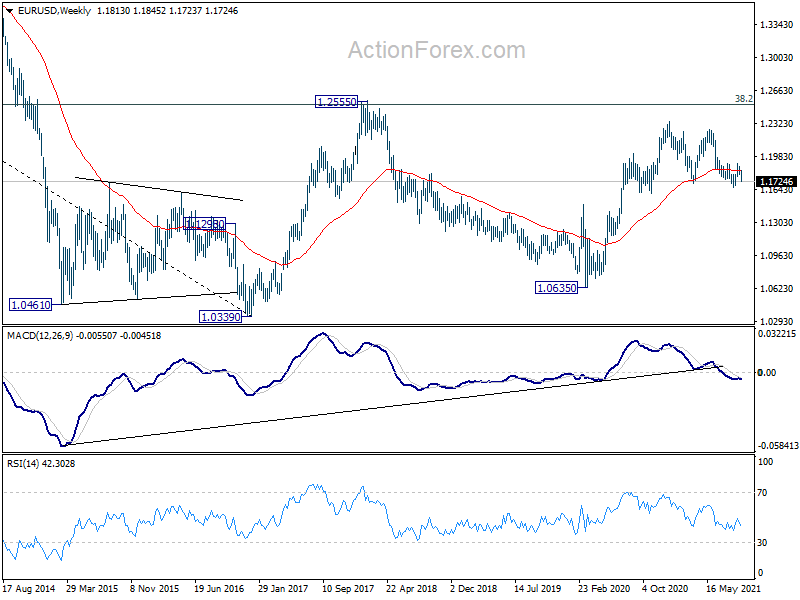
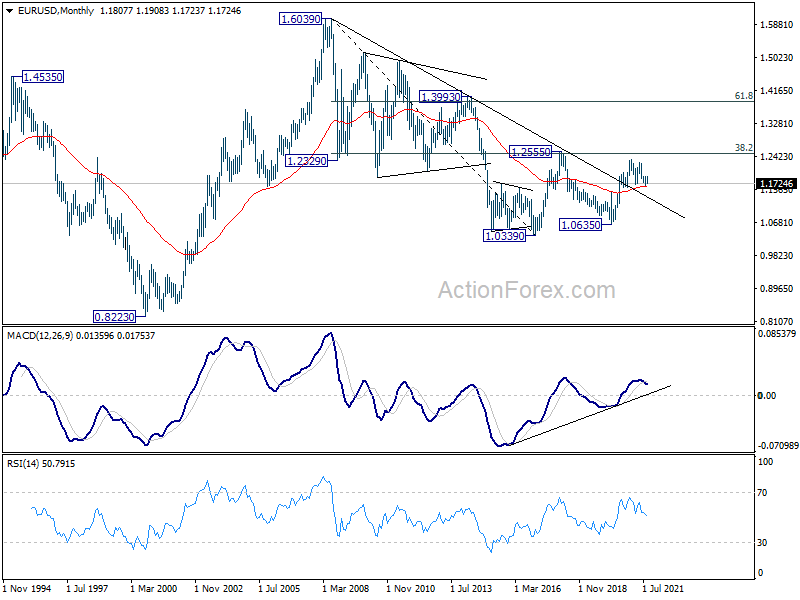
In the long term picture, focus remains on 1.2555 cluster resistance (38.2% retracement of 1.6039 to 1.0339 at 1.2516). Sustained break there should confirm long term bullish reversal and target 61.8% retracement at 1.3862 and above. However, rejection by 1.2555 will keep long term outlook neutral first, and raise the prospect of down trend resumption at a later stage.
USD/JPY Weekly Outlook
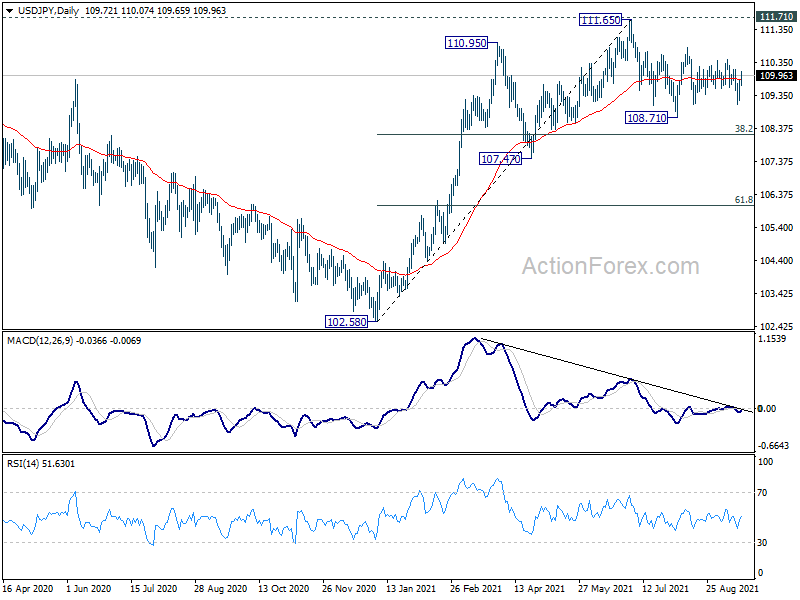
USD/JPY rebounded after defending 109.10 support last week, but stayed in familiar range. Initial bias remains neutral this week first. On the upside, above 110.44 will turn bias back to the upside for 110.79, and then 111.65 high. On the downside, break of 109.10 will argue that larger fall from 111.65 is resuming. Deeper decline should then be seen to 108.71 support first, and then 38.2% retracement of 102.58 to 111.65 at 108.18 next.
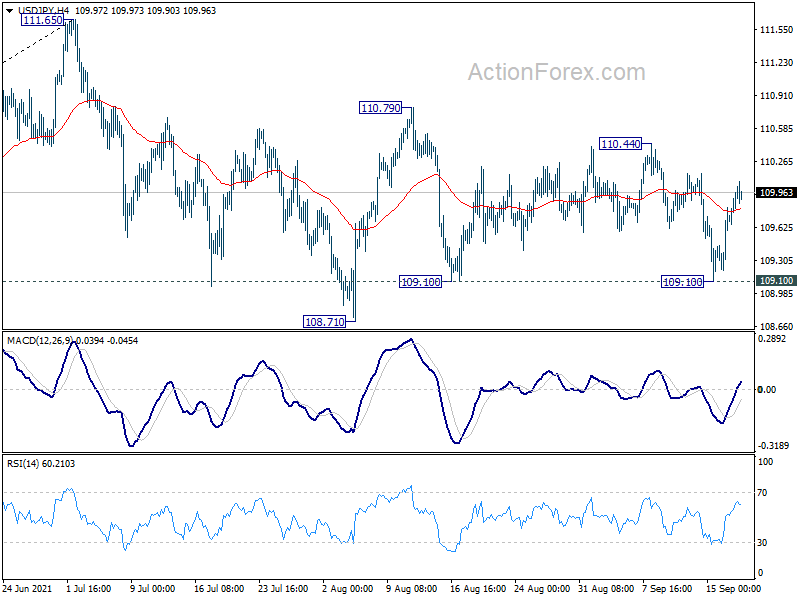
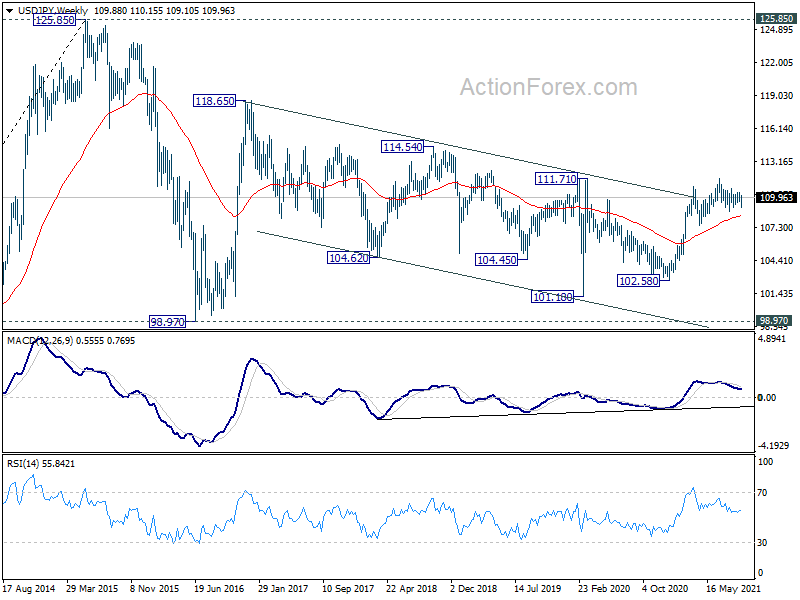
In the bigger picture, medium term outlook is staying neutral with 111.71 resistance intact. The pattern from 101.18 could still extend with another falling leg. Sustained trading below 55 day EMA will bring deeper fall to 107.47 support and below. Nevertheless, strong break of 111.71 resistance will confirm completion of the corrective decline from 118.65 (2016 high). Further rise should then be seen to 114.54 and then 118.65 resistance.
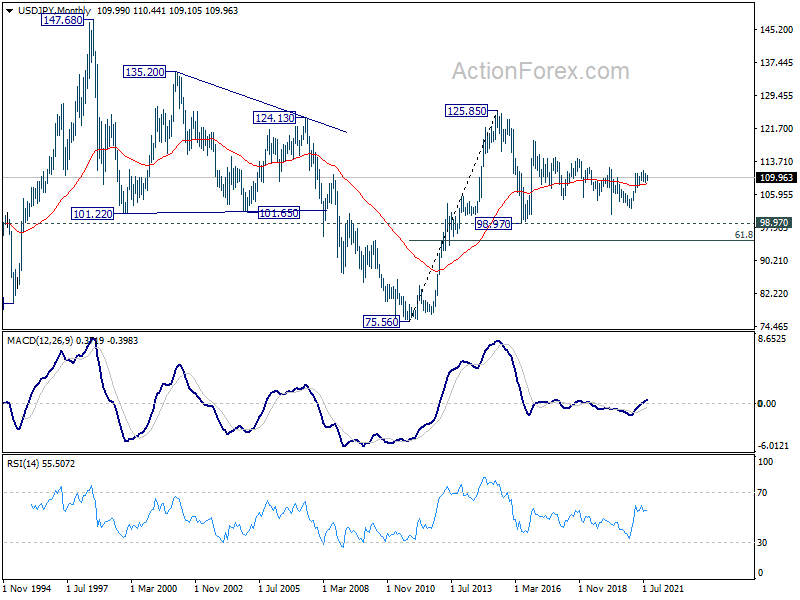
In the long term picture, the rise from 75.56 (2011 low) long term bottom to 125.85 (2015 high) is viewed as an impulsive move, no change in this view. Price actions from 125.85 are seen as a corrective pattern which could still extend. In case of deeper fall, downside should be contained by 61.8% retracement of 75.56 to 125.85 at 94.77. Up trend from 75.56 is expected to resume at a later stage for above 135.20/147.68 resistance zone.
GBP/USD Weekly Outlook
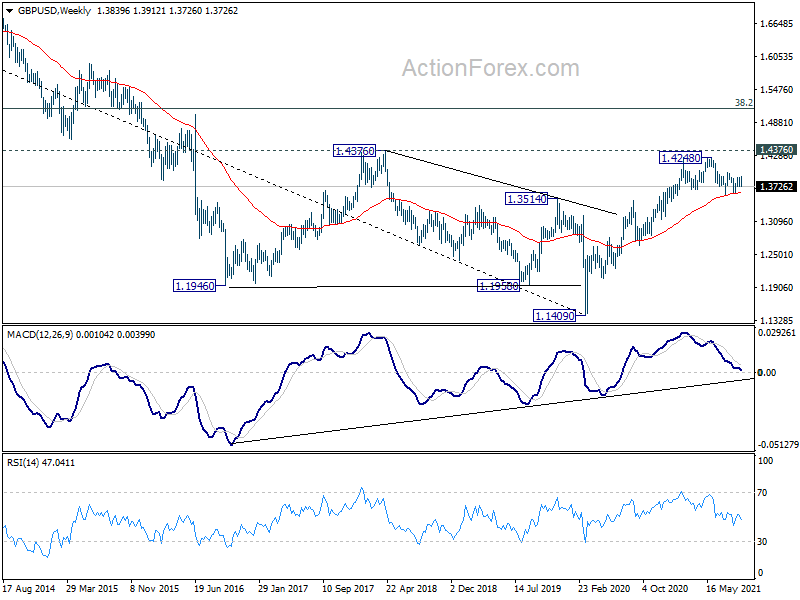
GBP/USD's decline last week argues that rebound from 1.3601 has completed at 1.3912 already. Immediate focus is on 1.3725 support this week. Firm break there will confirm would likely resume the fall from 1.4248 to 1.3482 resistance turned support next. On the upside, through, above 1.3912 will target 1.3982 resistance instead.
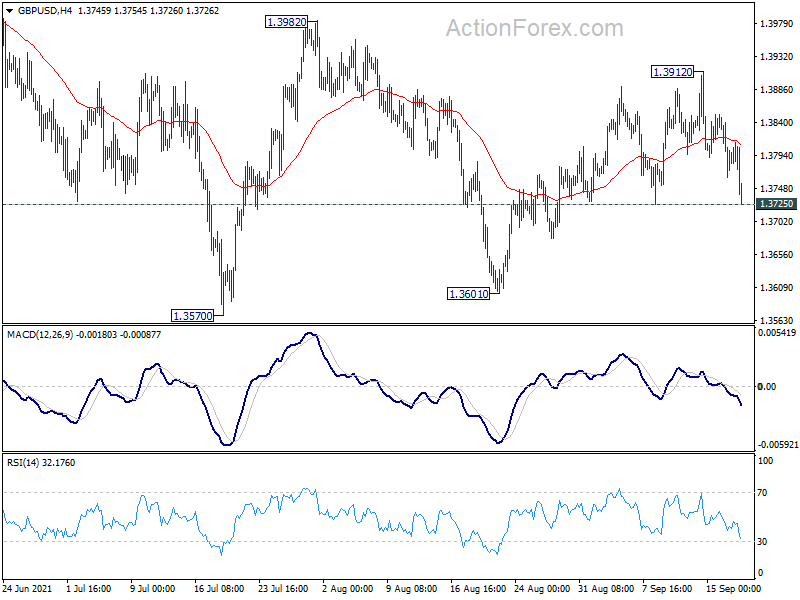
In the bigger picture, as long as 1.3482 resistance turned support holds, we'd still treat price actions from 1.4248 as a corrective move. That is, up trend from 1.1409 (2020 low) is in favor to resume. Decisive break of 1.4376 key resistance (2018 high) would indeed carry long term bullish implications. However, sustained break of 1.3482 will at least bring deeper fall to 38.2% retracement of 1.1409 to 1.4248 at 1.3164, or even further to 61.8% retracement at 1.2493.
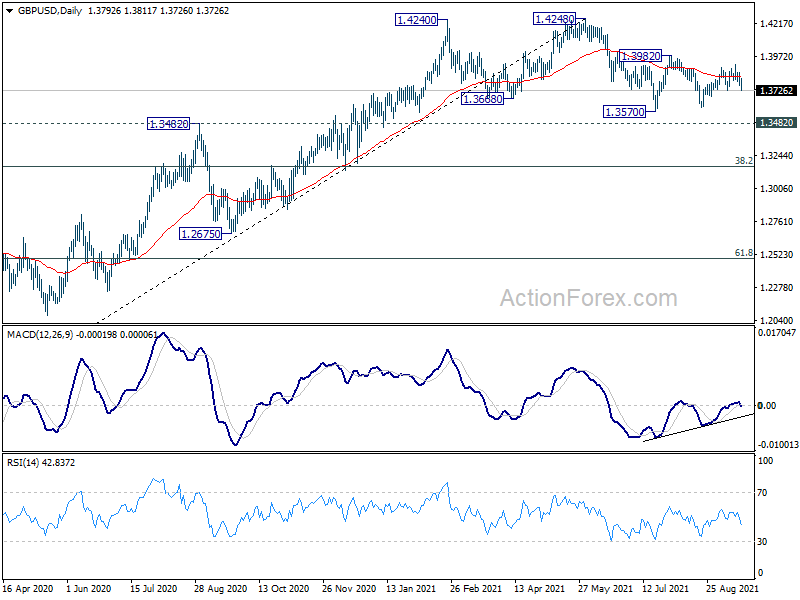
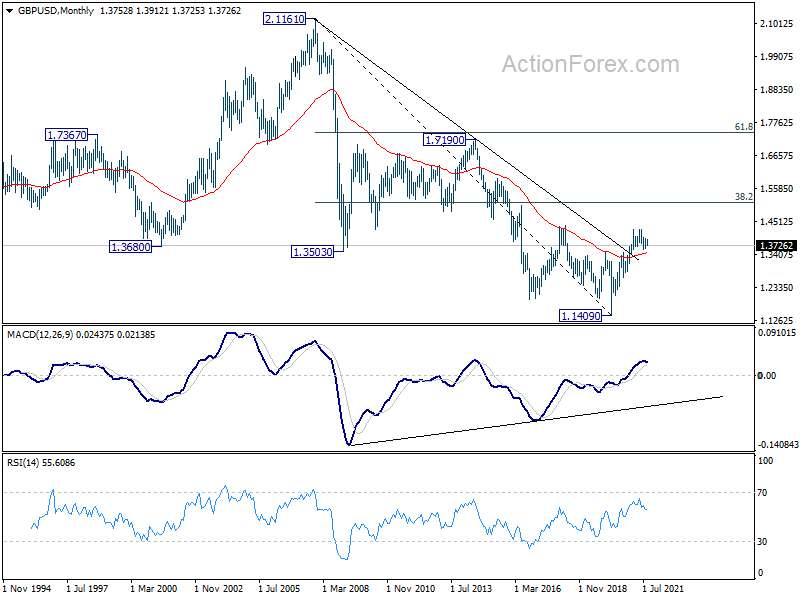
In the longer term picture, a long term bottom should be in place at 1.1409, on bullish convergence condition in monthly MACD. Rise from there would target 38.2% retracement of 2.1161 to 1.1409 at 1.5134. Reaction from there would reveal whether rise from 1.1409 is just a correction, or developing into a long term up trend.