Sample Category Title
USD Gains On Stronger Retail Sales
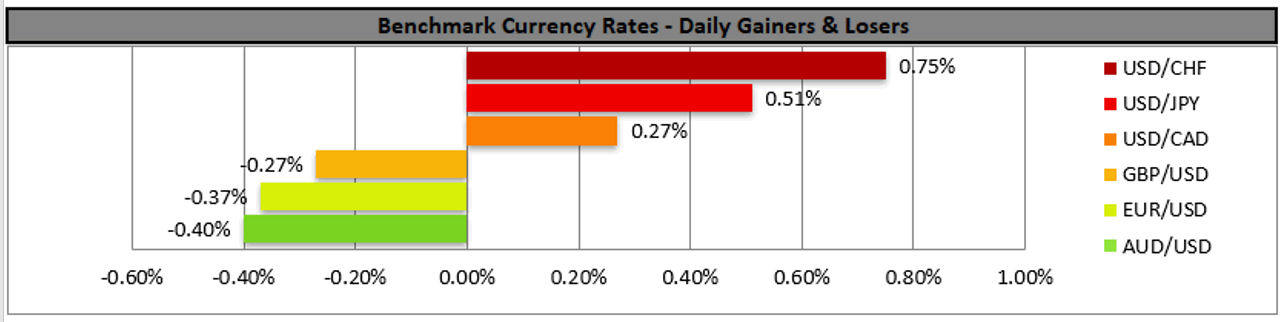
The greenback remained at rather high levels yesterday, gaining against a number of its counterparts after stronger than expected financial data released yesterday tended to reshuffle the market’s expectations for the Fed’s intentions. The US retail sales growth rate for August accelerated more than expected escaping the negative territory and showing growth once again while the business sentiment in the wider Philly area seems to improve. On the other hand, the weekly initial jobless claims figure rose underscoring a possible slack in the US employment market. US stockmarkets tended to close rather mixed, as investors contemplated the possible effects of the financial data released, while gold’s price retreated clearly due to the strengthening of the USD as US yields showed little movement. We expect trader’s attention to turn towards the release of the preliminary University of Michigan Consumer Sentiment for September, while market worries for the possible intentions of the Fed could also provide direction for the markets.
The USD index chart was in dire need of a recalibration, as the price action indicated the importance of the 92.85 (R1) resistance line, which also halted at least temporarily USD index’s upward price action yesterday. To switch our bias for a sideways motion in favor of a bullish outlook we would require though a clear breaking of the 92.85 (R1) resistance line. It should be noted that the RSI indicator below our 4-hour chart is between the readings of 50 and 70, implying a light advantage for the bulls for the time being. Should the bulls actually take over, we would expect the index to break the 92.85 (R1) resistance line and aim for the 93.20 (R2) resistance level, which capped the index’s upward motion on the 10th and the 27th of August. Should the bears say enough is enough, we may see the index reversing course, breaking the 92.40 (S1) support line, which forms the lower boundary of the index sideways motion and aim for the 92.08 (S2) level, which held its ground against the index’s downward motion early September.
The pound retreats against the USD, yet not the EUR
The pound retreated against the USD, yet not the EUR as GBP traders now turn their attention on the release of the UK retail sales growth rate for August, while considerable market attention is also placed on BoE’s interest rate decision next week. The pound had gained somewhat the momentum in the current week as the markets are expecting BoE to show a firmer stance regarding its monetary policy given that CPI rates accelerated substantially last month while the employment market tended to tighten for the month of July. On the fundamental side the UK seems about to face an energy crisis, which could weigh on the recovery of the UK economy and its characteristic that a major fertilizer producer shut down two plants not clearing when production is expected to restart. We expect pound traders today to focus on the release of the UK retail sales growth rate for August, yet fundamentals may also sway pound traders opinion.
GBP/USD dropped yesterday placing some distance between its price action and the 1.3845 (R1) resistance line, yet the bearish trendline does not seem to be forming just yet. We tend to maintain a bias for a sideways motion for the time being, despite the RSI indicator below our 4-hour chart, which is just below the reading of 50, reminding us of the presence of the bears. Should the selling interest be extended, we may see the pair breaking the 1.3670 (S1) line and aim for lower grounds. Should the bulls take over we may see the pair breaking the 1.3845 (R1) and continue higher to test the 1.3990 (R2) level.
Other economic highlights today and the following Asian session:
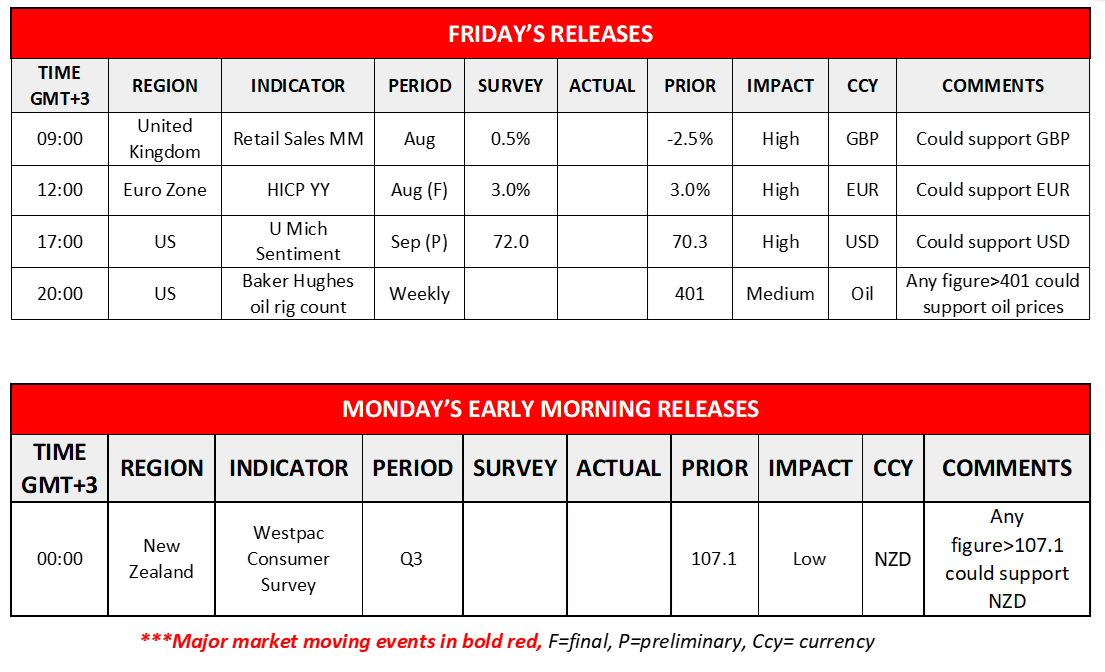
Today we note the release of UK’s retail sales for August and Eurozone’s HICP rate for August. In the American session we note the release of the preliminary University of Michigan consumer sentiment for September.
USD Index H4 Chart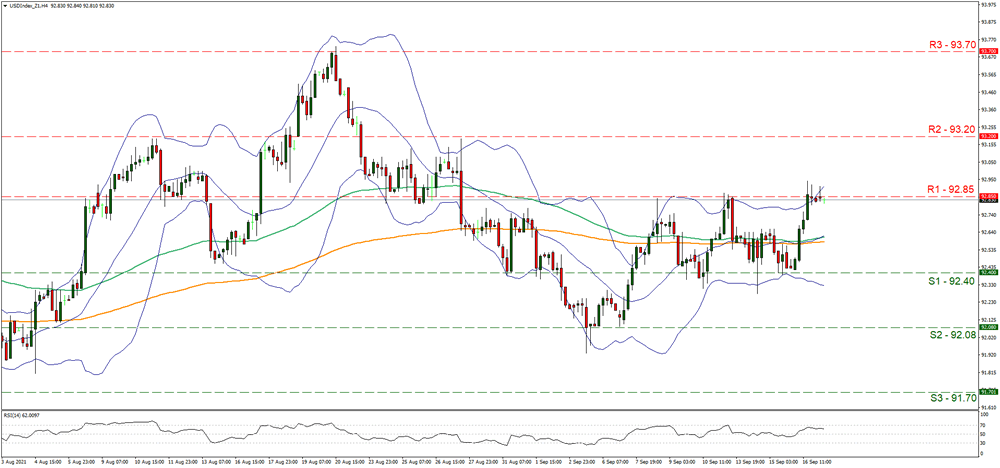
Support: 92.40 (S1), 92.08 (S2), 91.70 (S3)
Resistance: 92.85 (R1), 93.20 (R2), 93.70 (R3)
GBP/USD H4 Chart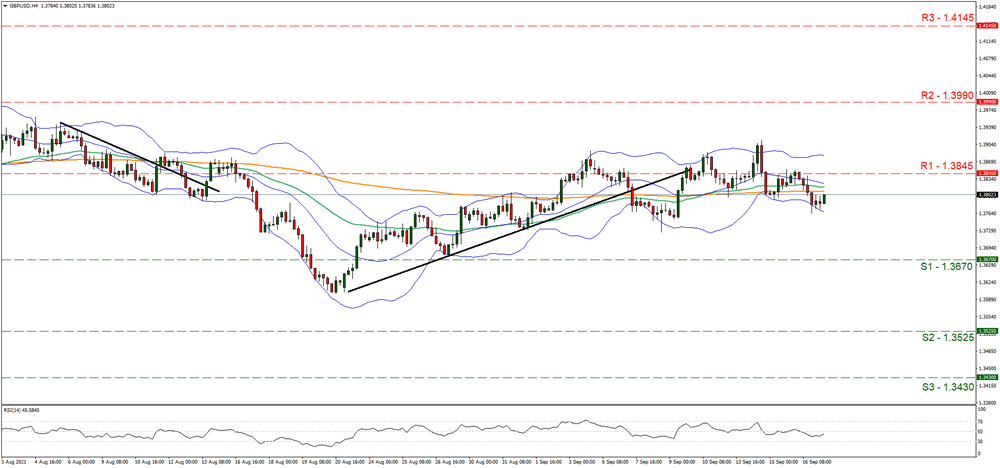
Support: 1.3670 (S1), 1.3625 (S2), 1.3430 (S3)
Resistance: 1.3845 (R1), 1.3990 (R2), 1.4145 (R3)
Asia Follows US With Mixed Results
Asian equities mixed to finish the week
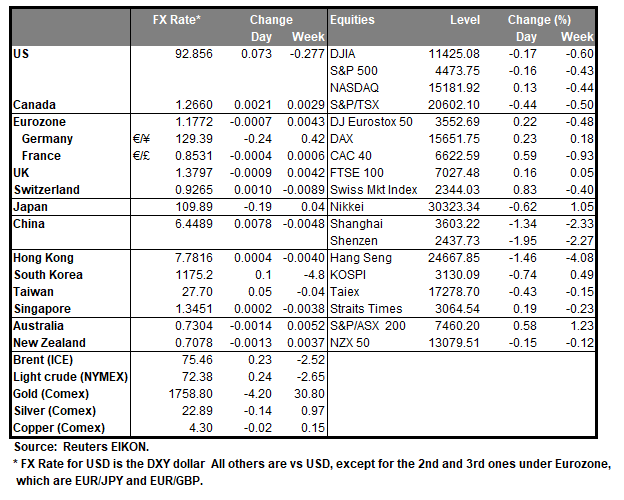
Wall Street had a volatile intra-day session overnight, with the US Retail Sales jump unwinding the intra-day recovery as Fed tapering prospects were priced in leaving a very mixed finish for the major indices. US Retail Sales for August surprised to the upside, climbing 0.70% versus an expected fall of -0.70%
The S&P 500 fell by 0.15%, the Nasdaq rose by 0.13%, and the Dow Jones fell by 0.18%. More ominously, futures have continued south today. The S&P 500 e-minis are 0.20% lower, the Dow futures have fallen 0.33% while the Nasdaq futures are unchanged. Like overnight markets, US investors appear to be rotating into the apparent safety of tech.
Asia is a mixed bag, with the Nikkei 225 seeing dip-buyers lifting it 0.55% higher. The Kospi is ignoring North Korea uranium enrichment headlines, rising a modest 0.15%. China markets are mixed as China property giant Evergrande’s shares have fallen once again today. Regulatory nerves were balanced by the PBOC injected CNY 90 bio via the 7-day and 14-day repos. The Shanghai Composite has fallen by 0.58% mirroring the Dow, while the CSI 300 has climbed 0.27% and Hong Kong is 0.38% higher.
Regionally, Singapore is down 0.15% with Taipei and Jakarta falling 0.45%, while Jakarta holds at unchanged. Another fall in iron ore overnight, along with heightened tensions with China (again), is weighing on Australian markets today. The ASX 200 is 0.90% lower, while the All Ordinaries is down 0.80%. European markets are likely to open unchanged to slightly down this afternoon after a nervous US close and a mixed day in Asia.
Taking a look ahead, next week’s FOMC meeting is the key inflection point for the taper trade now. Markets will be looking for a signal that the November meeting will be live for the announcement of the taper.
USDCAD Fails To Gain Optimism For Bullish Bias In Short-Term
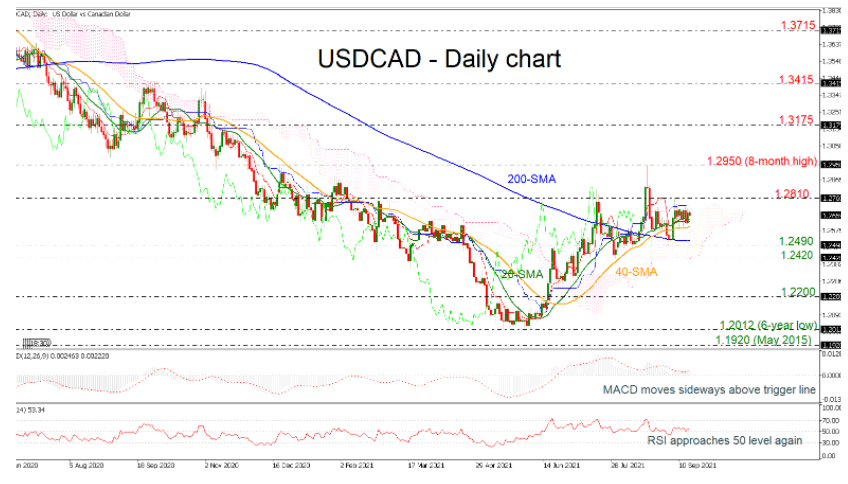
USDCAD has been trading back and forth the 20-day simple moving average (SMA) over the last month, failing to improve the bullish view in the short-term. The pair rebounded off the six-year low of 1.2012 and is creating higher highs and higher lows; however, the technical indicators are mirroring the latest weak momentum.
The MACD oscillator dived below its trigger line but is still in the positive region, while the RSI is ticking lower above its neutral threshold of 50. The Ichimoku cloud has been rising with the market action over the last more than three months.
In the event the bulls take control, the 1.2810 level will come first into view. A violation at this point may see another challenging battle around the eight-month high of 1.2950 before running towards the 1.3175 barrier.
Should the bears dominate, driving the price below the 20- and 40-day SMAs, the spotlight would shift to the crucial 200-day SMA around the 1.2490 support, where any step lower will take the pair until 1.2420 and the 1.2200 inside swing high from May 12. The upside bias would also face a serious deterioration if the decline extends below 1.2012.
To sum up, although USDCAD continues to face unfavorable trend signals in the very short-term, the odds for an upturn seem to grow, with the confirmation expected to come above 1.2950.
XAUUSD Is Possibly Bearish
Technical analysis
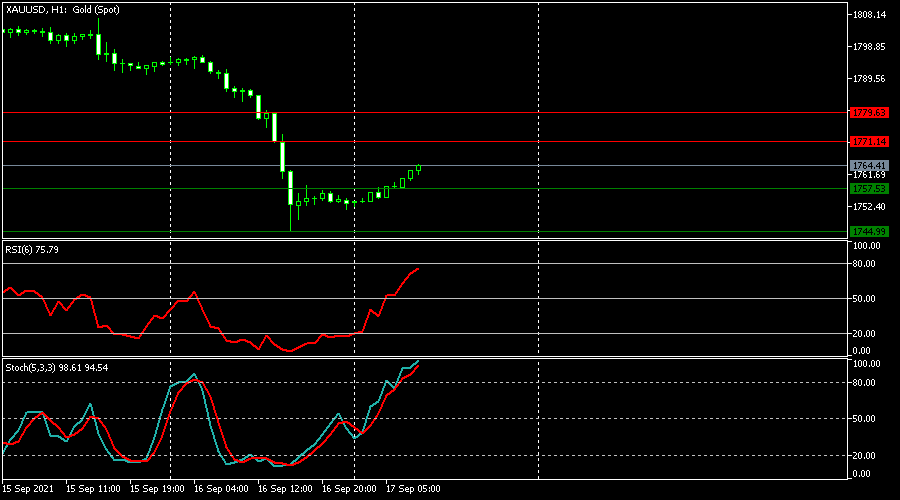
The RSI is above 50, near the overbought zone
The Stochastic crossed the overbought zone
Most likely scenario - SELL
Target prices: 1,757.53 1,744.99
Alternative scenario - BUY
Target prices: 1,771.14 1,779.63
Key levels
Support 1,757.53 1,744.99
Resistance 1,771.14 1,779.63
Get Out There And Shop
US Retail Sales stronger than expected
Americans got out there and answered that shopping call overnight, as US Retail Sales for August surprised to the upside, climbing 0.70% versus an expected fall of -0.70%. Markets ignored the 0.70% adjustment to the July numbers concentrating on the August headline and the steep climb of the Philadelphia Fed Manufacturing Index to 30.7. And, admittedly, all of the regional manufacturing indexes have outperformed this week.
Of course, retail sales do not encompass the leisure side of the consumer equation, where the delta variant has probably wrought havoc. But in a week where sentiment has flip-flopped on a daily basis, that mattered not. The Fed taper was front and centre once again, with equities finishing mixed, the US dollar rallying powerfully and US yields creeping higher. Next week’s FOMC is the key inflection point for the taper trade now. Markets will be looking for a signal that the November meeting will be live for the announcement of the taper.
I am still not ruling out a taper-tantrum, as having got the world addicted to bottomless amounts of zero per cent money, the world’s central banks will struggle to put that genie back in the bottle. Notably, Asia’s monetary policy is still in life-support mode and totally out of sync with the US, and to a lesser extent, Europe. Most importantly, nobody seems to be considering the possibility of a taper-tantrum, a warning signal it could happen if any. Q4 could be a torrid one for Asian currencies.
We do have conflicting signals internationally though. Iron ore tanked again last night and has nearly halved in price since the start of August. Amazingly, the Australian resources sector equity prices have yet to link on that, perhaps illustrating the power of the global QE money wave. Recent data out of China, regional Asia and even the US has been softer on the consumer side, even as Manufacturing PPIs continue climbing skyward, as do input costs. Stagflation is starting to be mentioned more widely, but I don’t believe this is a done deal.
In Asia, China property giant Evergrande’s shares, and bonds have tumbled once again today. With USD 300 billion in debts, a collapse by Evergrande might be enough to even stay the Fed’s hand, such are the wider shockwaves it would cause. I continue to believe that China will engineer some sort of bailout with the mother of all debt/equity swaps occurring. The fallout if the wider property sector, along with the ongoing regulatory interventions across a swath of China industries will keep China equities on the back foot. China injected a net CNY 90 billion through the repo market today. Ostensibly ahead of the China holidays next week, but no doubt, also to calm nerves. Evergrande appears to be reaching an endgame and readers should watch weekend developments closely.
Singapore’s Non-Oil Exports has disappointed today, falling by 3.60% MoM in August, led by falls in Pharmaceuticals. Electronics held up though, and admittedly, the data is a volatile series. Concerns that Singapore’s recovery might be slowing, a club that seems to get bigger by the week, is weighing on local equities, offsetting any positivity from the announcement of a governmental package to encourage Singapore unicorns to list on the SGX, instead of seeking the IPO riches of Wall Street.
The data calendar is now empty in Asia today with Eurozone Inflation and Core Inflation data to come this afternoon. The ECB denied a story circulating overnight that its models indicated its 2.0% inflation target would be reached in 2025. That caused a flurry in European fixed interest markets, but I don’t know why; three years may as well be a lifetime these days. While taking three years to reach 2.0% inflation would probably impress the Japanese, I doubt it would anybody else. It is perhaps a measure of how much Eurozone sovereign debt they have monetised. Italy and Greece being able to raise money near zero per cent never sat right with me.
Next week will be dominated by global central bank decisions, headlined by the Federal Reserve, but also including the likes of Norway, Japan, the UK, and Switzerland. EM heavyweights Brazil, South Africa and Turkey also announce policy decisions and the list is by no means exhaustive. The FOMC will be the one ring to rule them all of course, but don’t rule out hikes from Norway, Brazil and possibly South Africa and Turkey. Asia markets will be heavily distorted by national holidays. Regional heavyweights, mainland China, Hong Kong, Japan, and South Korea are all pencilling in a couple of days holiday across the week next week. That will reduce liquidity substantially in Asian markets and if Evergrande finally goes down next week, that could exacerbate any reactions in asset markets. Canada also slips in a federal election on Monday which could see some sharp moves in USD/CAD in Asia on Tuesday where liquidity is never overly special.
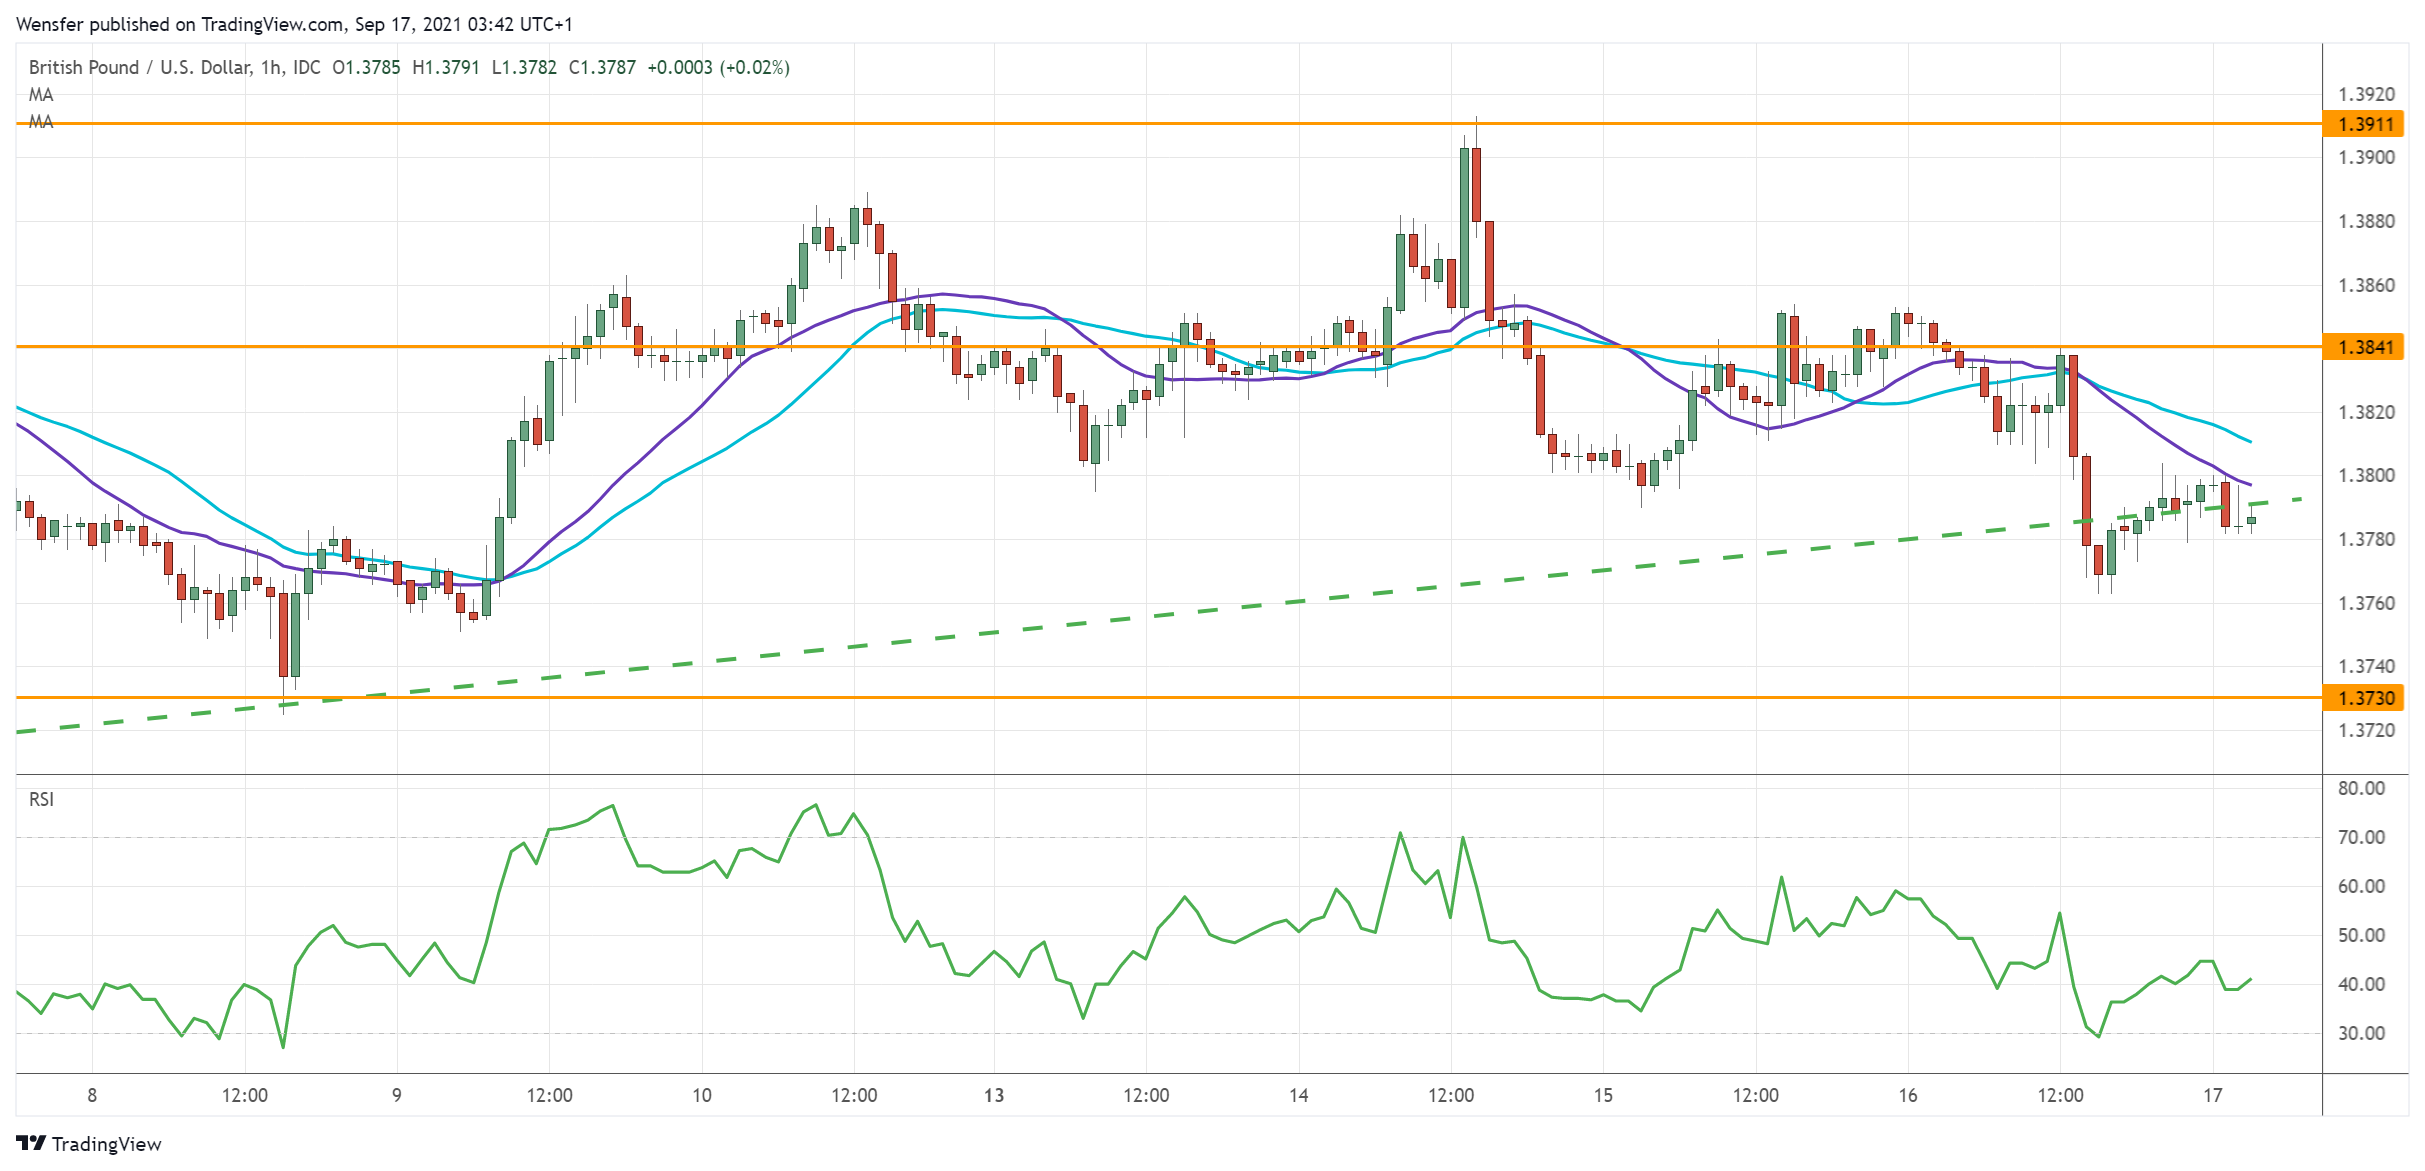
GBP/USD Falls Through Trendline
The US dollar’s rally across the board puts the sterling on the defense.
The pair has been climbing along a rising trendline. Then it met stiff selling pressure in the daily supply zone near 1.3900. An initial fall below 1.3800 indicated a lack of conviction in the rebound after a repeatedly overbought RSI.
The invalidation of the trendline would turn sentiment upside down with buyers cashing in.
1.3730 is the next support as the firesale gains traction. On the upside, the bulls will need to lift 1.3840 before they could hope for a bounce.
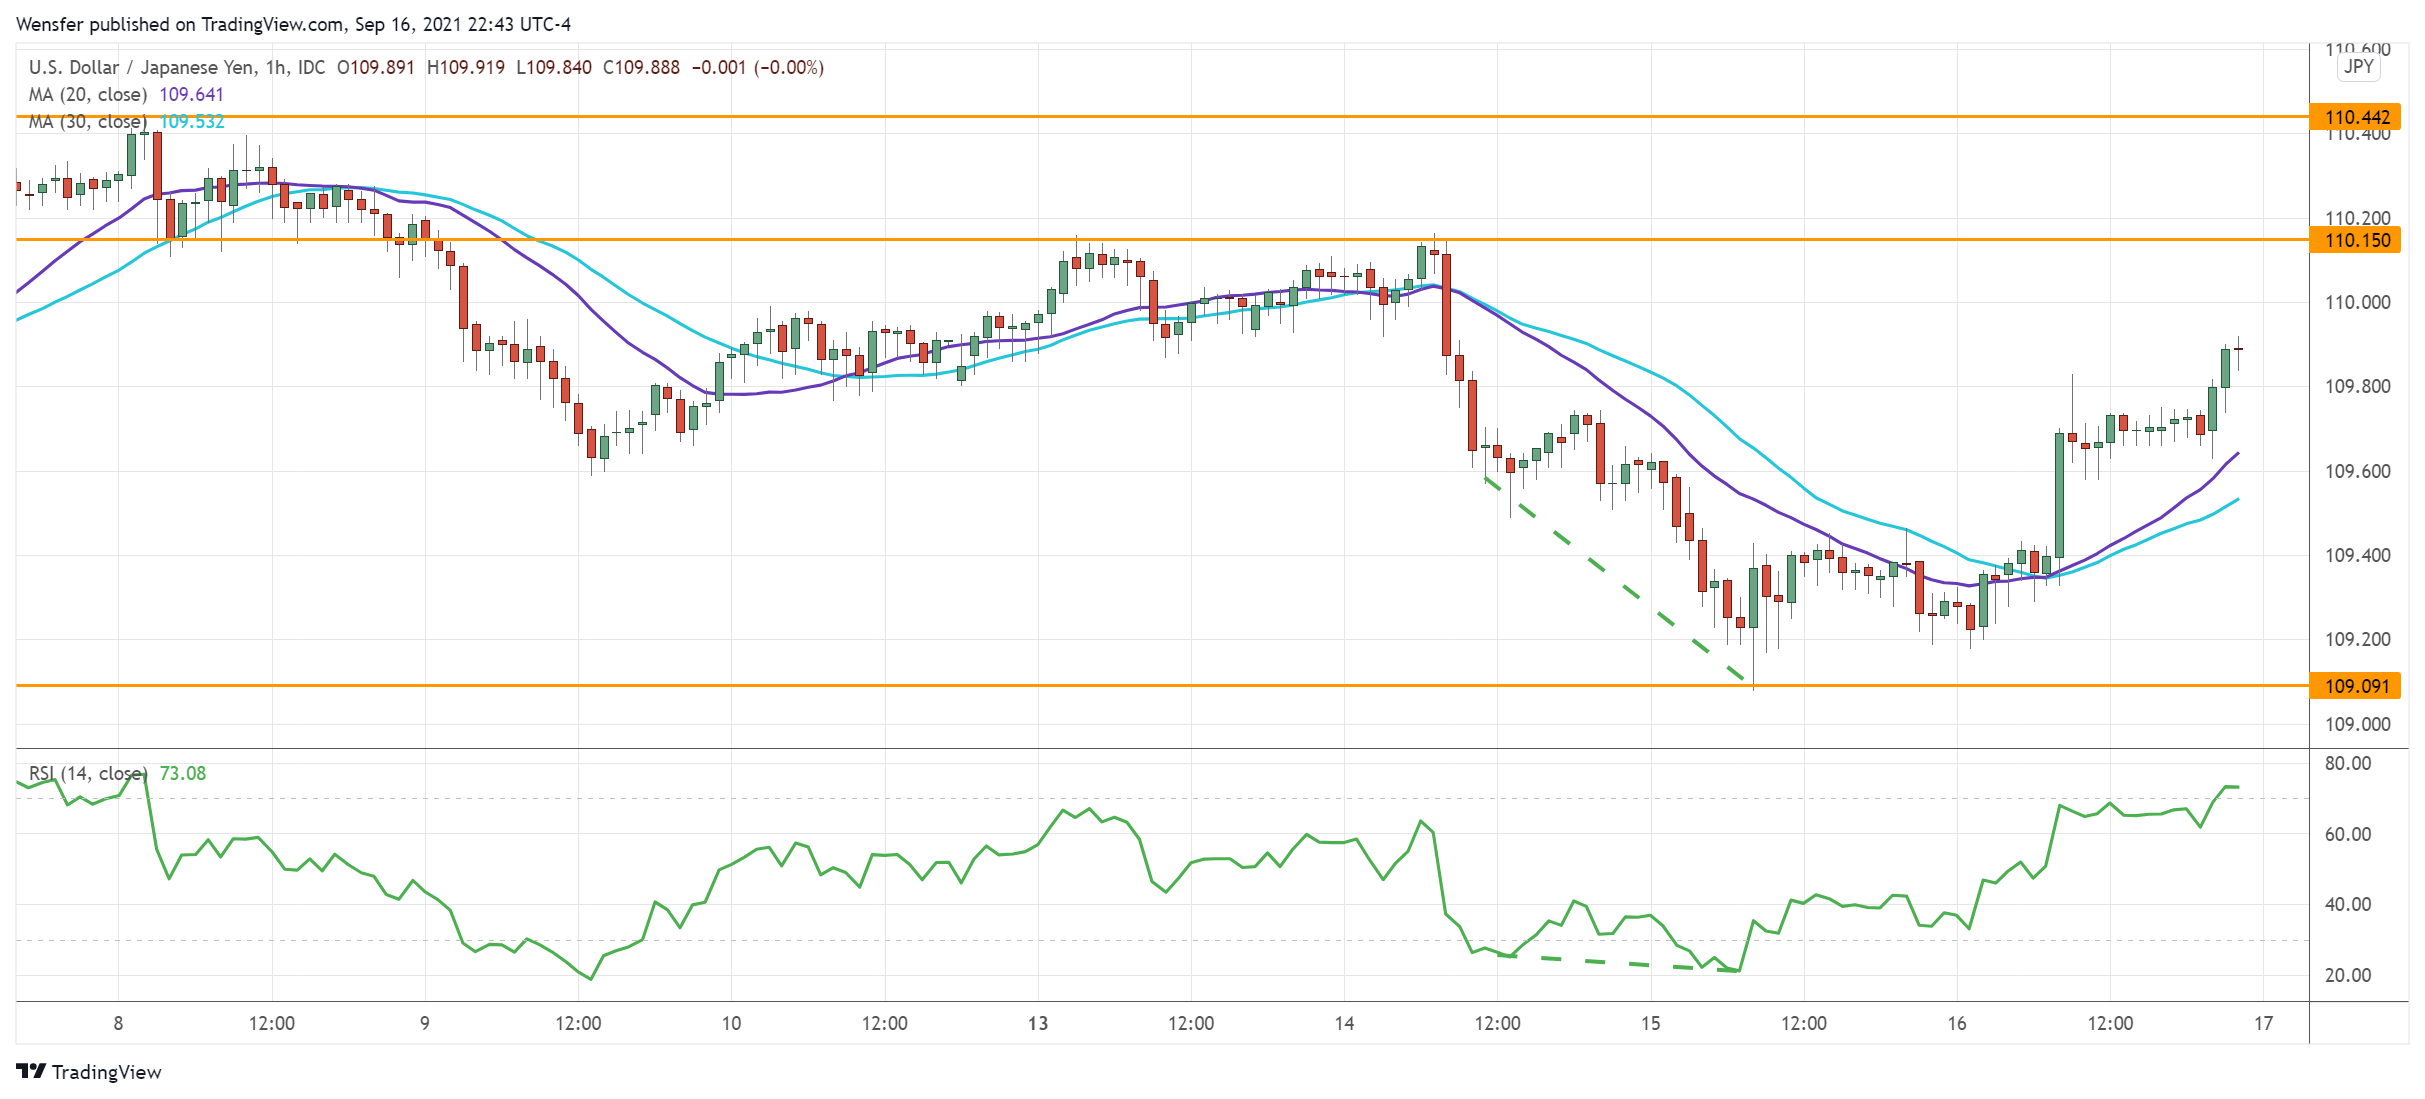
USD/JPY Bounces Off Daily Support
The US dollar surged after August’s upbeat retail sales took the market by surprise.
The greenback was bid up by a buying-the-dips crowd on the daily support (109.10) when the RSI showed an oversold situation. The indicator’s bullish divergence pointed to a loss in the sell-off momentum.
The break above the immediate resistance at 109.75 would prompt sellers to cover their positions. 110.15 is a key hurdle ahead and a bullish breakout may raise volatility and jump-start a new round of rally in the dollar.
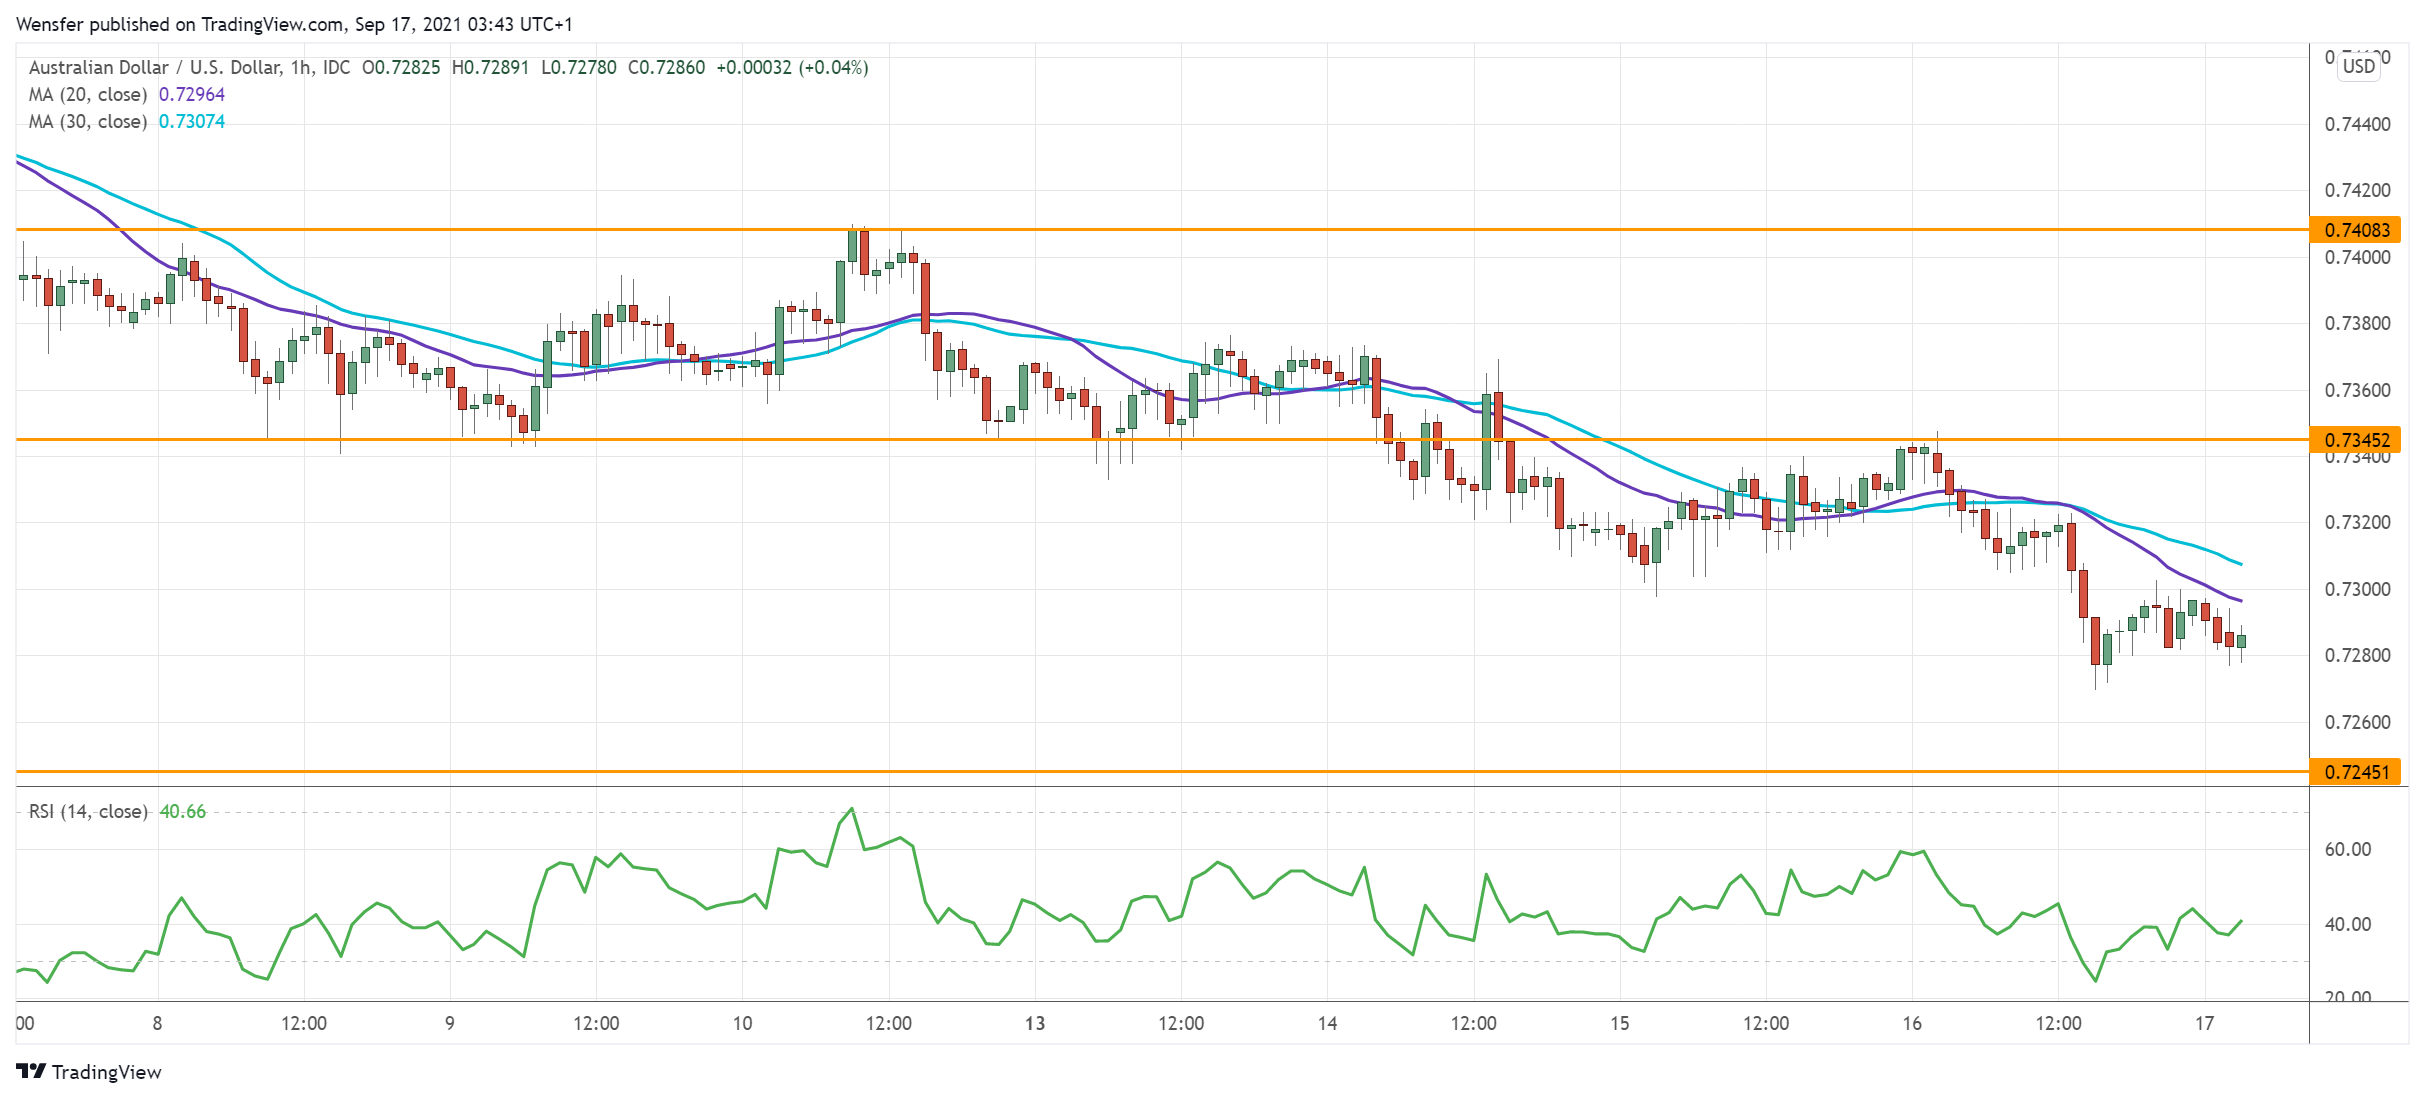
AUD/USD Struggles For Support
The Australian dollar softens as lockdowns led to sharp job losses in August.
The pair has struggled to hold on to gains after 0.7400. Traders are testing supports as the initial surge fades.
A break below 0.7310 is a sign of weak buying interest. Then a breach below 0.7290 would lead to a test of 0.7245 which happens to be the 61.8% Fibonacci retracement level from the daily chart.
The resistance could cap a rebound at 0.7345 and rather be an opportunity to sell into strength.
Gold And Silver Looking Into The Abyss
Strong US data revived bets on an imminent QE rollback from the Fed, supporting the dollar and causing bond yields to rise. The news triggered a more than 2% plunge in gold prices, four times the amplitude of the dollar’s rise against a basket of major currencies.
Silver plunged from levels near $24 at one point to $22.6, more than 5.5%, at the lower end of its trading range since last July. Despite the larger drop from the peak (-23%), Silver has been moving sideways all this time, fluctuating widely between $29 and $23.
Gold’s pullback from the highs is less intense in percentage terms (only 15%), but a downtrend has formed on the chart here with a sequence of lower peaks as the bears take control from ever lower levels.
The downtrend in Gold is supporting by solid US data pushing the moment of the Fed’s key rate hike ever closer.
Fundamentally, the current situation replicates 2014 when the FOMC was similarly on the verge of winding down balance sheet purchases. By the first public hints of Fed plans in April 2013, Gold had already sold off for six months. Subsequently, the price of Gold fell for another two and a half years, right up to the date of the Fed’s key rate hike.
Learning from the only historical example, the downtrend in Gold could continue for another year or so, based on the current rate projections. Potentially, it may come under the most fierce selling pressure during a period of reduced asset purchases for the Fed’s balance sheet.
From current levels near $1760/oz, gold investors should look to the price dynamic near the $1700 area, which has acted as support since February. A bull’s capitulation from these levels promises to pave the way for a rapid decline towards $1500.
For Silver, a sustained drop below $23 could mean a move into active selling, returning the price to the previous consolidation area around $15 before the end of the year, half the peak of February.
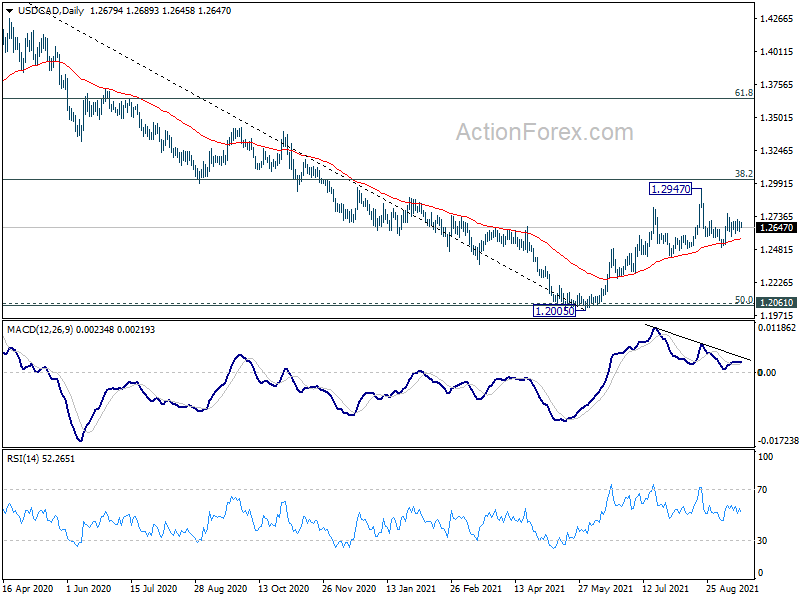
USD/CAD Daily Outlook
Daily Pivots: (S1) 1.2634; (P) 1.2667; (R1) 1.2717; More...
Intraday bias in USD/CAD remains neutral first. Rise from 1.2005 is in progress with 1.2421 support intact. On the upside, break of 1.2760 will target a test on 1.2947 high. However, break of 1.2492 will resume the fall from 1.2947 to 1.2421 key structural support.
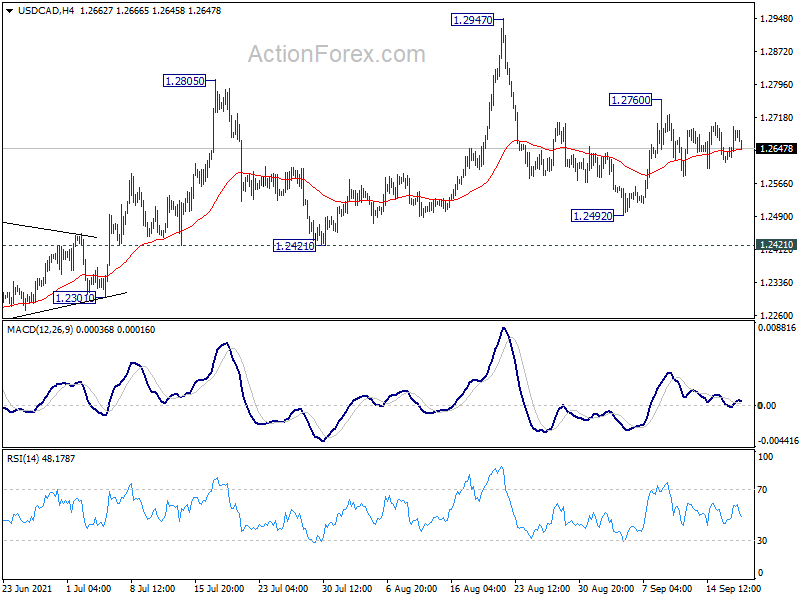
In the bigger picture, fall from 1.4667 is seen as the third leg of the corrective pattern from 1.4689 (2016 high). It should have completed after hitting 1.2061 (2017 low) and 50% retracement of 0.9406 to 1.4689 at 1.2048. Sustained break of 38.2% retracement of 1.4667 to 1.2005 at 1.3022 will pave the way to 61.8% retracement at 1.3650 and above. Overall, medium term outlook remains neutral at worst with 1.2048/61 support zone intact.