Sample Category Title
Investors Awaiting Inflation Data In Europe
Despite a slight increase in initial jobless claims, strong US retail sales data strengthened the dollar index and gave even more reason to believe that the Federal Reserve will announce the start of QE program cuts at its meeting on September 22. The US stock market ended Thursday's trading without a single dynamic. At the closing time of the stock exchange, the Dow Jones index decreased by 0.18%, the S&P 500 lost 0.15%, and the NASDAQ added 0.13%. The technological sector became the growth leader, while the negative dynamics were demonstrated by the oil, gas, and utility sectors.
European stock indices were up yesterday at the end of the day. British FTSE 100 and German DAX added 0.2% each, French CAC 40 increased by 0.6%, Spanish IBEX 35 and Italian FTSE MIB added 1.1% and 0.8% respectively. Yesterday, ECB head Christine Lagarde said that Europe is recovering faster than originally expected. But analysts are looking at the situation from a slightly different angle. Europe is already facing its worst natural gas crisis in decades, with prices climbing to record levels before winter. Goldman Sachs warned that skyrocketing commodity prices will put heavy industry across Europe at risk of power outages this winter, especially if frosts in Europe are delayed. Europe will report on inflation today. A surge in inflation may provoke the ECB to start cutting stimulus as soon as the next meeting.
Global GDP may grow by +5.3% in 2021 due to "radical" policy measures and successful vaccine introductions in advanced economies. But next year's growth is likely to slow to +3.6%.
Precious metals prices have decreased. Gold fell by nearly 3% on Thursday, and silver lost 5% on the back of a stronger dollar index and US Treasury yields. Unless any geopolitical event occurs, the trajectory of gold and silver is unlikely to change before the FOMC meeting.
Oil is slightly down as US supplies affected by the hurricane are slowly getting back. On the other hand, oil is in a bullish trend and the upward trend in fuel prices is likely to continue because supply is seriously lagging far behind demand.
Asian tech stocks increased for the first time this week. Chinese stocks were mixed on the back of the China Evergrande Group debt crisis and the central bank's short-term cash infusion. Hong Kong's Hang Seng index increased by 0.23% after recording its lowest close in 10 months the day before. Australia's ASX 200 index decreased by 0.8% as falling iron ore prices hurt mining companies. Chinese blue chips (CSI 300) increased by 0.58%, and Japan's Nikkei 225 index increased by 0.62%, returning to a 31-year high reached on Monday.
Main market quotes:
- S&P 500 (F) 4,473.75 −6.95 (−0.16%)
- Dow Jones 34,751.32 −63.07 (−0.18%)
- DAX 15,651.75 +35.75 (+0.23%)
- FTSE 100 7,027.48 +10.99 (+0.16%)
- USD Index 92.84 +0.30 (+0.32%)
Important events for today:
- UK Retail Sales (m/m) at 09:00 (GMT+3);
- Eurozone Consumer Price Index (m/m) at 12:00 (GMT+3);
- US Michigan Consumer Sentiment (m/m) at 17:00 (GMT+3).
Eurozone CPI finalized at 3% yoy in Aug, EU at 3.2% yoy
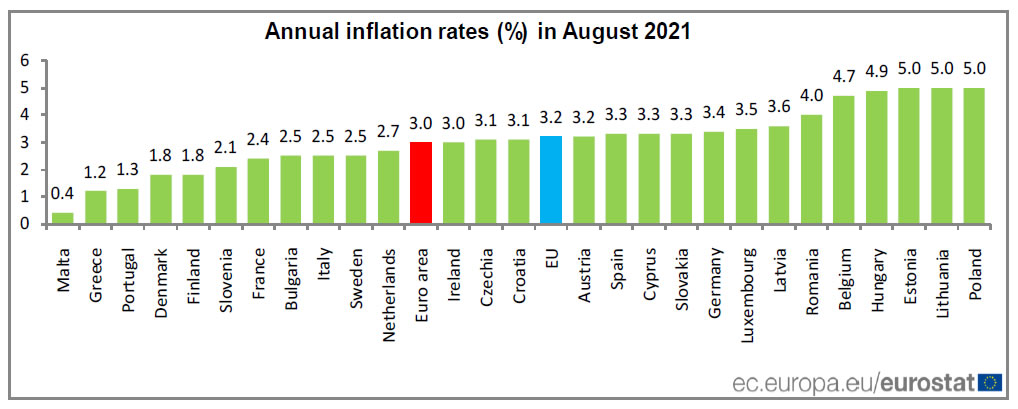
Eurozone CPI was finalized at 3.0% yoy in August, up from July's 2.2% yoy. The highest contribution to the annual euro area inflation rate came from energy (+1.44%), followed by non-energy industrial goods (+0.65%) and food, alcohol & tobacco and services (both +0.43%).
EU CPI was finalized at 3.2% yoy, up from July's 2.5% yoy. The lowest annual rates were registered in Malta (0.4%), Greece (1.2%) and Portugal (1.3%). The highest annual rates were recorded in Estonia, Lithuania and Poland (all 5.0%). Compared with July, annual inflation remained stable in one Member State and rose in twenty-six.
Oil Consolidates, Gold Slides
Oil maintains its gains
Oil managed to hold onto all its recent gains overnight, despite a surge by the US dollar, courtesy of a higher than expected Retail Sales report. Sky-high natural gas prices and 40% of the US Gulf of Mexico oil industry still being offline post-Ida continues to support prices. Brent crude rose just 0.15% to USD 75.60, and WTI was almost unchanged at USD 72.50 a barrel. Both remain around those levels in a quiet Asian session today. With natural gas prices continuing to rise, substituting oil for power and heating generation will become more appealing and that should continue to support prices, even at these levels.
Brent crude has resistance nearby at USD 76.00 and if that gives way, Brent crude should target the USD 78.00 a barrel area. Support remains at USD 74.00 a barrel, with failure signalling a deeper retreat to the USD 72.00 region. WTI has support at USD 71.00 a barrel while resistance remains just above at USD 73.00 a barrel, followed by USD 74.00 and USD 76.00 a barrel.
Gold finally collapses overnight
Gold prices finally collapsed overnight after the surge in US Retail Sales saw a strong rally by the US dollar. Gold fell by 2.25% to USD 1753.50 an ounce, a 40 dollar loss for the session. Support held at USD 1750.00, and some shot covering has lifted the metal by 0.40% to USD 1760.00 an ounce in Asia, but gold remains on fragile ground.
Gold faces another test of USD 1750.00 if the US dollar remains firm today. It is clear a lot of speculative long positioning was culled overnight, and the question is, how much is still out there. Looking at the price action overnight, I would say quite a lot.
If support at USD 1750.00 fails, gold could target the USD 1715.00 area, potentially testing longer-term support around USD 1675.00 an ounce. Gold’s nearest resistance is now the overnight breakout point at USD 1780.00 an ounce.
Dollar Jumps On US Retail Sales
US retail sales give US dollar a taper boost
The US dollar roared back to life overnight as the much higher retail sales data put the Fed taper back in the centre of attention. The dollar index rose 0.42% to 92.87 before edging lower in Asia to 92.84. Unless European inflation data contains a mighty upside surprise, it is hard to see the US dollar retreating far, and a test of resistance at 93.00 and 93.20 looks most likely.
EUR/USD fell 0.40% overnight to 1.1770 where it remains in Asia. Having tested 1.1750 overnight, this is initial support today with rallies likely limited to 1.1800. GBP/USD has fallen to 1.3800 and has support at 1.3760, while resistance is not formidable at 1.3900 after multiple failures. The highly correlated to risk sentiment AUD and NZD retreated overnight. AUD/USD is hovering at support at 0.7300 this morning, while NZD/USD is just shy of support at 0.7070. If Fed tapering nerves continue into the New York session – not a given after a flip-flop week- both Antipodeans could potentially fall another 70-100 points into the close of business.
Unsurprisingly, regional Asian currencies fell heavily versus the US dollar overnight, with Asia perhaps the most sensitive region on the planet to the prospects of a Fed taper starting at the end of the year. The Korean won has tumbled by nearly 1.0% over the past 24 hours to 1178.00 this morning, the taper-nerves exacerbated by a tough couple of days on the North Korean front. A further rise towards 1185.00 is likely to bring the Bank of Korea out to sell dollars. USD/MYR also broke higher overnight to 4.1700, clearing previous resistance at 4.1600 easily. It now targets further moves higher to 4.2000. USD/CNY fell to 6.4300 overnight before sharply reversing higher to 6.4500 after the PBOC set a neutral fix at 6.4527. It seems that with public holidays next week, and golden week at the start of October, the PBOC is determined to mute any tapering, Evergrande or policy-induced volatility in the currency.
The Analytical Overview Of The Main Currency Pairs
The EUR/USD currency pair
Technical indicators of the currency pair:
Prev Open: 1.1814
Prev Close: 1.1768
% chg. over the last day: -0.39%
Yesterday, ECB head Christine Lagarde said that Europe is recovering faster than initially expected. That is a good sign for the European currency to strengthen, but traders should not forget that the American dollar is also strengthening, which leads to a decrease in the EUR/USD quotes.
Trading recommendations
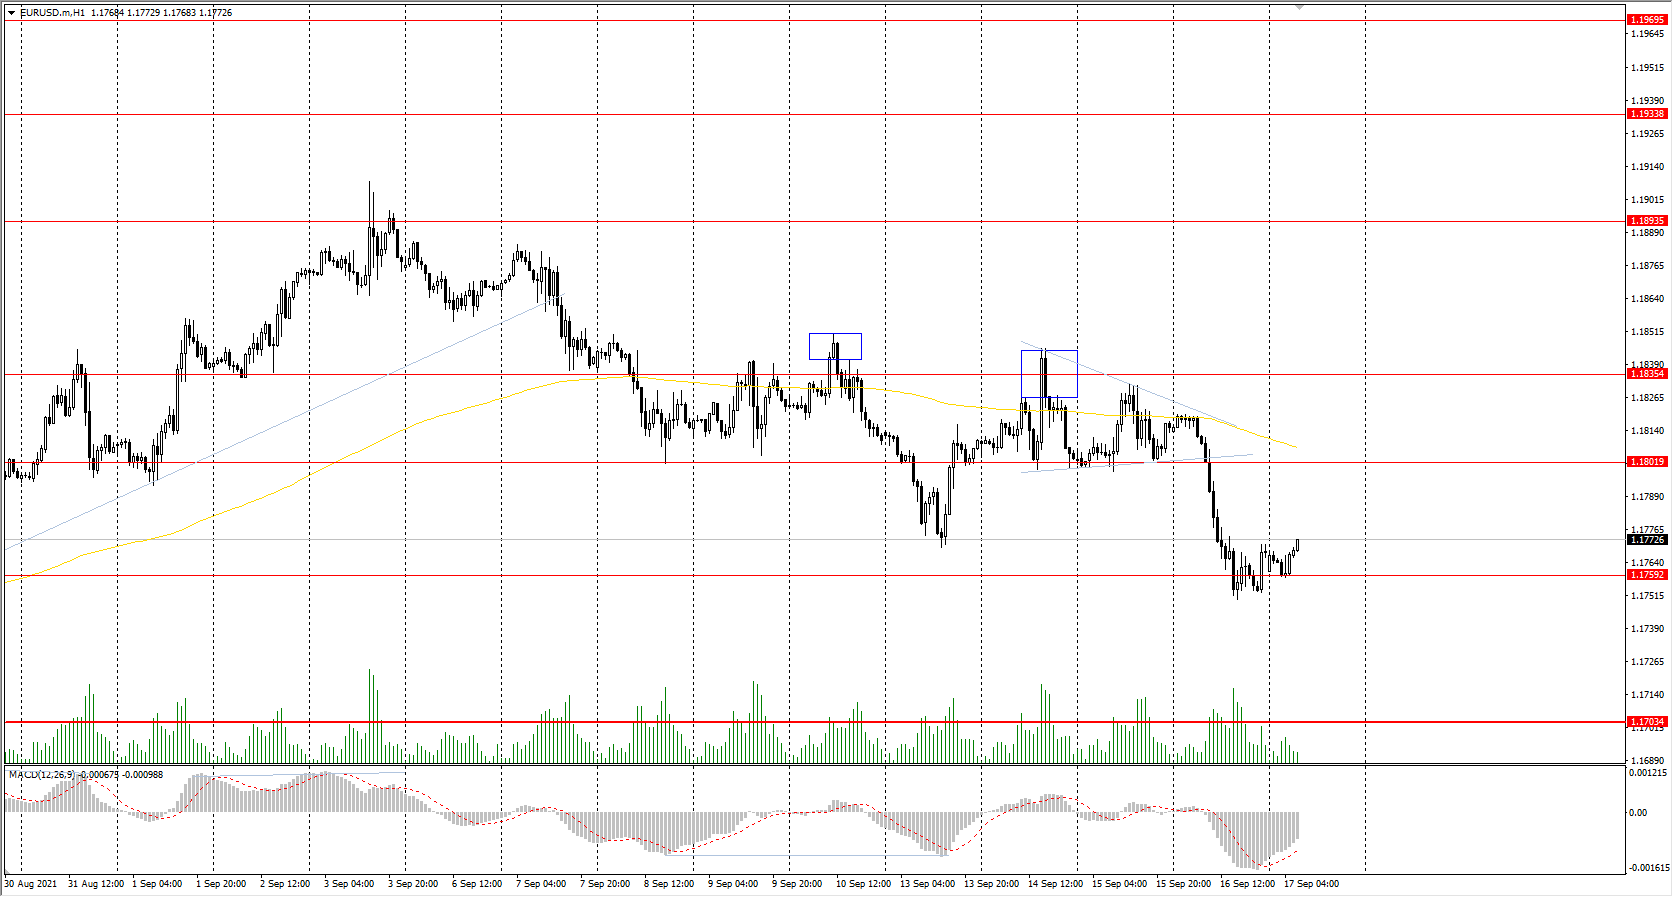
Support levels: 1.1759, 1.1704, 1.1620
Resistance levels: 1.1802, 1.1835, 1.1894, 1.1934, 1.1969
From the technical point of view, the general trend on the EUR/USD currency pair is bullish. But the selling pressure is increasing. Yesterday's liquidity narrowing in the form of a triangle ended with an impulsive downward move. Under such market conditions, buy trades can be considered from the support levels, after a new buyers initiative. It is better to look for sell trades throughout the day from the resistance level in the area of the broken triangle.
Alternative scenario: if the price breaks through the 1.1704 support level and fixes below, the mid-term uptrend will likely be broken.
News feed for 2021.09.17:
- Eurozone Consumer Price Index (m/m) at 12:00 (GMT+3);
- US Michigan Consumer Sentiment (m/m) at 17:00 (GMT+3).
The GBP/USD currency pair
Technical indicators of the currency pair:
Prev Open: 1.3839
Prev Close: 1.3787
% chg. over the last day: -0.38%
Record energy prices have forced the closure of two fertilizer factories in the north of England and stopped steel plants, which is one of the clear signs that the energy crisis that covers Europe can be a blow to restore Great Britain's economy.
Trading recommendations
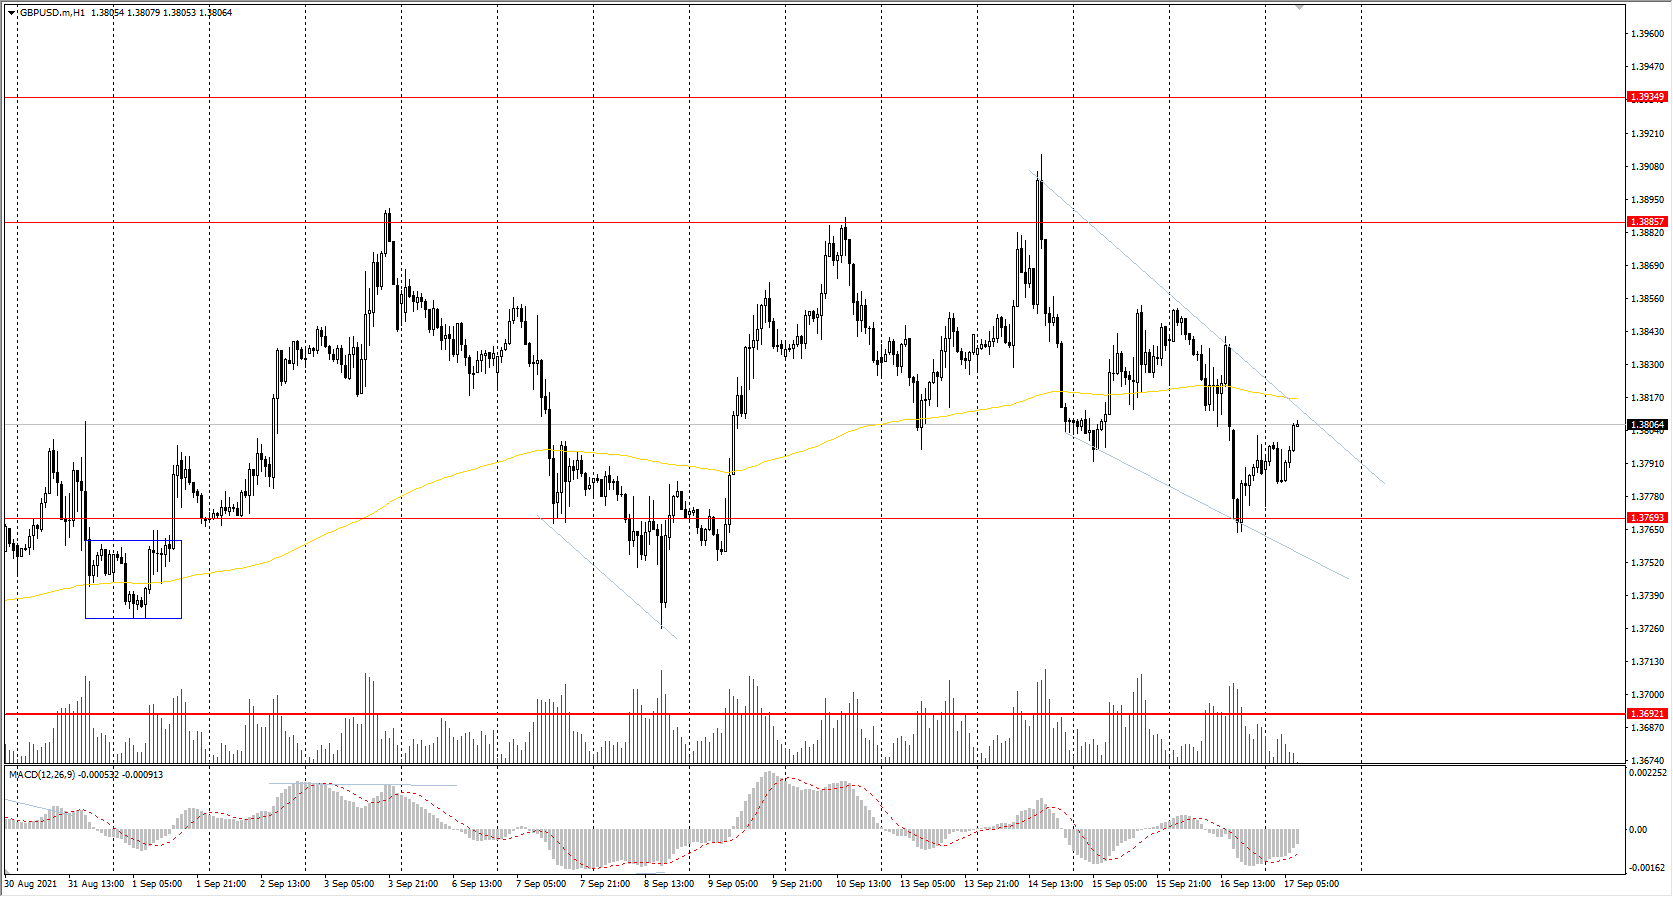
Support levels: 1.3769, 1.3692, 1.3632, 1.3614, 1.3525
Resistance levels: 1.3886, 1.3935, 1.4002
On the hourly time frame, the GBP/USD trend is bullish. But amid the strengthening of the dollar index, the GBP/USD currency pair is under sellers' pressure. The MACD indicator has become negative, but there are signs of pressure from the buyers. Under such market conditions, it is better to look for buy trades from the support levels where the buyers show initiative. Sell positions can be considered from the resistance levels with short targets throughout the day.
Alternative scenario: if the price breaks through the 1.3692 support level and consolidates below, the bearish scenario will likely resume.
News feed for 2021.09.17:
- UK Retail Sales (m/m) at 09:00 (GMT+3).
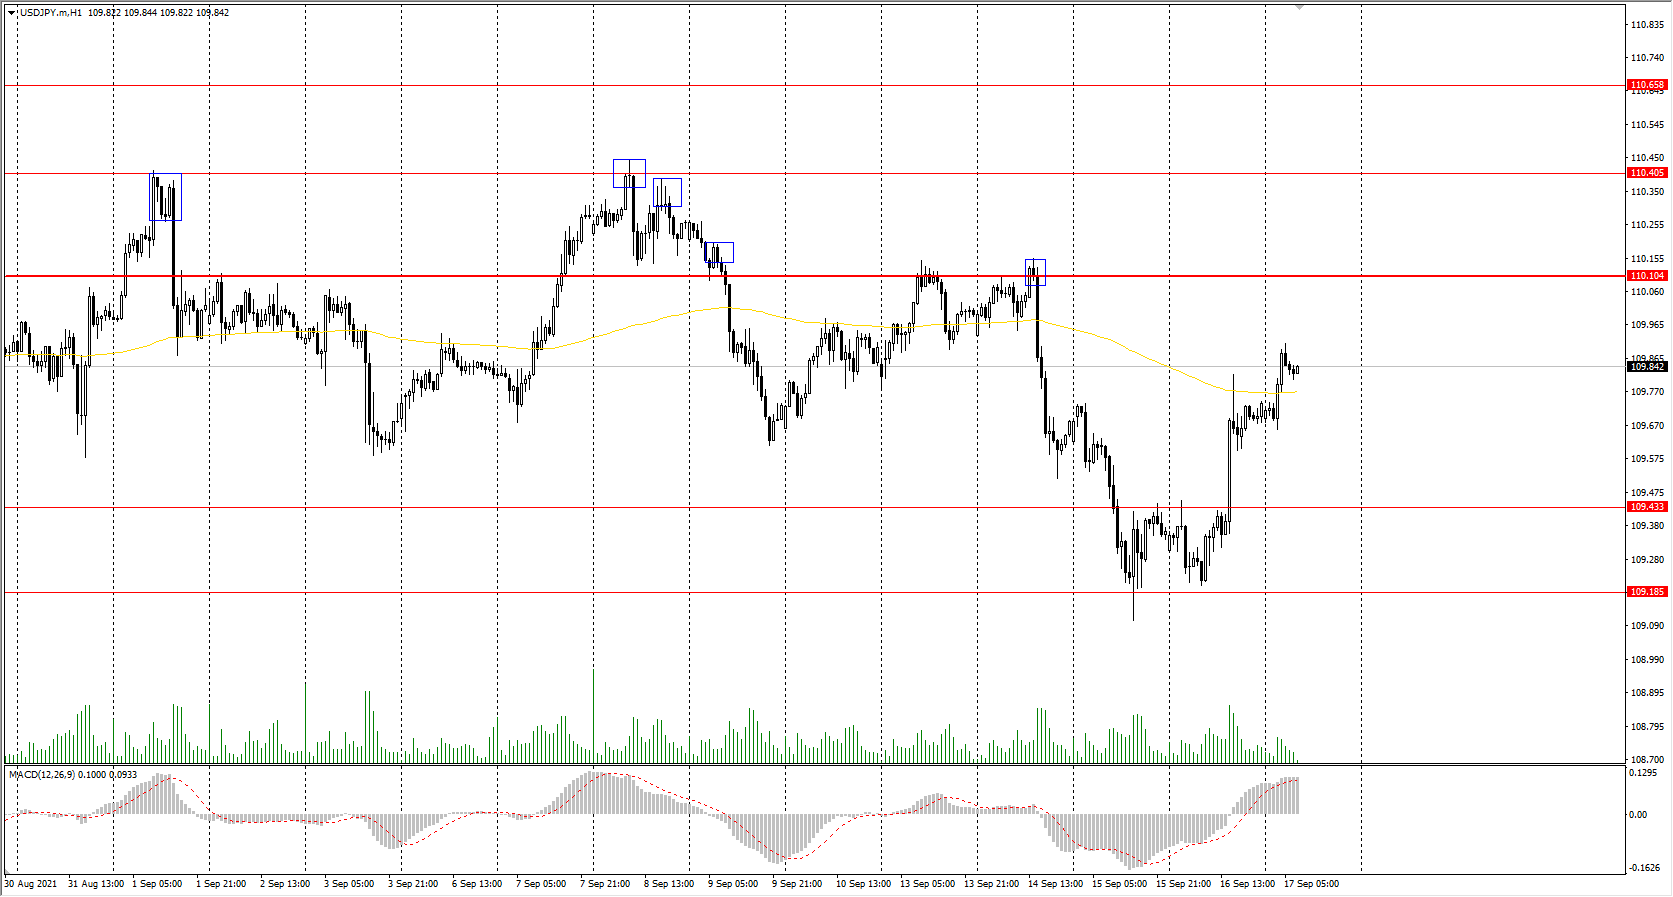
The USD/JPY currency pair
Technical indicators of the currency pair:
Prev Open: 109.31
Prev Close: 109.74
% chg. over the last day: +0.39%
Given the seasonal fluctuations, exports in Japan increased by 0.8% compared with July. Such data suggests that export growth slowed more than expected in August as the delta coronavirus outbreak affected the global trade recovery.
Trading recommendations
Support levels: 109.43, 109.19, 108.65
Resistance levels: 110.10, 110.40, 110.66, 110.95, 111.48
The main trend on the USD/JPY currency pair is bearish. But amid the strengthening of the dollar index and weakness of the Japanese yen, the USD/JPY moved upward again. The MACD indicator has become positive, with no signs of reversal. Under such market conditions, traders should look for sell positions from the priority change level. Buy positions should be considered only from the support levels where the buyers show initiative throughout the day.
Alternative scenario: if the price rises above 110.10, the uptrend is likely to resume.
The USD/CAD currency pair
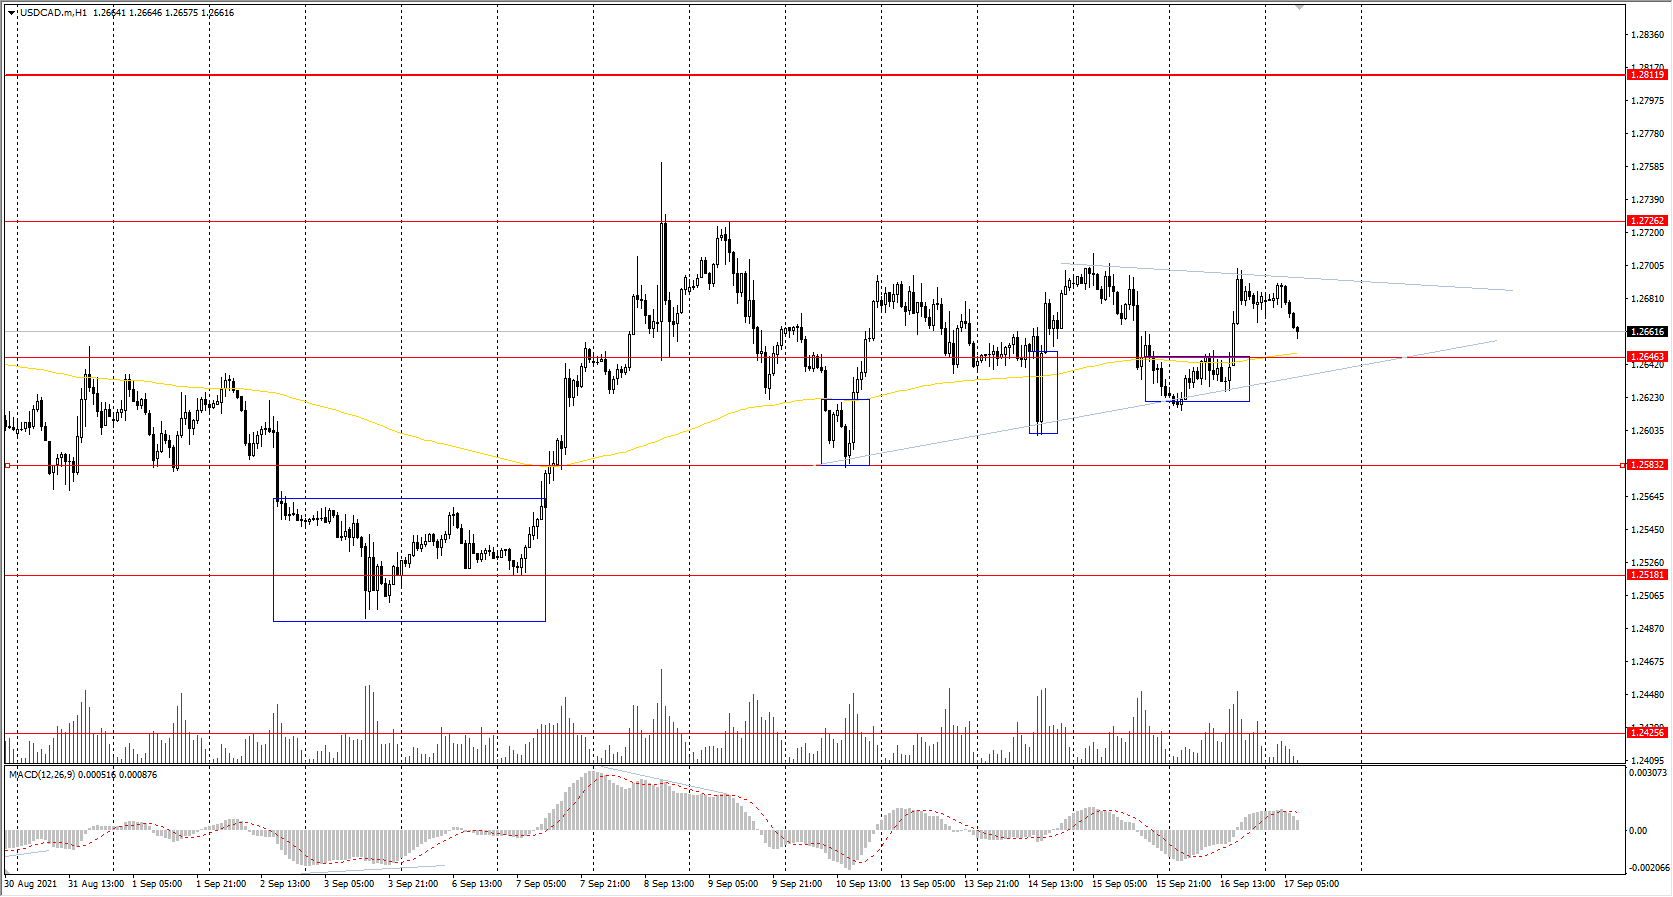
Technical indicators of the currency pair:
Prev Open: 1.2625
Prev Close: 1.2682
% chg. over the last day: +0.45%
The Canadian dollar is a commodity currency, so the USD/CAD currency pair is highly dependent on the dynamics of the dollar index and oil prices. Yesterday, the dollar index increased while oil prices remained at the same level. As a result, the price of USD/CAD goes up.
Trading recommendations
Support levels: 1.2646, 1.2583, 1.2518, 1.2425
Resistance levels: 1.2726, 1.2812, 1.2891, 1.2951
In terms of technical analysis, the trend on the USD/CAD currency pair is bearish. But due to the growth of the dollar index and oil prices, the price is trading inside the wide corridor. But weak buying pressure and some narrowing of liquidity in the form of a triangle are clearly seen now. Buy positions can be considered from the support levels where buyers show initiative, and only with short targets. It is better to look for sell positions from the resistance levels of a higher time frame.
Alternative scenario: if the price breaks through the 1.2812 resistance level and fixes above, the uptrend will likely resume.
GBP/JPY Daily Outlook
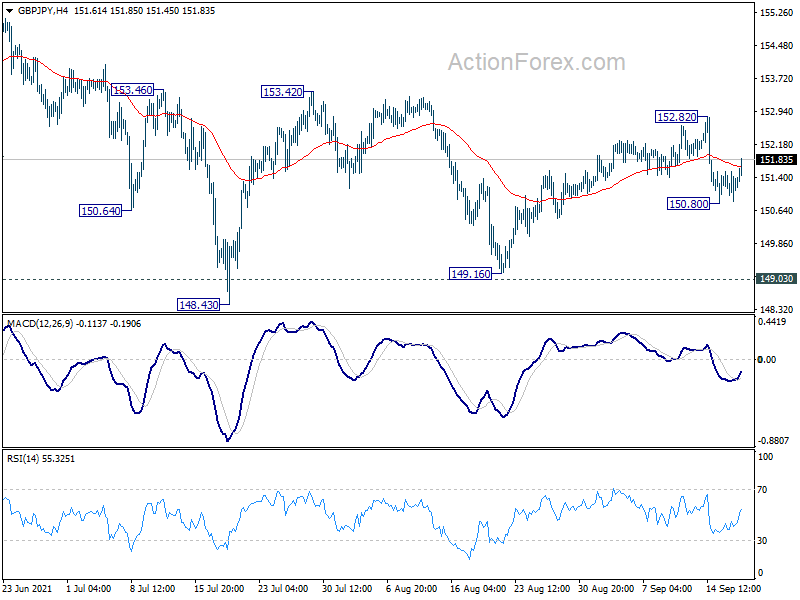
Daily Pivots: (S1) 150.98; (P) 151.27; (R1) 151.67; More...
Intraday bias in GBP/JPY is turned neutral with current recovery. On the upside, above 152.82 will target 153.42 resistance first. Firm break there will argue that whole correction from 156.05 has completed, and turn outlook bullish. On the downside, break of 150.08 will target 148.43/149.16 support zone.
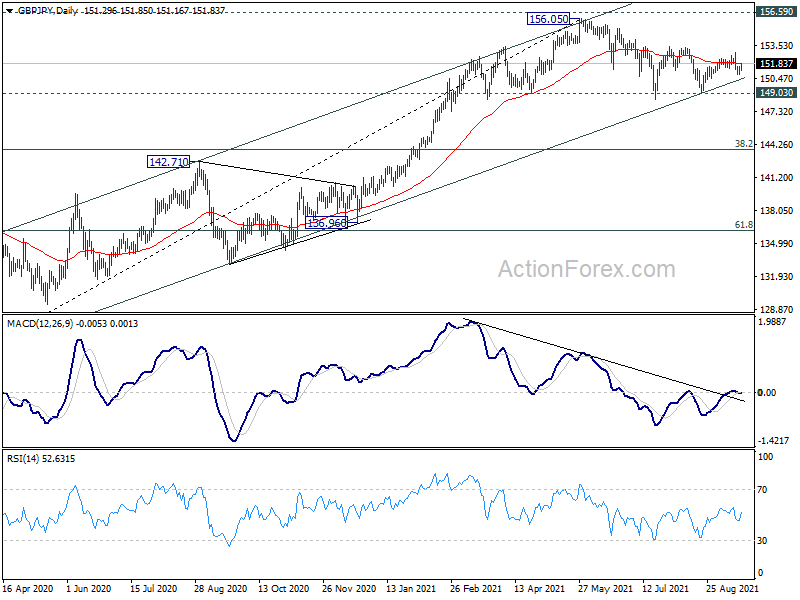
In the bigger picture, rise from 123.94 is seen as the third leg of the pattern from 122.75 (2016 low). As long as 149.03 support holds, such rise would still resume at a later stage. However, sustained break of 149.03 support will indicate rejection by 156.59. Fall from 156.05 would be at least correcting the whole rise from 123.94. Deeper fall would be seen back 38.2% retracement of 123.94 to 156.05 at 143.78 first.
EUR/JPY Daily Outlook
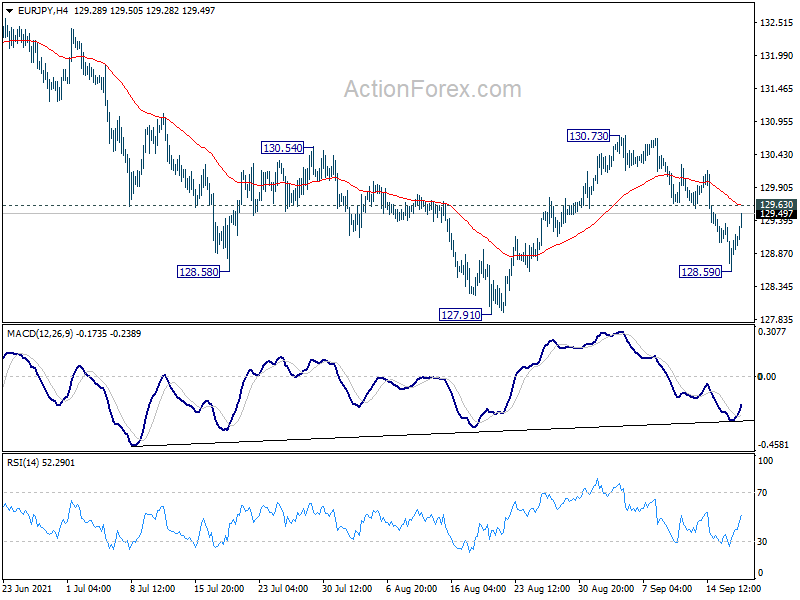
Daily Pivots: (S1) 128.72; (P) 129.04; (R1) 129.47; More....
Intraday bias in EUR/JPY is turned neutral with current recovery. On the upside, above 129.63 minor resistance will turn bias back to the upside for 130.73. Firm break there will reaffirm the case that whole correction from 134.11 has completed, and turn near term outlook bullish. On the downside, though, break of 128.59 will bring deeper fall to 127.91 support.
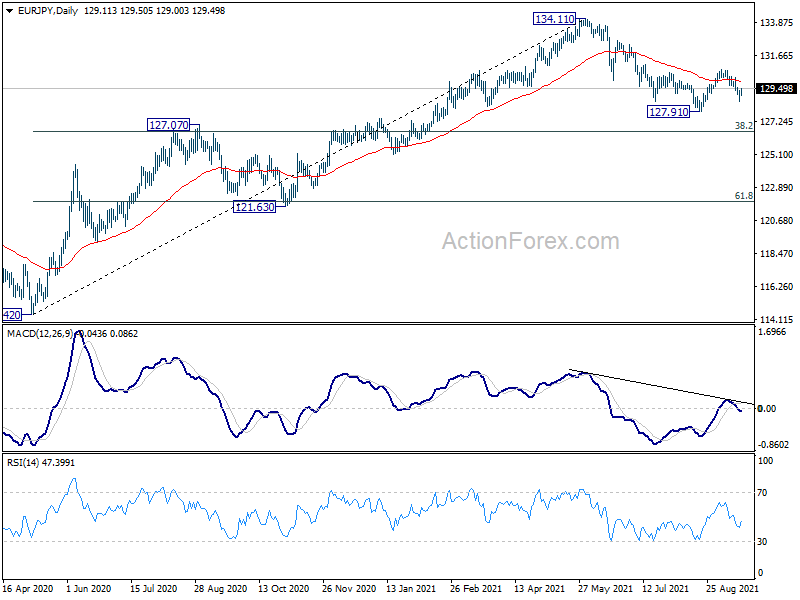
In the bigger picture, rise from 114.42 is seen as a medium term rising leg inside a long term sideway pattern. As long as 127.07 resistance turned support holds, further rise is still expected to retest 137.49 (2018 high). However, firm break of 127.07 will argue that the medium term trend has reversed, deeper fall would be seen to 61.8% retracement of 114.42 to 134.11 at 121.94.
EUR/GBP Daily Outlook
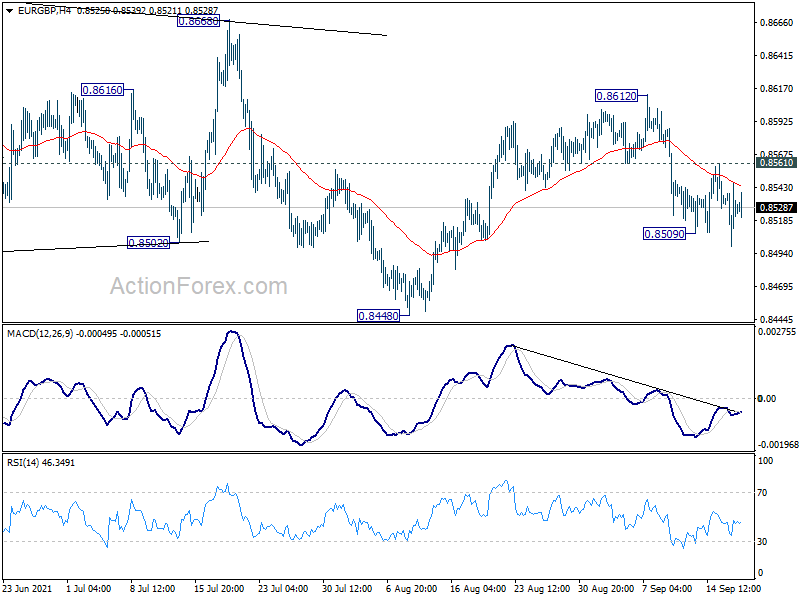
Daily Pivots: (S1) 0.8505; (P) 0.8527; (R1) 0.8552; More...
Intraday bias in EUR/GBP is back on the downside as fall from 0.8612 resumed. Deeper fall would be seen back to retest 0.8448 low. On the upside, however, break of 0.8561 minor resistance will turn bias back to the upside for 0.8612 resistance. Overall, with 0.8668 resistance intact, larger fall from 0.9499 is probably still in progress.
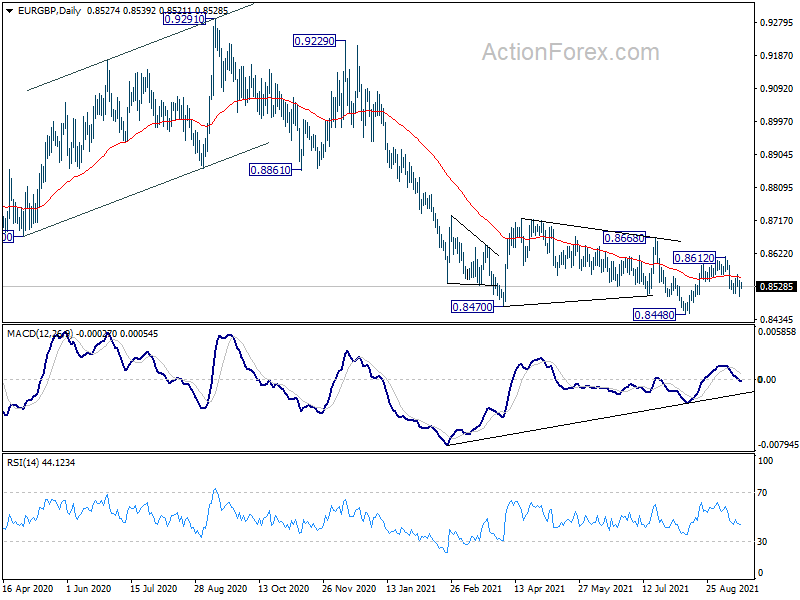
In the bigger picture, price actions from 0.9499 (2020 high) are still seen as developing into a corrective pattern. Deeper fall could be seen as long as 0.8668 resistance holds, towards long term support at 0.8276. However, firm break of 0.8668 resistance would argue that a medium term bottom was already formed. Stronger rise would be seen to 0.8861 support turned resistance to confirm completion of the corrective pattern.
EUR/AUD Daily Outlook
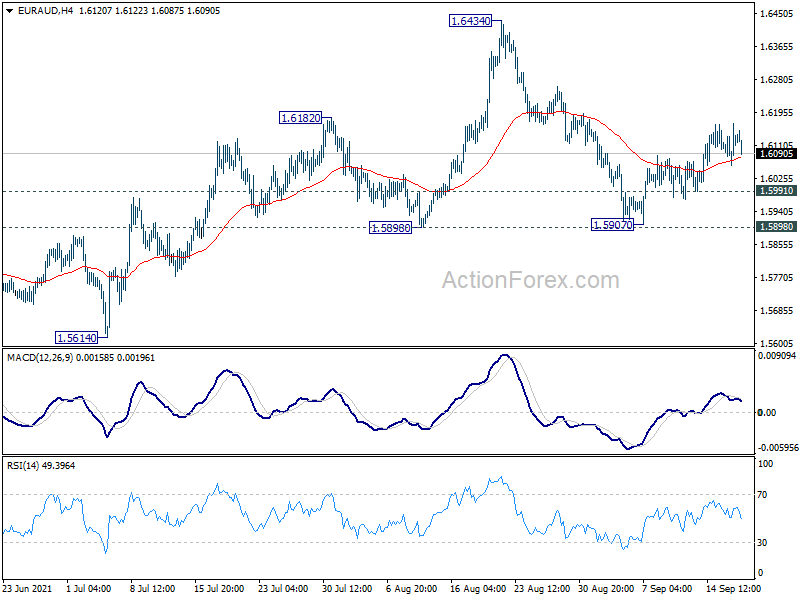
Daily Pivots: (S1) 1.6075; (P) 1.6123; (R1) 1.6183; More...
As long as 1.5991 minor support holds, further rise is still mildly in favor in EUR/AUD, for retesting 1.6434 high. Break there will resume larger rise from 1.5250. However, on the downside, below 1.5991 minor support will turn bias back to 1.5898 key structural support instead.
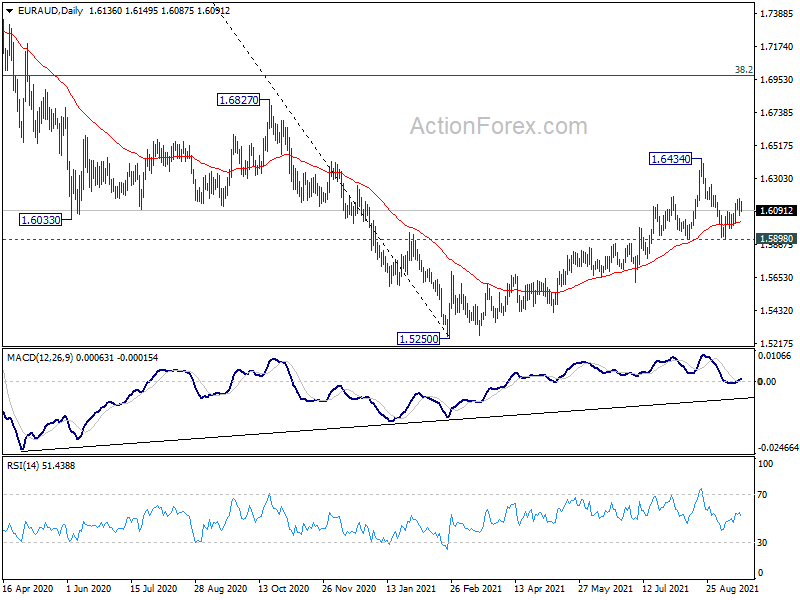
In the bigger picture, rise from 1.5250 medium term bottom is currently seen as a correction to the down trend from 1.9799 first. Stronger rise could be seen to 38.2% retracement of 1.9799 to 1.5250 at 1.6988 next. We'd tentatively expect strong resistance from there to limit upside, at least on first attempt. Meanwhile, break of 1.5898 support will indicate that the rebound has completed. Larger down trend from 1.9799 might be ready to resume through 1.5250 low.
EUR/CHF Daily Outlook
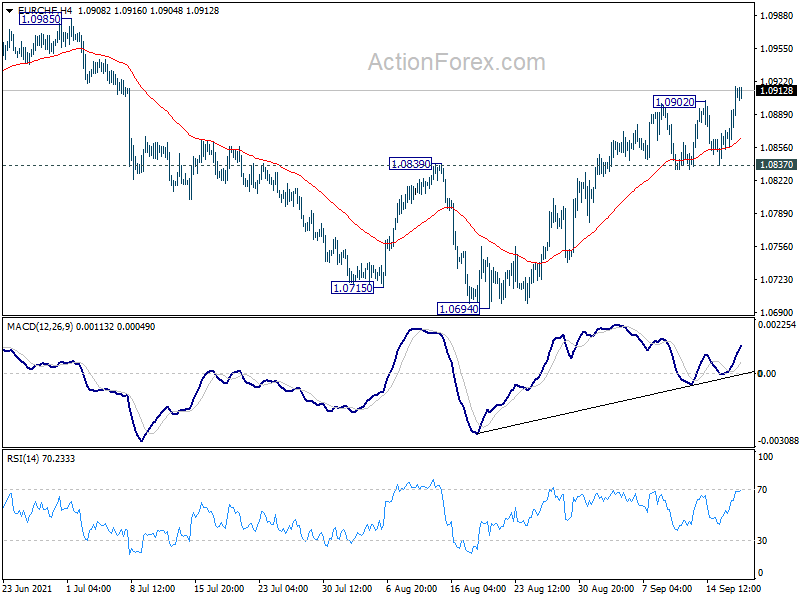
Daily Pivots: (S1) 1.0878; (P) 1.0898; (R1) 1.0938; More....
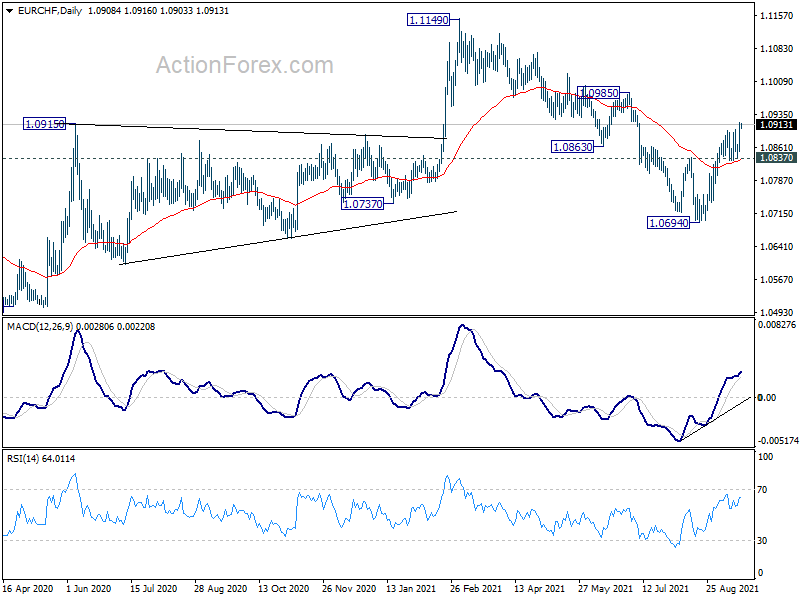
EUR/CHF's rise from 1.0694 resumed by taking out 1.0902 temporary top. Intraday bias is back on the upside for 1.0985 resistance next. On the downside, break of 1.0837 support will turn bias back to the downside for retesting 1.0694 low instead.
In the bigger picture, rebound from 1.0505 (2020 low) should have completed at 1.1149 already. The three-wave corrective structure argues that the downtrend from 1.2004 (2018 high) is not over yet. Medium term outlook will now stay bearish as long as 55 week EMA (now at 1.0858) holds. Break of 1.0505 low would be seen at a later stage. However, sustained trading above 55 week EMA will bring retest of 1.1149 high instead.