Sample Category Title
GBP/USD Daily Outlook
Daily Pivots: (S1) 1.3789; (P) 1.3815; (R1) 1.3861; More...
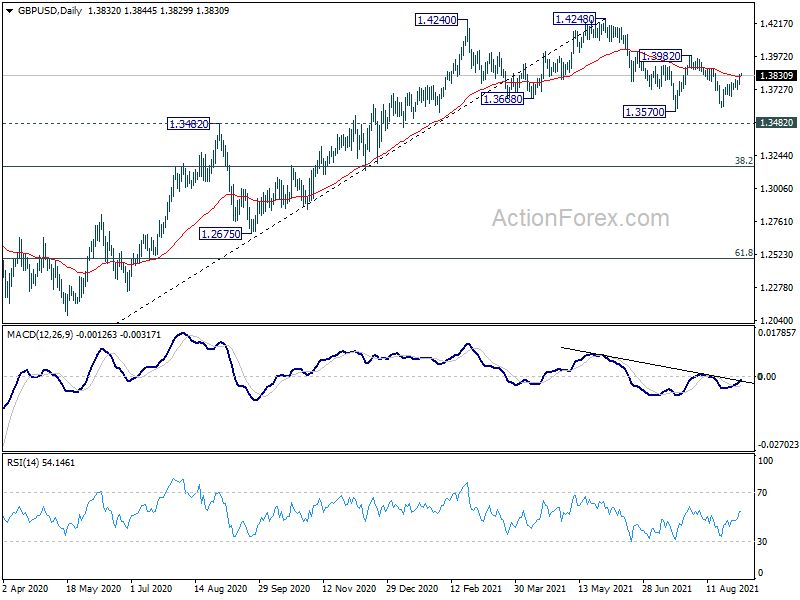
Intraday bias in GBP/USD remains on the upside for the moment. Rise from 1.3601 is in progress for 1.3982 resistance. Decisive break there will pave the way back to retest 1.4248 high. On the downside, break of 1.3730 minor support will turn bias back to the downside for 1.3570 low, and possibly further to 1.3482 key resistance turned support.
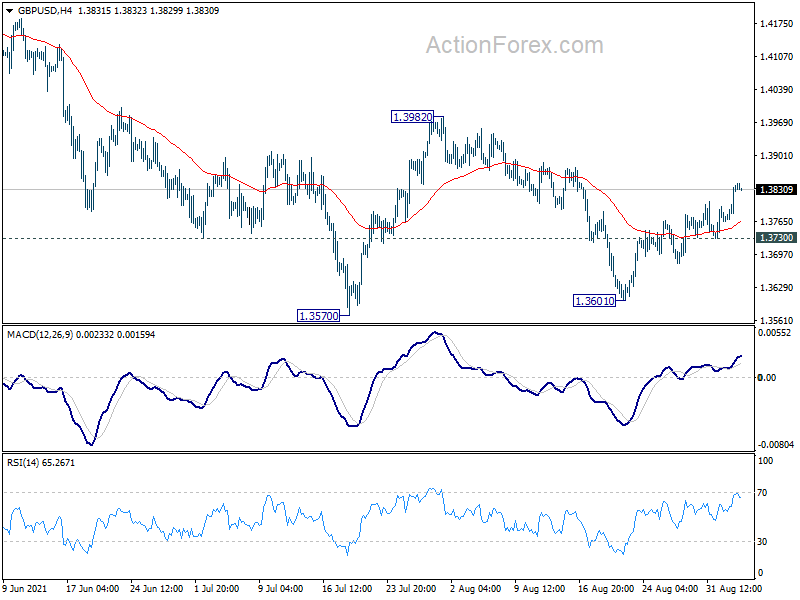
In the bigger picture, current development argues that rise from 1.1409 (2020 low) has completed at 1.4248, after failing 1.4376 resistance. Fall from there could either be correcting the rise from 1.1409, or starting another falling leg inside long term sideway pattern. In either case, sustained break of 1.3482 resistance turned support will target 38.2% retracement of 1.1409 to 1.4248 at 1.3164 first. Break there will pave the way to 61.8% retracement at 1.2493.
Dollar, Yen and Swiss Franc Continue to Decline as Focus Turns to NFP
Overall developments in the markets are unchanged for the week. US stocks continued with recent up trend overnight. Dollar, Yen and Swiss Franc extended near term decline. New Zealand and Australian Dollars are the strongest one, followed by Euro and then Sterling. Main focus will now turn to US non-farm payroll report. High volatility is anticipated with the release, as that's a crucial factor in determining Fed's tapering schedule.
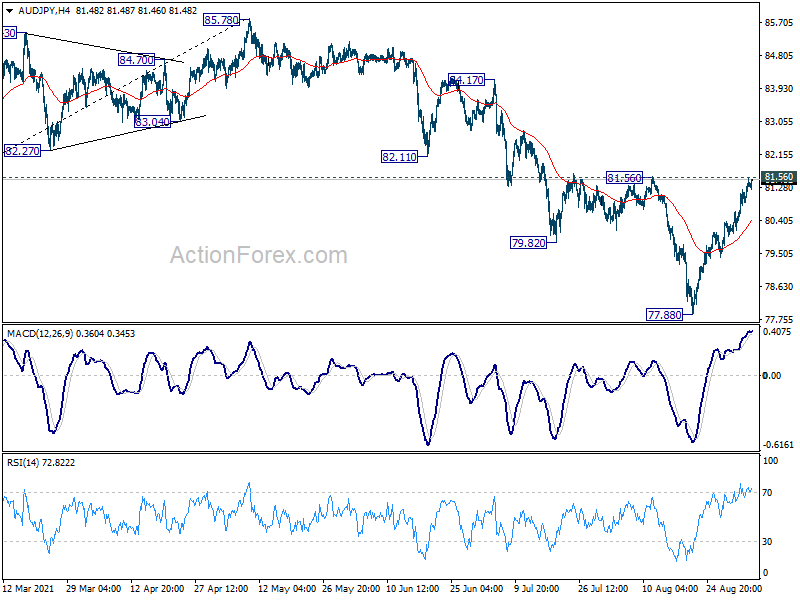
Technically, Yen crosses took another step forward with EUR/JPY's break of 130.54 resistance. That suggests completion of correction from 134.11 at 127.91. Sustained trading above 130.54 will confirm near term bullishness for a test on 134.11 high ahead. We'll now pay some attention to 81.56 resistance in AUD/JPY. Firm break there will align with near term bullishness in NZD/JPY and EUR/JPY. The stage would be set for AUD/JPY to retest 85.78 high later.
In Asia, at the time of writing, Nikkei is up 1.81%. Hong Kong HSI is down -0.54%. China Shanghai SSE is down -0.15%. Singapore Strait Times is down -0.21%. Japan 10-year JGB yield is up 0.0061 at 0.041. Overnight, DOW rose 0.37%. S&P 500 rose 0.28%. NASDAQ rose 0.14%. 10-year yield dropped -0.008 to 1.294.
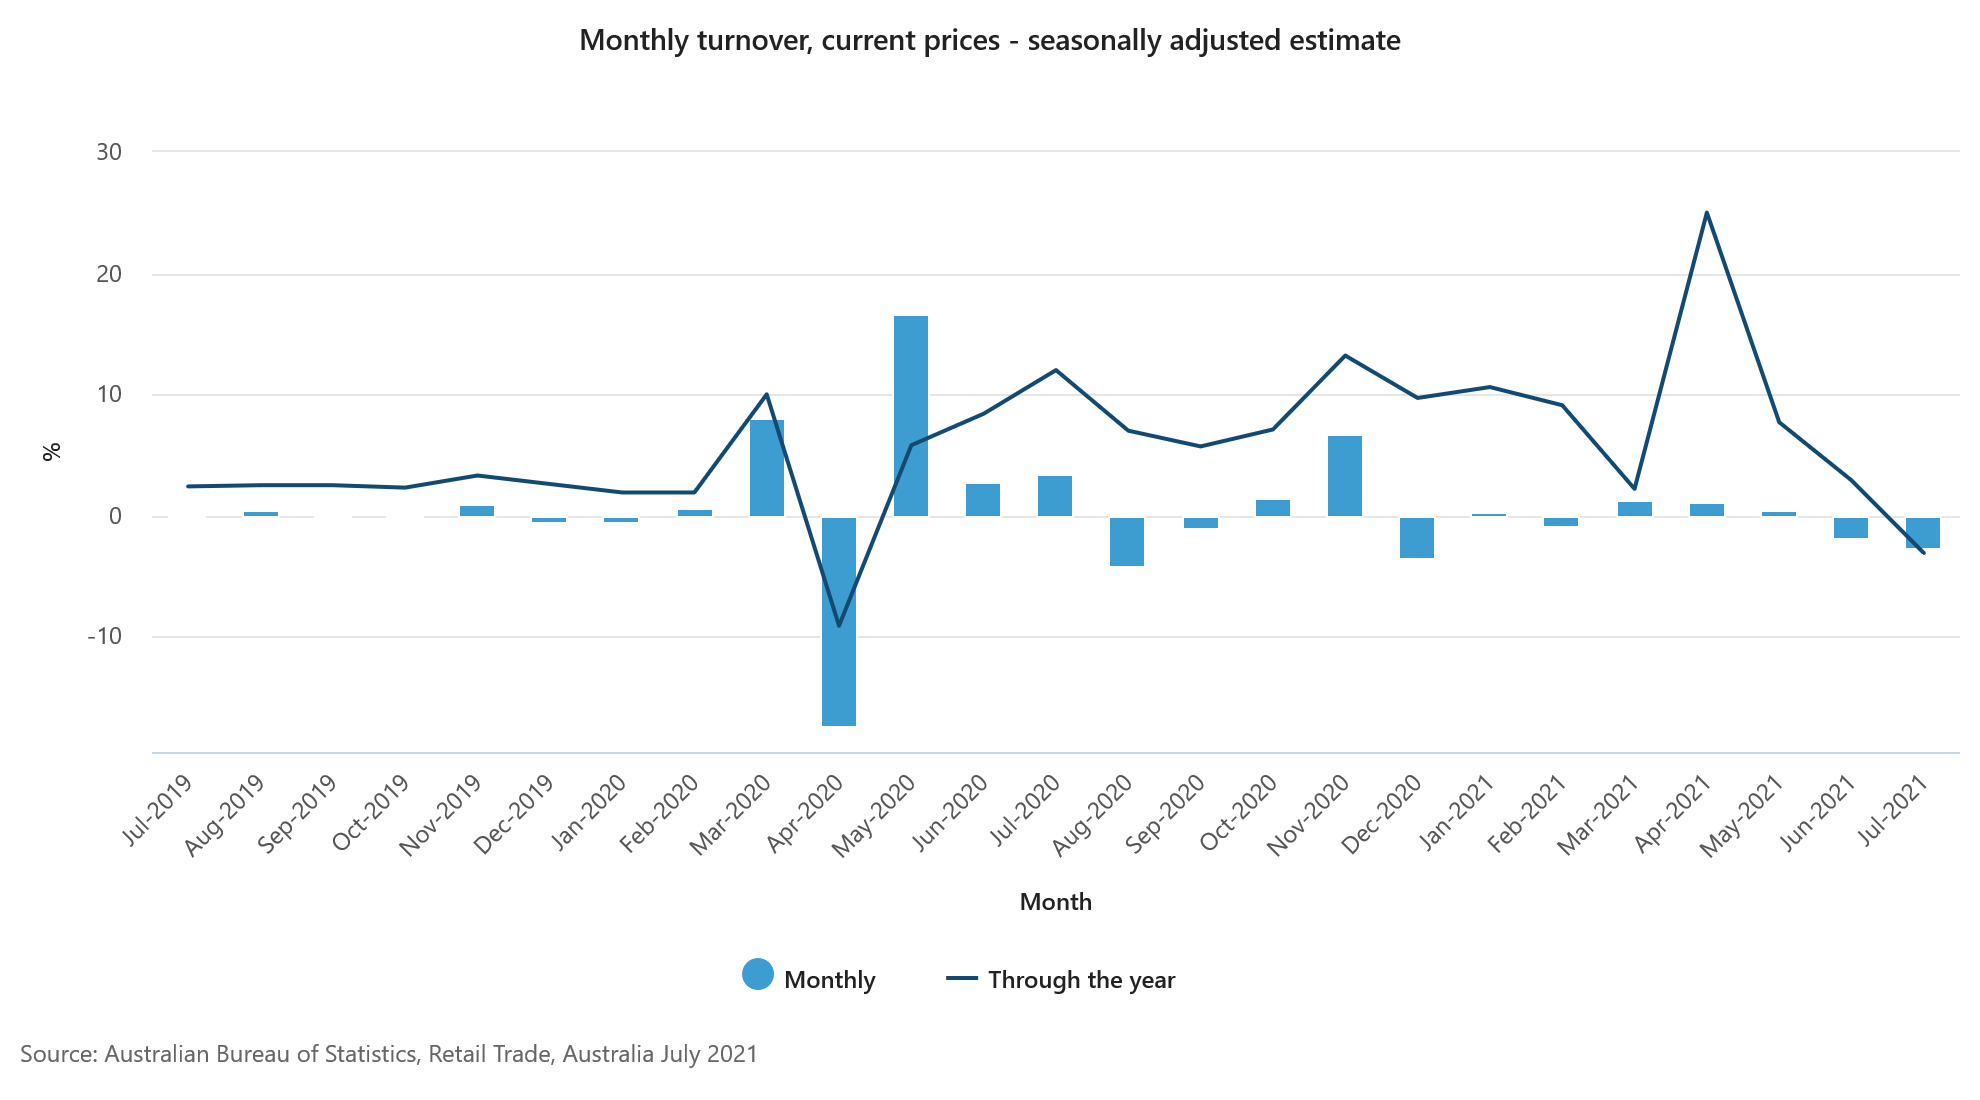
Australia retail sales dropped -2.7% mom in Jul, NSW down -8.9% mom
Australia retail sales dropped -2.7% mom in July, the largest decline this year.
Ben James, Director of Quarterly Economy Wide Surveys, said: "Lockdowns and stay-at-home orders in many parts of Australia continued to impact retail trade in July, with many non-essential retail businesses closing their physical stores.
"In particular, the first full month of lockdown in New South Wales, following the Delta outbreak in June, saw retail turnover in the state fall 8.9 per cent. This was the largest fall of any state and territory since August 2020."
Australia AiG construction dropped to 38.4, from healthy expansion to steep contraction
Australia AiG Performance of Construction Index dropped sharply by -10.3 pts to 38.4 in August. Activity dropped -7.5 to 32.9. Employment dropped -11.8 to 49.0. New orders dropped -13.1 to 364. Input prices eased slightly by -5.4 to 91.8. Selling prices dropped -11.6 to 69.6.
Ai Group Head of Policy, Peter Burn, said: "Australia's construction sector has shifted from healthy expansion to steep contraction in a flash as restrictions in the face of COVID-19 outbreaks have closed sites and disrupted supply chains.
"The impacts were concentrated in the south-east corner of the country although border closures by other states also contributed to supply chain disruptions and prevented the movement of construction personnel."
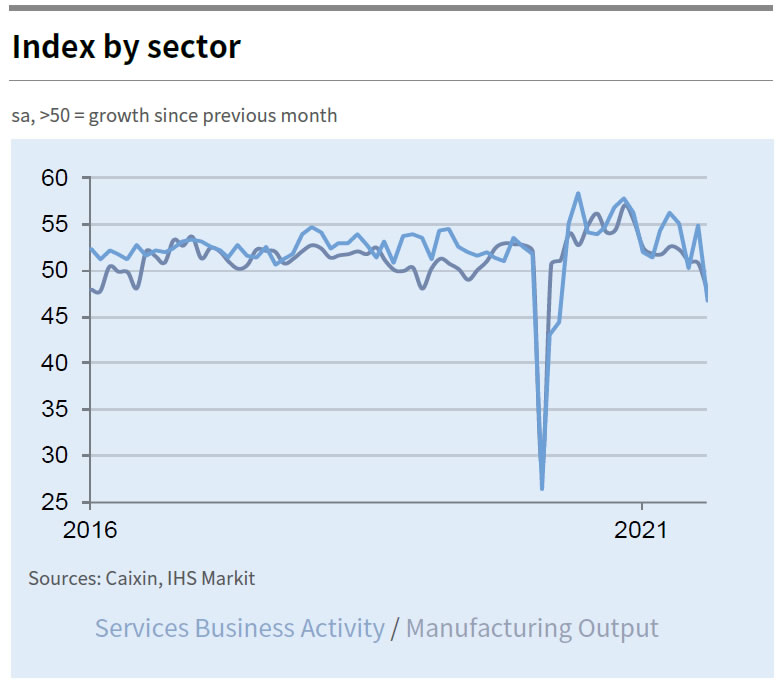
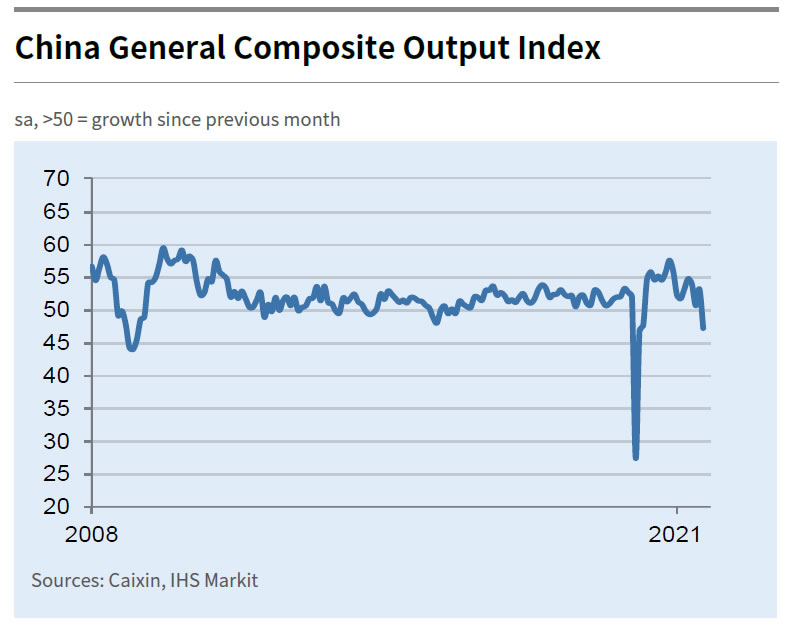
China PMI services dropped to 46.7, PMI composite dropped to 47.2
China Caixin PMI Services dropped sharply from 54.9 to 46.7 in August, well below expectation of 52.6. PMI Composite dropped from 53.1 to 47.2, first contraction since April 2020. Caixin said business activity and new orders both fell amid uptick in COVID-19 cases. Companies reduced their staffing levels slightly. Input costs rose at slower pace, output charges declined.
Wang Zhe, Senior Economist at Caixin Insight Group said: "The Covid-19 resurgence has posed a severe challenge to the economic normalization that began in the second quarter of 2020. Both manufacturing and services shrank in August, with the latter hit harder than the former...
"Official economic indicators for July were worse than the market expected, indicating mounting downward pressure on economic growth. Authorities need to take a holistic view and balance the goals of containing Covid-19, stabilizing the job market, and maintaining stability in prices and supply."
DOW could resume up trend on NFP miss
US non-farm payroll report is the major focus today, which could also set the tone for the markets for the rest of September. Markets are expecting 750k job growth in August, slowed from July's 943k. Unemployment rate is expected to drop from 5.4% to 5.2%. Average hourly earnings are expected to have strong 0.4% mom increase.
Looking at related data, ADP private employment grew only 374k, well below expectation of 650k. ISM manufacturing dropped from 52.9 to 49.0, back in contraction. Four-week moving average of initial jobless claims, on the other hand, dropped notably from 394k to 355k. There is some prospect of a downside surprise today.
At the Jackson Hole speech, Fed Chair Jerome Powell indicated that it could be "appropriate to start" tapering this year, without indicating the timing. This is seen as the center of the FOMC's opinion. Hawks would need a set of job data that could match August's to push for a tapering decision this month. Anything that misses the mark would more likely push the decision to November at least.
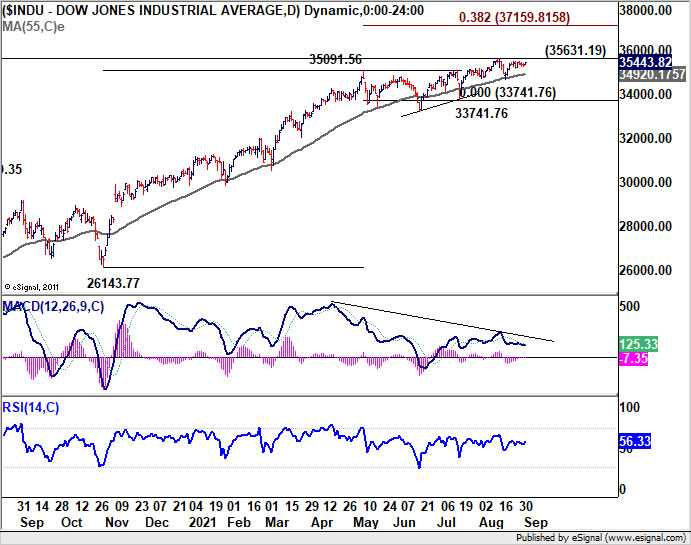
As for market reaction, we'd pay attention to DOW, which is clearly lagging behind the record running S&P 500 and NASDAQ. Expectation of a later start of tapering could help push DOW through 35631.19 resistance. Larger up trend from 26143.77 should then resume for 38.2% projection level at 37159.81 in this case. If happens, that could set the stage for renewed selling in Dollar, Yen and Swiss Franc, with Kiwi and Aussie having a slight upper hand over others.
Elsewhere
Eurozone will release PMI services final and retail sales. UK will release PMI services final. Canada will release labor productivity. US will release ISM services in addition to NFP.
GBP/USD Daily Outlook
Daily Pivots: (S1) 1.3789; (P) 1.3815; (R1) 1.3861; More...
Intraday bias in GBP/USD remains on the upside for the moment. Rise from 1.3601 is in progress for 1.3982 resistance. Decisive break there will pave the way back to retest 1.4248 high. On the downside, break of 1.3730 minor support will turn bias back to the downside for 1.3570 low, and possibly further to 1.3482 key resistance turned support.
In the bigger picture, current development argues that rise from 1.1409 (2020 low) has completed at 1.4248, after failing 1.4376 resistance. Fall from there could either be correcting the rise from 1.1409, or starting another falling leg inside long term sideway pattern. In either case, sustained break of 1.3482 resistance turned support will target 38.2% retracement of 1.1409 to 1.4248 at 1.3164 first. Break there will pave the way to 61.8% retracement at 1.2493.
Economic Indicators Update
| GMT | Ccy | Events | Actual | Forecast | Previous | Revised |
|---|---|---|---|---|---|---|
| 22:30 | AUD | AiG Performance of Construction Index Aug | 38.4 | 48.7 | ||
| 01:45 | CNY | Caixin Services PMI Aug | 46.7 | 52.6 | 54.9 | |
| 07:45 | EUR | Italy Services PMI Aug | 58.3 | 58 | ||
| 07:50 | EUR | France Services PMI Aug F | 56.4 | 56.4 | ||
| 07:55 | EUR | Germany Services PMI Aug F | 61.5 | 61.5 | ||
| 08:00 | EUR | Eurozone Services PMI Aug F | 59.7 | 59.7 | ||
| 08:30 | GBP | Services PMI Aug F | 55.5 | 55.5 | ||
| 09:00 | EUR | Eurozone Retail Sales M/M Jul | 1.20% | 1.50% | ||
| 12:30 | CAD | Labor Productivity Q/Q Q2 | -1.30% | -1.70% | ||
| 12:30 | USD | Nonfarm Payrolls Aug | 750K | 943K | ||
| 12:30 | USD | Unemployment Rate Aug | 5.20% | 5.40% | ||
| 12:30 | USD | Average Hourly Earnings M/M Aug | 0.40% | 0.40% | ||
| 13:45 | USD | Services PMI Aug F | 55.2 | 55.2 | ||
| 14:00 | USD | ISM Services PMI Aug | 61.3 | 64.1 |
Elliott Wave View: Dollar Index Ending 5 Waves
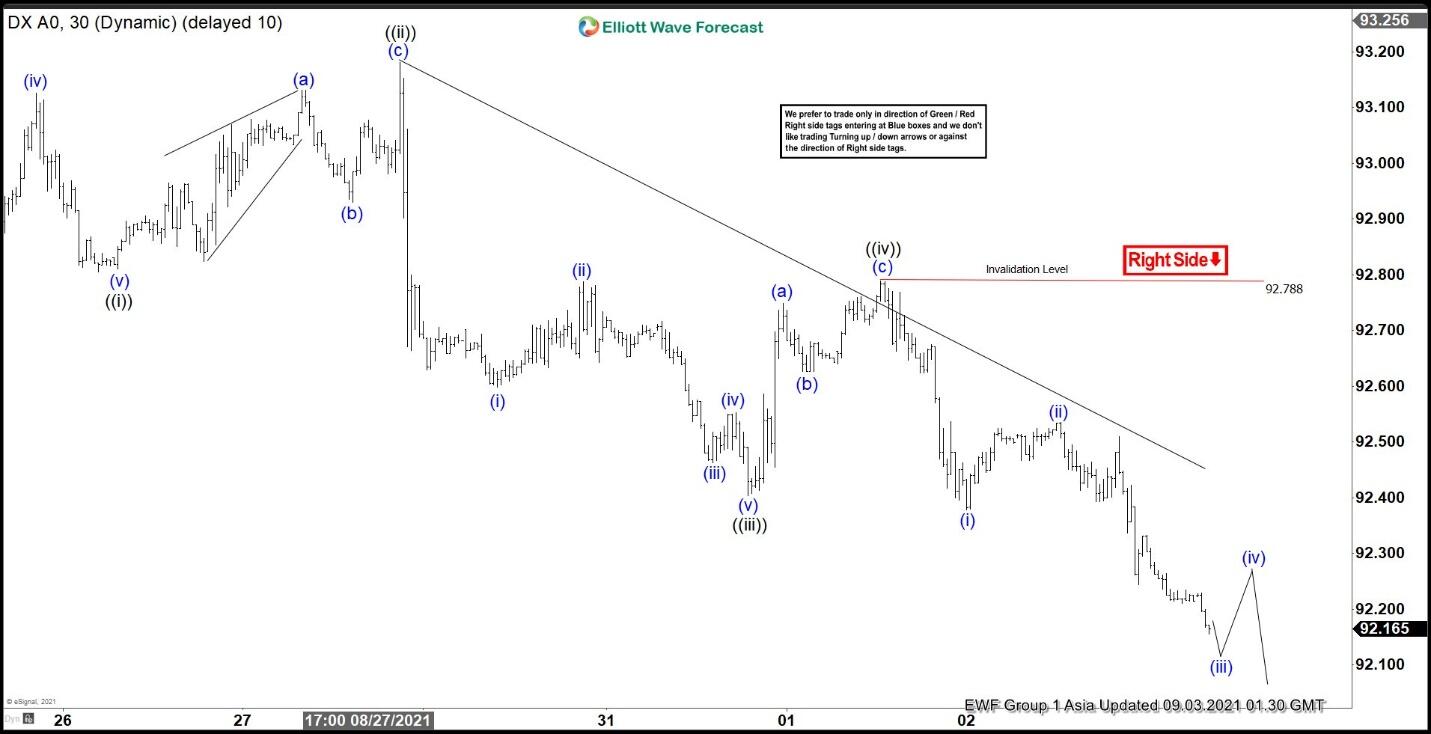
Short-term Elliott wave view in Dollar Index (DXY) suggests the decline from August 20 high is in progress as a 5 waves impulse Elliott Wave structure. Down from August 20 high, wave ((i)) ended at 92.80 and rally in wave ((ii)) ended at 93.18. Internal subdivision of wave ((ii)) unfolded as a zigzag. Wave (a) ended at 93.13, wave (b) ended at 92.93, and wave (c) ended at 93.18. The Index resumes lower in wave ((iii)) towards 92.4 in 5 waves of lesser degree. Down from wave ((ii)), wave (i) ended at 92.6 and rally in wave (ii) ended at 92.78. Index then resumes lower in wave (iii) towards 92.46, rally in wave (iv) ended at 92.55, and final leg lower wave (v) ended at 92.4.
Rally in wave ((iv)) ended at 92.78 and the Index has resumed lower. Down from wave ((iv)), wave (i) ended at 92.37 and rally in wave (ii) ended at 92.53. Expect wave (iii) to end soon, and the Index should rally in wave (iv) before turning lower again. Near term, as far as pivot at 92.78 high remains intact, expect rally to fail in 3, 7, or 11 swing for further downside.
DXY 30 Minutes Elliott Wave Chart
Market Morning Briefing: EURJPY Has Broken Above 130.50
STOCKS
Equities have all risen well and trade in the green with bullish hopes for the near term. Dow has held above 35250 while Nikkei, Shanghai and Dax has risen above 28500, 3550 and 15800 respectively, all looking bullish for the near term. Nifty can head towards 17400 while Sensex too looks bullish for a rise to 58000.
Dow (35443.82, +131.29, +0.37%) has held above support at 35250 and bounced back well. A break above 35500 is now needed for the index to rise further towards 35750-38500 in the coming sessions. While above 35250, view is bullish.
DAX (15840.59, +16.30, +0.10%) is trading above support at 15800 and while that holds, a rise to 16000 can be possible soon. Failure to hold above 15800 can drag the pair down to 15600. A range of 16000-15600/800 may hold for now.
Nikkei (28787.35, +243.84, +0.85%) has surged sharply above the immediate resistance at 28500.The view is bullish to see a test of 29000 and eventually 30000 on the upside. A break below 28000 will be needed for the index to again turn bearish.
Shanghai (3599.83, +2.79, +0.078%) is almost at 3600 and a break above this if seen and sustained, can take it towards 3620/40 in the near term.
Nifty (17234.15, +157.90, +0.92%) bounced back sharply yesterday. Immediate view is bullish to see a test of 17400 before we see a dip towards 16800-16700 in the longer run.
Sensex (57852.54, +514.33, +0.90%) has risen sharply and can rise to 58000 before we see a corrective dip
COMMODITIES
Brent and WTI can test 73.50/74 and 70 respectively before falling off while Gold and silver seems o be stuck in a sideways range. Copper can range within 4.20-4.40/50.
Brent (72.91) and WTI (69.71) have moved up. A range of 72.50-67.50 mentioned on Brent yesterday has been broken on the upside and we may have to allow for a test of 73.50-74 which if holds can produce a fall to 70.50-67.50 again in the medium term. Immediate range of 73.50/74-70.50 can be considered for now. Nymex WTI on the other hand is headed towards immediate resistance at 70.
Gold (1815.90) is in a sideways range of 1820/25-1800 and needs to break on either side to give directional clarity. Overall while the US Dollar trades weak, Gold should ideally rise.
Silver (23.97) may test 24.50-25 on the back of Dollar weakness before falling back to 23.50 on the downside. Overall range of 23.50-24.50/25 may hold for the medium term.
Copper (4.2940) is ranged within 4.20-4.40 and could soon bounce back to 4.40-4.50 in the medium term if it holds above 4.25/20. Failure to hold above 4.20/25 can drag it sharply lower towards 4.10/4.00.
FOREX
Dollar Index has fallen sharply pulling up Euro to above 1.1850. While the dollar Index head towards 92-91.75, Euro may rise above 1.19. A break above 1.1920/30 would confirm medium term bullishness. Aussie, Pound and EURJPY have also broken their respective resistances and could be headed towards 0.7450-0.75, 1.39-1.3950 and 131-132 respectively in the medium term. USDCNY can bounce from 6.45 to head towards 6.47/48. USDINR has scope to test 73.40/50 while above 72.90, but looking at the strength in other currencies, would USDINR too attempt a fall from current levels? Will need a close watch today.
Dollar Index (92.17) has broken decisively below 92.50 and could fall towards 92-91.75 before bouncing back again. We will have to see if it bounces back from 91.75 or breaks lower. A break below 91.75 would bring back the index within the broad range of 89-93 that may hold for the medium term. Watch price action near 92-91.75.
Euro (1.1882) has been surging past 1.1850 and is headed towards 1.19.A break above 1.1920/30 would confirm further bullishness on the Euro.
EURJPY (130.57) has broken above 130.50 and could be headed towards 131-132 on the upside if the rising momentum continues to hold.
Dollar-Yen (109.90) has been fluctuating below 110.40/20 with lack of clarity on immediate direction. A sharp and sustained movement on either side of the 109-110.40 region is needed for some clarity. Immediate support is seen near 109.60/40.
Aussie (0.7405) has risen as expected and could be headed towards 0.7450 soon. We may expect resistance near 0.7450 or higher at 0.75 to hold and produce a fall towards 0.7350 in the medium term.
Pound (1.3843) is not an exception and in line with other currency pairs showing strength, Pound has also broken above 1.38 and could soon test 1.39/1.3950 before coming off from there. 1.40 continues to hold as crucial resistance while above 1.38.
USDCNY (6.4593) has support at 6.45 which if holds can produce a bounce back to 6.47/48 in the near term within the broad sideways range of 6.45-6.50 that has been holding since July’21.
USDINR (73.0625) has scope to rise to 73.40/50 while above 72.90 before resuming downtrend towards 72.75/50 in the medium term. Will have to watch closely to see if the pair would fall in line with strength in other currencies globally.
INTEREST RATES
The US Treasury yields have dipped further and continues to keep the near-term outlook mixed. The chances of a rise before resuming the broader downtrend is still alive though. We will have to wait and see what the jobs data release has in plate for the yields. The German yields sustain their corrective rally and have room to move up further from here before resuming the broader downtrend. The 10Yr and 5Yr GoI have declined sharply further and are keeping our bearish view intact.
The US 2Yr (0.21%), 5Yr (0.77%), 10Yr (1.29%) and the 30Yr (1.90%) Treasury yields have dipped slightly across tenors. The immediate view continues to remain unclear. As mentioned yesterday, the 30Yr will still have the chances alive of seeing a rise to 2%-2.1% while above 1.87%. But the 10Yr looks mixed with equal chances of either falling to 1.2%-1.18% or rising to 1.4%-1.45% from here. We will have to wait and watch.
The German 2Yr (-0.74%) and the 5Yr (-0.70%) yields have dipped slightly while the 10Yr (-0.38%) and 30Yr (0.11%) remains stable. Our view remains the same. The current corrective rally can extend up to -0.30%/-0.25% (10Yr) and 0.20% (30Yr) while the 30Yr sustains above 0.10%. Thereafter we expect the yields to reverse lower and resume the broader downtrend.
The Indian 10Yr GoI (6.1713%) has seen a strong break below 6.2%. As mentioned yesterday, the view is bearish to test 6.1% initially and then extend upto 6% eventually over the medium-term. The 5Yr GOI (5.5860%) has declined further and keeps our bearish view intact of seeing 5.5% on the downside in the coming weeks. Intermediate support is at 5.57% from where a short-lived corrective bounce is possible.
USD/JPY Nears Crucial Juncture, US NFP Next
Key Highlights
- USD/JPY failed to accelerate higher above the 110.40 region.
- A key bullish trend line is forming with support near 109.75 on the 4-hours chart.
- EUR/USD climbed further above 1.1850, and GBP/USD broke the 1.3800 resistance.
- The US nonfarm payrolls could increase 750K in August 2021, down from 943K.
USD/JPY Technical Analysis
The US Dollar attempted an upside break above 110.50 against the Japanese Yen. However, USD/JPY failed near 110.40 and it started a fresh downside correction.
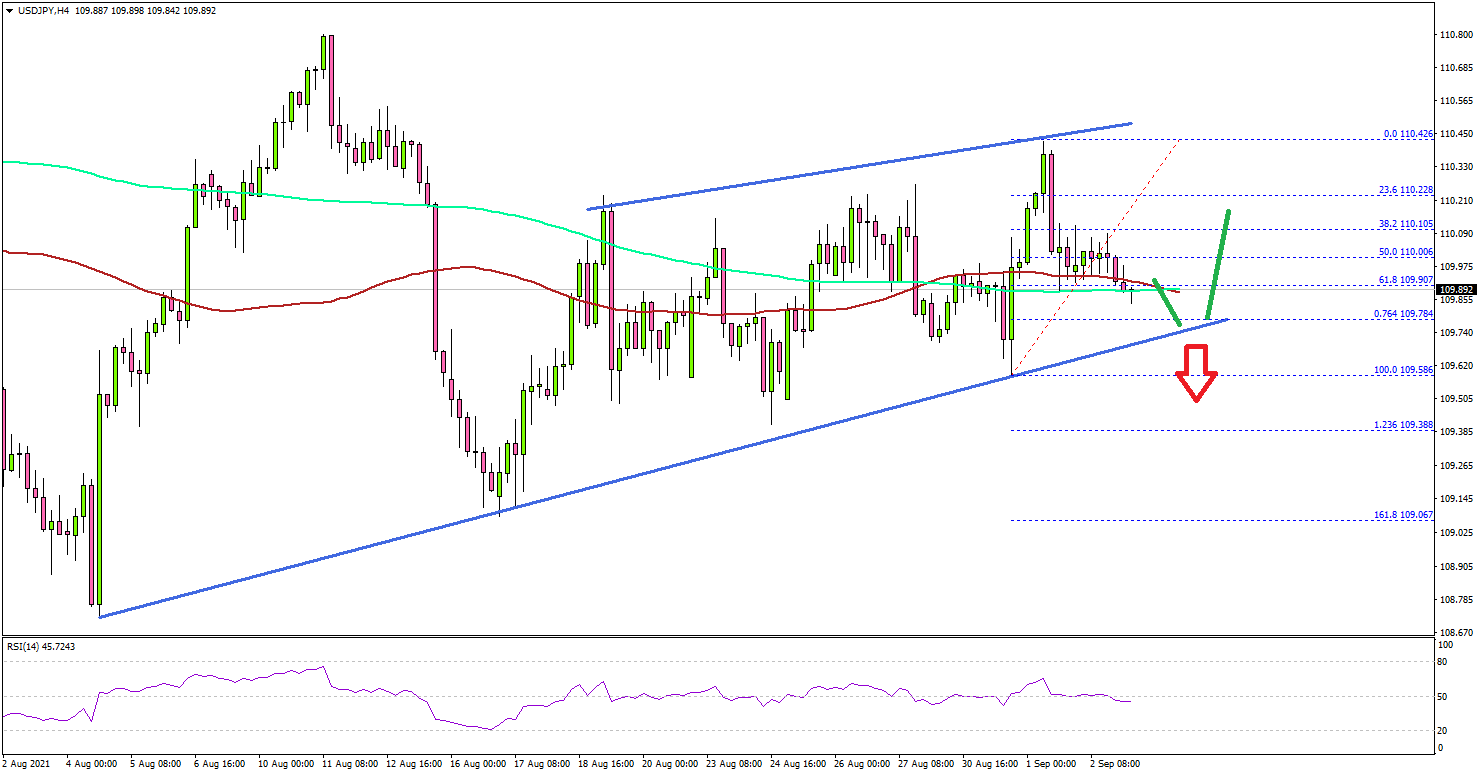
Looking at the 4-hours chart, the pair corrected lower below the 110.20 support zone. There was a break below the 50% Fib retracement level of the upward move from the 109.58 swing low to 110.42 high.
The pair is now trading just below 110.00, the 100 simple moving average (red, 4-hours), and the 200 simple moving average (green, 4-hours).
The main breakdown support seems to be forming near 109.75. There is also a key bullish trend line forming with support near 109.75 on the same chart. The trend line coincides with the 76.4% Fib retracement level of the upward move from the 109.58 swing low to 110.42 high.
A downside break below the trend line support could spark a drop towards the 109.00 support. On the upside, an immediate resistance is near the 110.20 zone.
The main resistance is near the 110.50 zone. A close above the 110.50 resistance might open the doors for a steady increase. The next major resistance sits near 110.80 and 111.00.
Looking at EUR/USD, the pair extended its increase above the 1.1850 resistance zone. Besides, GBP/USD gained strength for a move above the key 1.3800 resistance zone.
Economic Releases
- Germany's Services PMI for August 2021 - Forecast 61.5, versus 61.5 previous.
- Euro Zone Services PMI for August 2021 – Forecast 59.7, versus 59.7 previous.
- UK Services PMI for August 2021 – Forecast 55.5, versus 55.5 previous.
- US Services PMI for August 2021 – Forecast 55.2, versus 55.2 previous.
- US nonfarm payrolls for August 2021 – Forecast 750K, versus 943K previous.
- US Unemployment Rate for August 2021 - Forecast 5.2%, versus 5.4% previous.
Weak Dollar Awaits Jobs Rescue
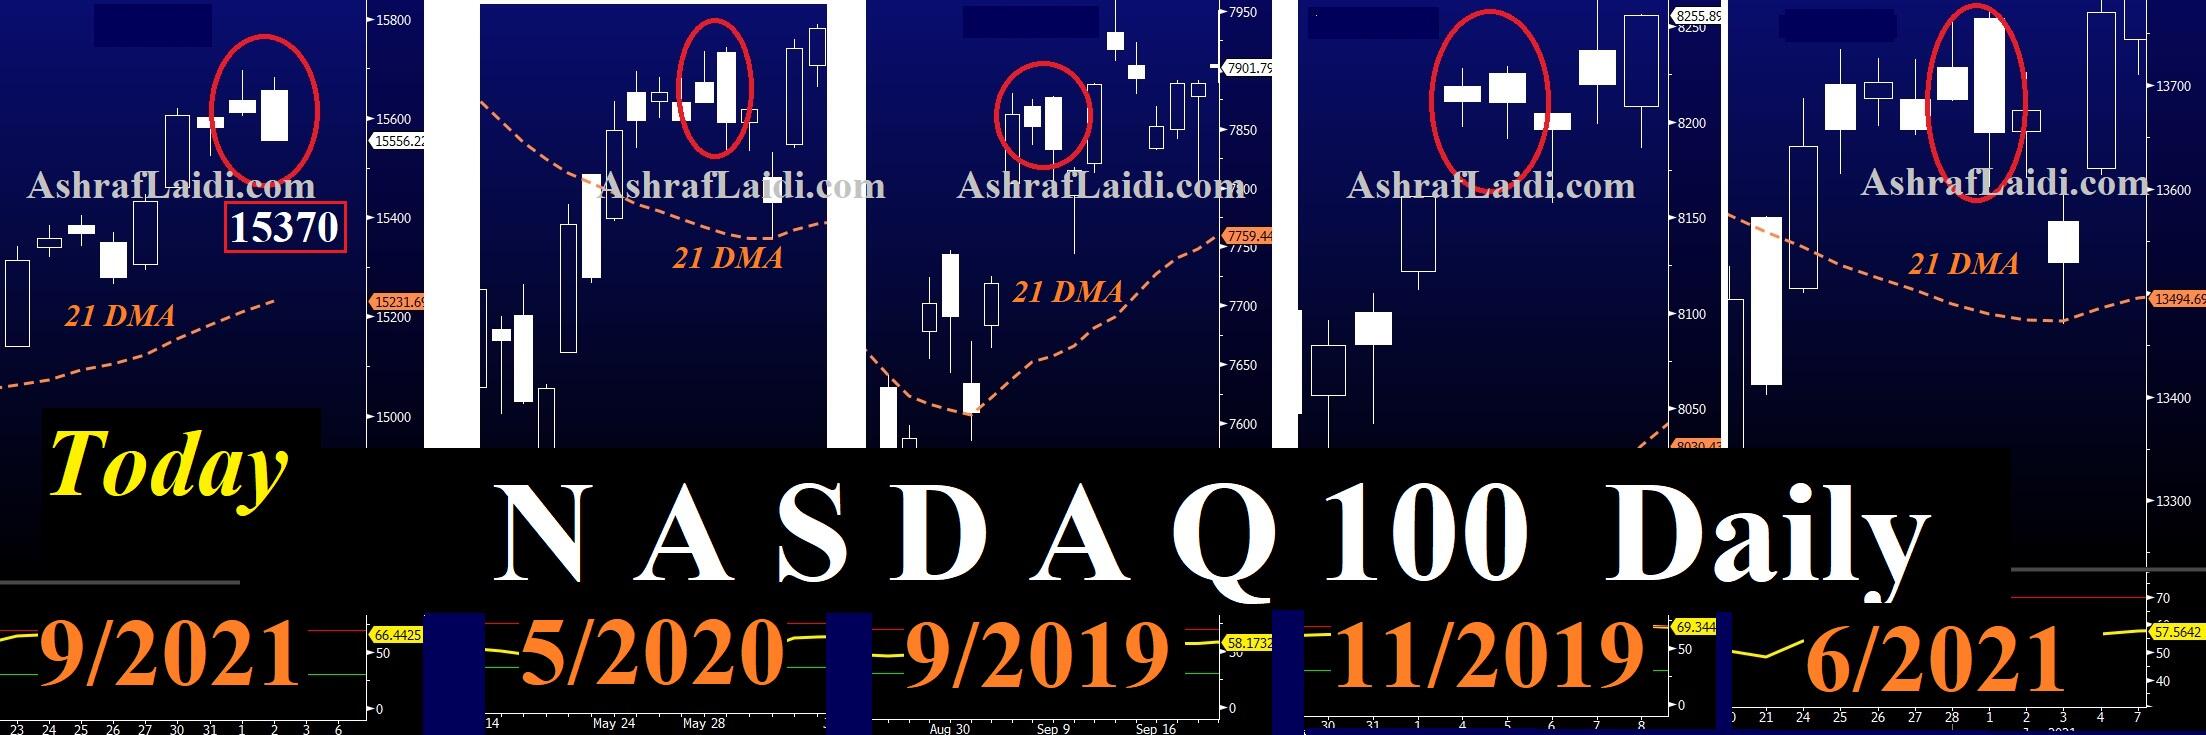
DXY is posting its 5th consecutive daily decline, the longest string of losses since April. Thursday's release of weekly jobless showed a slight decline as expected, but it was Wednesday's poor ADP employment report and hawkish ECB comments in response to highe Ezone CPI that helped accelerate USD selling. ADP does have a spotty record but the soft August reading adds to the mounting evidence that the US economy isn't as strong as believed. The NASDAQ charts below suggest a short-term trading opportunity in NASDAQ100 based on 4 prior cases. We let the charts speak for themselves.
The ADP employment report showed the US adding just 374K jobs in August compared to 640K expected. That was compounded by the employment component of the ISM manufacturing report falling below 50.
The pandemic-era history of the ADP report and the small size of manufacturing employment in the US make both metrics questionable but they underscored the market's focus on jobs at the moment. The dollar fell 30-40 pips across the board on the data in only a small preview of the decline should non-farm payrolls match the miss.
Another spot to watch is the weekly US natural gas storage report, which is expected to show a build of 20 bcf. Last week's surprise miss helped to send gas prices into high gear in the US and into overdrive in Europe and Asia. The base case for global central banks is that the flattening of energy prices flattens out inflation but natural gas – which is critical in home heating and energy generation – could add another front to watch on prices; and one that could present a big headache for politicians and central bankers. Moreover, this is not traditionally the peak of natural gas prices for the year with every recent seasonal spike coming in the cold months. So expect to hear much more about NG and LNG in the months ahead.
Cliff Notes: A Week of Surprises
Key insights from the week that was.
Australian Q2 GDP was the headline data outcome this week.
Ahead of its release on Wednesday, the partials for inventories and trade pointed to material downside risks to growth in Q2. In particular: while the trade balance widened to another record high on commodity price strength, declining export volumes saw net exports subtract 1ppt from GDP in the quarter; private non-farm inventories also surprised to the downside, the business indicators release pointing to a 0.7ppt subtraction in Q2.
However, Q2 GDP actually shocked to the upside, printing at 0.7%, 9.6%yr. On an expenditure basis, public and farm inventories provided a helpful 0.6ppt offset to private non-farm inventories’ -0.7ppt, while private final demand contributed 1.1ppts thanks to strength in consumption and investment.
As a result, the expenditure measure of GDP printed at 0.4%, with the income and production measures 0.6% and 0.9% gains pulling the headline average measure up to 0.7%.
As detailed by the ABS, lockdowns had only a marginal impact on growth in Q2 – NSW’s lockdown only began in the final week of the quarter. While Q3’s contraction will be large and the speed of the initial recovery is at risk because of the severity of the outbreaks in both NSW and Vic, the positive Q2 result eliminates the chance of a 2021 recession and any associated hit to sentiment. For the full detail on GDP by sector, state and industry, see our Q2 bulletin.
Following the release of the balance of payments, now is also a fitting time to highlight the financial flow dynamics present in the quarter and over FY2021. From the latest financial account data, it is evident foreign parent companies remain committed to their Australian subsidiaries, with direct investment in Australia in Q2 2021 and over FY 2021 continuing to grow despite the uncertainties created by delta across the Asian region. Australian companies remain more circumspect on opportunities offshore, though this is a continuation of the pre-pandemic trend, not the result of COVID-19.
Also of note in recent quarters has been the aggressive push offshore by both individual and institutional investors (chiefly our super funds). In the initial recovery, there was a strong outflow of Australian capital to foreign investments, the circa $115bn outflow in H2 2020 more than three times the repatriation seen on COVID-19 concerns in the six months to June 2020. This investing continued at pace in H1 2021, the $120bn outflow on an annualised basis twice the annual average over the 5 years to December 2019. Another interesting point worth noting about this flow is that it was almost entirely equity related (88%), a striking contrast to recent foreign portfolio inflows into Australia which have been heavily skewed to debt (80%).
The striking rise in the scale of Australia’s net equity assets from 2% of GDP to 15% since 2016 and the gaping differential between dividends yields and interest rates has combined to reduce Australia’s net income deficit to a third its peak level back in 2007. The recent investment flow detail suggests a further narrowing of the deficit is possible.
The implications of the above for the Australian dollar are uncertain in terms of their timing and scale. Portfolio outflows are likely to continue as Australian individual and institutional investors leverage into the global recovery. But it is also probable that foreign businesses/ investors will increase their direct investment in Australia in 2022, if not before. The currency effect of the related income flows should prove neutral – at least for now. Until there is need for accrued income to finance spending back in Australia, investors are likely to re-invest it offshore, as Australian parent firms have typically done for their directly-owned subsidiaries.
Moving offshore, China’s official PMIs disappointed this week, the services measure contracting (47.5) as manufacturing stalled (50.1). These outcomes stem from the stringent restrictions imposed by authorities to stop delta’s spread during July/August. Promisingly, the 7-day average for new cases has fallen from over 100 mid-August to less than 30 of late. If this trend is sustained, restrictions will be removed and activity will bounce across manufacturing and services into year end.
Intriguingly, while the 7-day average of daily new COVID-19 cases in the US is now nearing 170k, the manufacturing PMIs from ISM and Markit held near historic highs in August. The economic cost of delta in the US is instead being worn by the household sector. Notably this week, Conference Board consumer sentiment dropped 11pts in August, matching the fall in the University of Michigan survey last week. The ISM manufacturing employment index also fell to a contractionary reading of 49, and ADP private payrolls came in well below expectations. Despite these downside surprises, we continue to expect another very strong reading for nonfarm payrolls tonight, around 850k, driven by the economy’s re-opening. Employment growth will slow materially in coming months, but our base case is that it will remain historically strong. Note though, to that view, leading indicators of activity such as the Atlanta Fed’s GDPNow infer risks are skewing to the downside.
DOW could resume up trend on NFP miss
US non-farm payroll report is the major focus today, which could also set the tone for the markets for the rest of September. Markets are expecting 750k job growth in August, slowed from July's 943k. Unemployment rate is expected to drop from 5.4% to 5.2%. Average hourly earnings are expected to have strong 0.4% mom increase.
Looking at related data, ADP private employment grew only 374k, well below expectation of 650k. ISM manufacturing dropped from 52.9 to 49.0, back in contraction. Four-week moving average of initial jobless claims, on the other hand, dropped notably from 394k to 355k. There is some prospect of a downside surprise today.
At the Jackson Hole speech, Fed Chair Jerome Powell indicated that it could be "appropriate to start" tapering this year, without indicating the timing. This is seen as the center of the FOMC's opinion. Hawks would need a set of job data that could match August's to push for a tapering decision this month. Anything that misses the mark would more likely push the decision to November at least.
As for market reaction, we'd pay attention to DOW, which is clearly lagging behind the record running S&P 500 and NASDAQ. Expectation of a later start of tapering could help push DOW through 35631.19 resistance. Larger up trend from 26143.77 should then resume for 38.2% projection level at 37159.81 in this case. If happens, that could set the stage for renewed selling in Dollar, Yen and Swiss Franc, with Kiwi and Aussie having a slight upper hand over others.
China PMI services dropped to 46.7, PMI composite dropped to 47.2
China Caixin PMI Services dropped sharply from 54.9 to 46.7 in August, well below expectation of 52.6. PMI Composite dropped from 53.1 to 47.2, first contraction since April 2020. Caixin said business activity and new orders both fell amid uptick in COVID-19 cases. Companies reduced their staffing levels slightly. Input costs rose at slower pace, output charges declined.
Wang Zhe, Senior Economist at Caixin Insight Group said: "The Covid-19 resurgence has posed a severe challenge to the economic normalization that began in the second quarter of 2020. Both manufacturing and services shrank in August, with the latter hit harder than the former...
"Official economic indicators for July were worse than the market expected, indicating mounting downward pressure on economic growth. Authorities need to take a holistic view and balance the goals of containing Covid-19, stabilizing the job market, and maintaining stability in prices and supply."
Australia retail sales dropped -2.7% mom in Jul, NSW down -8.9% mom
Australia retail sales dropped -2.7% mom in July, the largest decline this year. Ben James, Director of Quarterly Economy Wide Surveys, said: "Lockdowns and stay-at-home orders in many parts of Australia continued to impact retail trade in July, with many non-essential retail businesses closing their physical stores. In particular, the first full month of lockdown in New South Wales, following the Delta outbreak in June, saw retail turnover in the state fall 8.9 per cent. This was the largest fall of any state and territory since August 2020."