Sample Category Title
Australia AiG construction dropped to 38.4, from healthy expansion to steep contraction
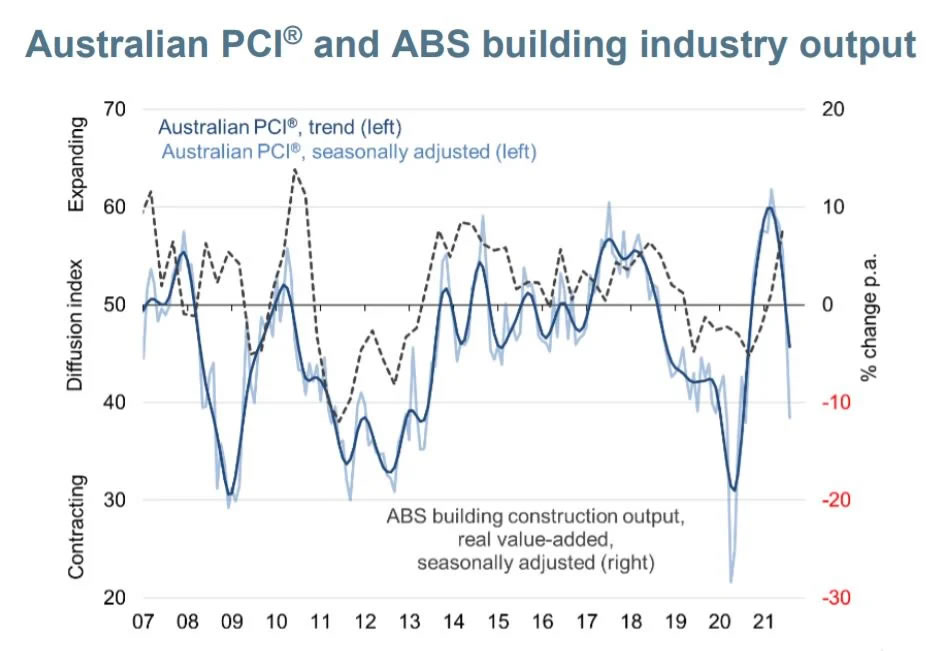
Australia AiG Performance of Construction Index dropped sharply by -10.3 pts to 38.4 in August. Activity dropped -7.5 to 32.9. Employment dropped -11.8 to 49.0. New orders dropped -13.1 to 364. Input prices eased slightly by -5.4 to 91.8. Selling prices dropped -11.6 to 69.6.
Ai Group Head of Policy, Peter Burn, said: "Australia's construction sector has shifted from healthy expansion to steep contraction in a flash as restrictions in the face of COVID-19 outbreaks have closed sites and disrupted supply chains.
"The impacts were concentrated in the south-east corner of the country although border closures by other states also contributed to supply chain disruptions and prevented the movement of construction personnel."
Eco Data 9/3/21
[php_everywhere instance="1"]
OPEC+ Sticks With Original Plan to Add Output Despite Economic Uncertainty. US Inventory Fell Sharply
The OPEC+ will continue to increase oil output by +0.4M bpd in October. The decisions was made swiftly and came in line with the alliance’s plan to gradually bring back the output reduced (9.7M bpd) amidst the outbreak of the pandemic last year. Although the alliance has projected that the oil market would be in deficit in coming month, justifying more output, we are concerned that the move would lead to weakness in oil prices, given global economic uncertainty.
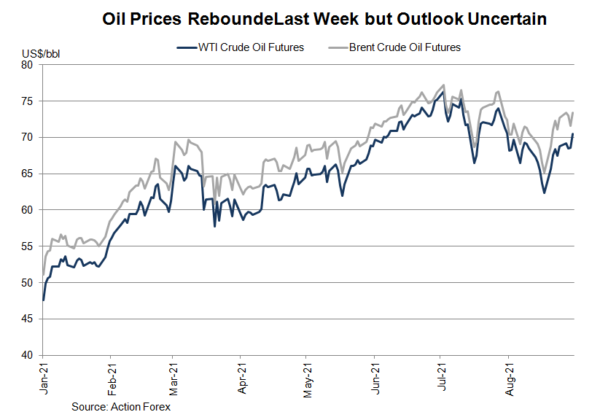
The oil producers remained confident that the market would be able to absorb the increase in output. As noted in the joint statement, "while the effects of the COVID-19 pandemic continue to cast some uncertainty, market fundamentals have strengthened and OECD stocks continue to fall as the recovery accelerates". Their internal forecasts revealed that global oil demand should far exceed supply through the rest of the year, by +1M bpd in September, +1.1M bpd in October,+0.8M bpd in November and +0.4M bpd in December. Yet, the market would probably return to surplus next year. The OPEC+ revised higher its oil demand growth forecast to 4.2M bpd for 2022, up from the previous 3.3M bpd, signaling that the market would be in excess of oil by 1.6M bpd.
Sharp Decline in US Crude Oil Inventory Last Week
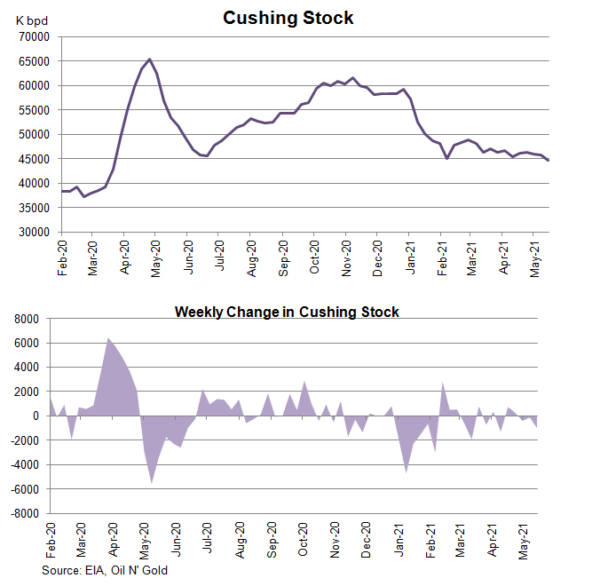
The report from the US Energy Information Administration (EIA) shows that total crude oil and petroleum products (ex. SPR) stocks slumped -13.62 mmb to 1243.82 mmb in the week ended August 27. Crude oil inventory declined for most in 7 weeks, down -7.17 mmb (consensus: -3.09 mmb) to 425.4 mmb. Stockpile in PADD 3 (Gulf Coast) plunged -8.97 mmb during the week. Cushing stock gained +0.84 mmb to 34.5 mmb. Utilization rate decreased -1.1 percentage points to 91.3% while crude production climbed +0.1 mmb higher to 11.35 bpd for the week. Crude oil importsincreased -0.18M bpd to 6.34M bpd in the week.
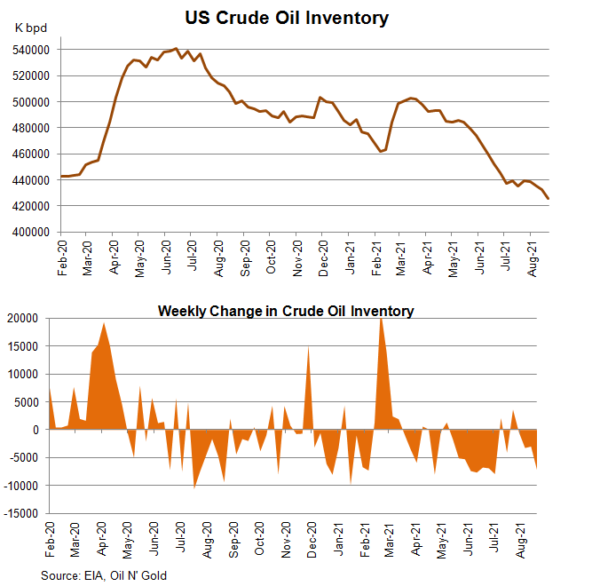
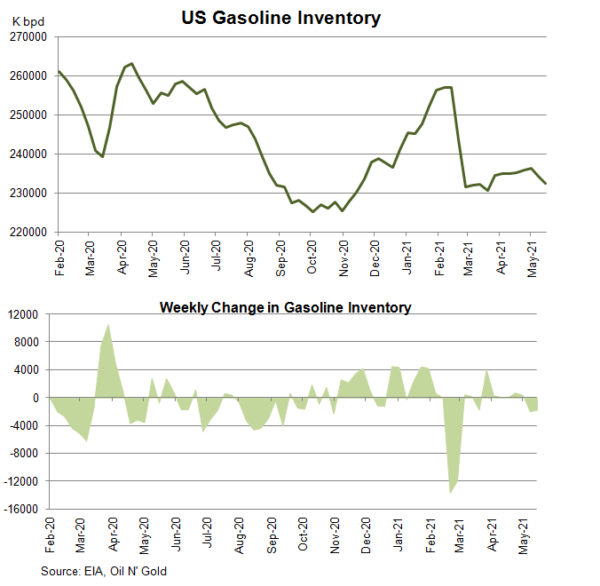
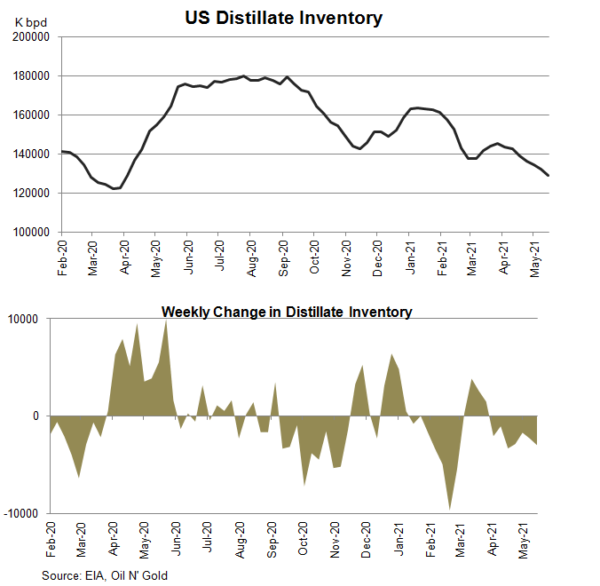
 Concerning refined oil product inventories, gasoline inventory added +1.29 mmb to 227.21 mmb although demand also gained +0.06% to 9.58M bpd. The market had anticipated a -1.63 mmb fall in stockpile. Production slipped -3.55% to 9.89M bpd while imports were up +5.76% to 1.14M bpd during the week. Distillate stockpile dropped -1.73 mmb to 136.73 mmb. The market had anticipated a -0.65 mmb decrease. Demand rose +6.97% to 4.39M bpd. Production dropped -3.57% to 4.81 mmb while imports rose +26.4% to 0.36M bpd during the week.
A day earlier, the industry-sponsored API estimated that crude oil inventory was down -4.05 mmb. Gasoline stockpile gained +2.71 mmb, while that for distillate dropped -1.96 mmb.
Aussie Extends Gains, Retail Sales Next
The Australian dollar has extended its gains and is in positive territory for a third consecutive day. Currently, AUD/USD is trading at 0.7406, up 0.52% on the day. The pair is currently at its highest level since August 5th and is up 1.19% on the week.
Will Australia Retail Sales rebound?
Australia Retail Sales faltered badly in June, with a reading of -2.7%. We’ll get a look at the July reading on Friday. Another sharp decline could put an end to the Aussie’s current rally. Australia continues to grapple with Covid-19, with the Delta variant causing a record number of cases. The economy has been hit by the double blow of soft domestic activity and tepid global demand, and that nasty term ‘recession’ is already being bandied about as investors fret about the economy. Still, it’s important to remember that Australia’s Covid numbers are relatively low, and once this Covid wave is contained, the economy will improve.
All eyes are on US Nonfarm Payrolls, which will be released on Friday. Investors are a bit more cautious after some disappointing US data on Wednesday – the ADP Employment report missed the forecast by almost half, while the ISM manufacturing employment sub-index fell into contraction territory. Granted, the ADP is not a reliable indicator of NFP, but such a massive miss has understandably raised eyebrows about the strength of the labor market. It will be interesting to see if the consensus of 750 thousand is on target – an overperformance will trigger speculation about an imminent Fed taper, while a massive miss would likely delay a taper. This means that we could see significant movement from the US dollar on Friday.
Later in the day, Fed members Raphael Bostic and Mary Daly will deliver speeches. Bostic is hawkish and recently said it was “reasonable” to commence tapering in October. Day is viewed as more of a centrist, so if her remarks indicate a move in either direction, the markets, and the US dollar could respond.
AUD/USD Technical
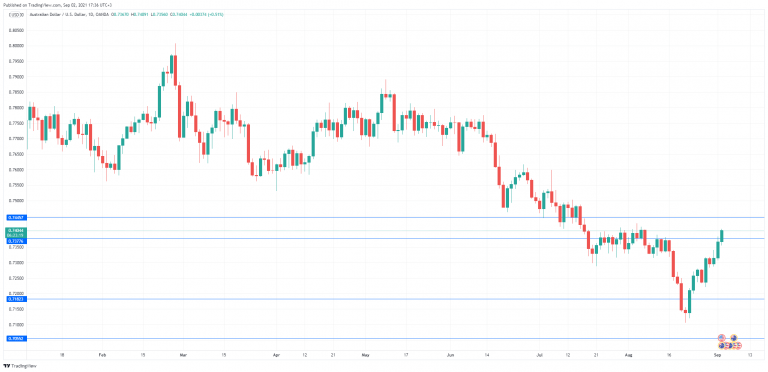
- AUD/USD is testing resistance at 0.7377.Next, there is resistance at 0.7455
- There are support levels at 0.7182 and 0.7055
Swissie Yawns on Mixed Swiss Data
The Swiss franc continues has drifted for most of the week and the pattern has continued on Thursday. USD/CHF is currently trading at 0.9161, up o.17% on the day.
Retail Sales sink but GDP rebounds
It has been an unusually busy day for Swiss releases, with three events on the calendar. The most noteworthy item was Retail Sales for July, which fell by 2.6% (YoY), its sharpest decline since April. The sharp decline reflects weakness in the services sector, as consumer spending has waned due to the Covid-19 pandemic. There was better news from second-quarter GDP, which rebound strongly with a 1.8% gain, after declining 1.4% in Q1. GDP in the second quarter was only 0.5% lower than growth prior to the pandemic (Q4 of 2019), according to the Swiss government. Much of the improvement can be attributed to the easing of health restrictions in the April-June period. Inflation remains low, with a slight gain of 0.2% in August (MoM).
All eyes are on US Nonfarm Payrolls, which will be released on Friday. Investors are a bit more cautious after some disappointing US data on Wednesday – the ADP Employment report missed the forecast by almost half, while the ISM manufacturing employment sub-index fell into contraction territory. Granted, the ADP is not a reliable indicator of NFP, but such a massive miss has understandably raised eyebrows about the strength of the labor market. It will be interesting to see if the consensus of 750 thousand is on target – an overperformance will trigger speculation about an imminent Fed taper, while a massive miss would likely delay a taper. This means that the NFP should be viewed as a market-mover for the US dollar.
Ahead of the NFP release, Fed members Raphael Bostic and Mary Daly will deliver speeches later today. Bostic is hawkish and recently said it was “reasonable” to commence tapering in October. Day is more of a centrist, so if her remarks indicate a move in either direction, the markets, and the US dollar could respond.
USD/CHF Technical
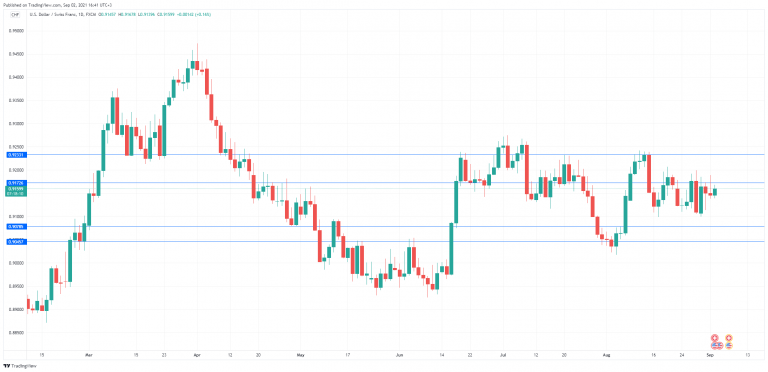
- On the upside, 0.9172 remains under pressure in resistance. Above, there is resistance at 0.9233
- There is support at 0.9078. Close by, there is support at 0.9045
Sunset Market Commentary
Markets
Earlier this week, bond investors cautiously adapted positions pondering the chances for a gradual reduction of bond buying, both at the ECB and the Fed. Regarding ECB tapering, the move was inspired by an unexpected jump of the EMU August headline inflation to 3.0% and some subsequent hawkish comments. In the US, the tapering debate will be guided by the US labour market data. At the Jackson Hole Symposium end last week, Fed Chair Powell indicated that the ‘substantial further progress’ test was met for inflation. For maximal employment, the Fed (Chair) wants confirmation from the upcoming labour market data. In this context, yesterday’s big miss in the August ADP private job creation killed an admittedly mild rise in US yield. The European interest rate market this time didn’t disconnect anymore and joined the modest, US driven setback. Today’s data calendar was not strong enough to revive the market dynamics ahead of tomorrow’s key US payrolls report. Still EMU July PPI inflation rose a faster than expected 2.3% M/M and 12.1% Y/Y. The release hardly left any trace on European (interest rate) markets. The same applied for a marginally better than expected US weekly jobless claims (340k from 354k vs 345k expected). In technical trading, US yields are easing less than 1 bp. Contrary to what was the case of late, Bunds outperformed with yields returning a very small part of recent rise (-1.5 bp for 10-y yield). A similar range trading patter developed in European equities, with indices wavering near unchanged levels. The S&P and the Nasdaq continue to set daily record levels, admittedly at a snail’s pace. The post-OPEC+ setback in the oil prices was short-lived. Bent is holding well above the $ 70 p/b reference (currently 72.40).
Trading in the major currency cross rates didn’t deviate the lethargy on interest rate markets. The dollar is holding near recent correction lows with the DXY index at 92.44. The US currency probably needs convincing payrolls to prevent further losses. At the same time, the euro easily maintains recent gains. EUR/USD is changing hands in the 1.1850 area. EUR/JPY (130.40) still follows the established uptrend channel. The 130.50/55 resistance area is coming with reach. EUR/GBP is holding near the 0.86 area, but also in this cross rate a meaningful technical break isn’t in the cards today.
News Headlines
Switzerland published a slew of key economic variables today. Inflation accelerated in August, from 0.5% y/y (0.1% m/m) to 0.8% y/y (0.5% m/m), the fastest pace since 2019. Core inflation was a more muted 0.4% y/y (up from 0.2%). Sector-wise, services inflation stood at 0.5% y/y (from 0.3%) and inflation in the goods sector rose from 1.3% to 1.4%. Base effects skewed the yearly figure to the upside but monthly dynamics showed a positive impact also from clothing and shoes, education, restaurants and housing rent. Swiss GDP expanded 1.8% q/q in 2021Q2, to be 7.7% higher y/y, after contracting 0.4% q/q (-0.7% y/y) in Q1. The economy is now just an inch away from reaching pre-pandemic levels. Government consumption grew a very strong 5.5% q/q, outpacing that of households (4.1% q/q). Investments recovered from a dip in Q1 with 1.6% growth. Net exports’ contribution to the Q2 GDP was positive.
The UN’s Food and Agriculture Organization said world food prices rose again in August after two consecutive months of declines. The index (127.4) is now close to the decade-high reached in May this year (127.85). The sugar index rose 9.6% from July over concerns of frost damage to crops in world’s largest sugar exporter, Brazil. Vegetable oil prices advanced 6.7%, driven by historic highs for palm oil while rapeseed oil and sunflower oil also rose further. The FAO’s cereal price index was also 3.4% higher in August, the organization said, with, a.o. lower harvest expectations pushing prices of wheat by 8.8% m/m.
Canada’s Trade Surplus Shrinks in July on Lower Commodity Exports, Higher Imports
Canada recorded a merchandise trade surplus of $778 million in July, down from a surplus of $2.6 billion in June. Merchandise exports increased a modest 0.6% (m/m), but imports grew at a much larger 4.2% pace. Stripping away price effects, the picture was more disappointing. Export volumes fell 0.3%, whereas import volumes increased 1.9%.
Despite the modest overall increase in exports, growth was relatively broad-based, spanning 7 of the 11 industries. Exports of motor vehicles and parts (+6.4%) contributed the most to the nominal headline increase. This was complemented by solid performances in the energy (+1.9%), electronic and electrical equipment and parts (+7.9%), and aircraft and other transportation equipment (+8.3%) industries, among others. These increases were offset by a sizeable drop in exports of forestry products and building and packaging materials (-12.7%), primarily as a result of lower lumber prices.
Imports rose in 9 of the 11 industries, led by a massive increase in motor vehicles and parts (+21.1%). Imports of electronic and electric equipment and parts (+8.5%) were also strong. Lower imports of consumer goods (-5.3%), largely as a result of a slump in imports of pharmaceutical products, provided some offset to the overall headline increase.
In a separate release, Statistics Canada revealed that services exports were up 1.2% on the month, whereas imports increased 3.7%.
Key Implications
Add today's international trade report to the list of recent negative economic surprises suggesting that the Canadian economy hit a soft patch in the beginning of the third quarter. But despite the overall negative implications of the report, not all the details were gloomy. For instance, the strong increase in imports points to improved domestic demand during the month. Several industries also showed solid export growth.
Despite still-positive manufacturing sentiment in the U.S. and Canada (as revealed by recent PMI releases in both countries), exports remain susceptible to continued volatility in the months ahead on the back of supply chain disruptions and emerging risks to demand. On the supply side, shipping costs remain elevated, and a major auto manufacturer has recently announced production cuts in North America due to component shortages. Meanwhile, demand and consumer confidence may be prone to some downside risks as a result of the delta-variant driven increase in cases and hospitalizations in some countries.
U.S. Trade Deficit Narrows in July, Reflecting the Rebalancing in Consumer Spending
The U.S. trade deficit narrowed to $70.1 billion in July from $73.2 billion in June. Total exports (goods and services) increased by 1.3% (+0.6% in June), while imports pulled back 0.2% (+2.2% in June).
Goods exports increased by 1.8% in July (0.2% in June). The gains were broad based and led by automotive vehicles, parts and engines (+5.3%), consumer goods (+4.5%, excluding automotive), and capital goods (+2.2%). Accounting for price changes, real goods exports rose by 1.0 %.
Goods imports decreased by 1.1% (compared to a 1.8% increase in June). Most product categories registered contractions, pulled down by consumer goods (-3.4%, excluding automotive) and industrial supplies and materials (-2.9%). Automotive vehicles, parts and engines (+3.8%) and other merchandise (+3.5%) were the main gainers for the months. Excluding price changes, real imports fell 1.4% in July.
Exports of services expanded by 0.1% on the month (1.7% in June), while imports of services grew by 5.5% (4.3% in June).
Key Implications
The U.S. trade deficit narrowed in July for only the second time this year. Even with the narrowing, imports were 14.8% above pre-pandemic (February 2020) levels, while exports were 3.9% higher.
While activity in the traded goods sector surged during the pandemic, services struggled. There's still a long way to go for services trade to recover as both imports and exports are 1.0% and 7.1% below pre-pandemic levels, respectively.
The pandemic set off a shift in demand towards goods that is still in the process of rebalancing. Consumers have been moving spending back to services since March but normal is still a long way off. July's data showed services spending made up 65.4% of consumer expenditures, down from 69.2% before the pandemic. As normalization continues the trade deficit should continue to narrow through the remainder of the year.
USD/JPY Mid-Day Outlook
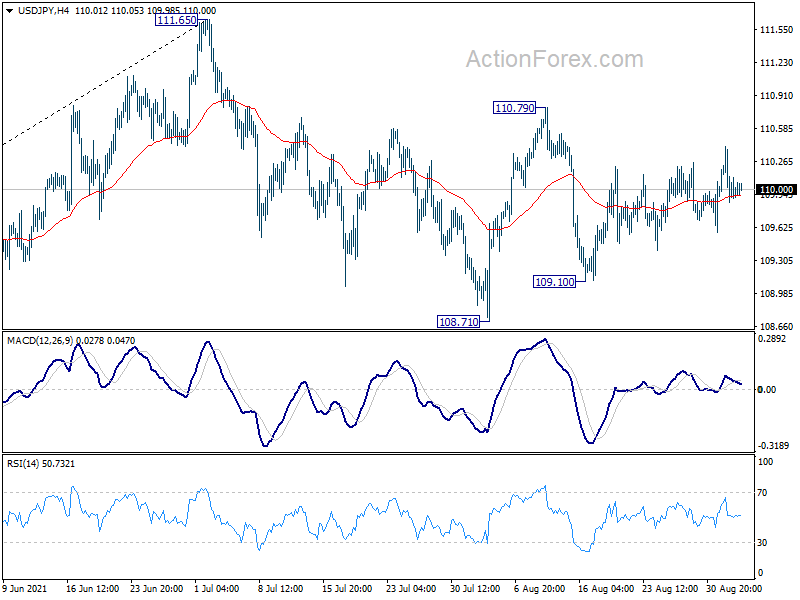
Daily Pivots: (S1) 109.81; (P) 110.11; (R1) 110.35; More...
USD/JPY is staying in sideway trading and intraday bias remains neutral first. On the downside, break of 109.10 will target 108.71 support first. Firm break there will resume the decline from 111.65 and target 38.2% retracement of 102.58 to 111.65 at 108.18 next. On the upside, break of 110.79 will resume the rebound from 108.71 to retest 111.65 high.
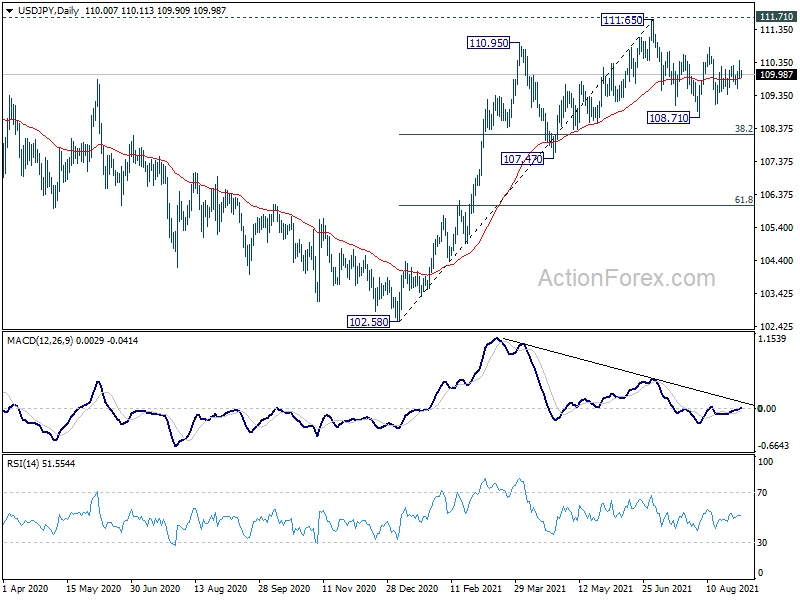
In the bigger picture, medium term outlook is staying neutral with 111.71 resistance intact. The pattern from 101.18 could still extend with another falling leg. Sustained trading below 55 day EMA will bring deeper fall to 107.47 support and below. Nevertheless, strong break of 111.71 resistance will confirm completion of the corrective decline from 118.65 (2016 high). Further rise should then be seen to 114.54 and then 118.65 resistance.
USD/CHF Mid-Day Outlook
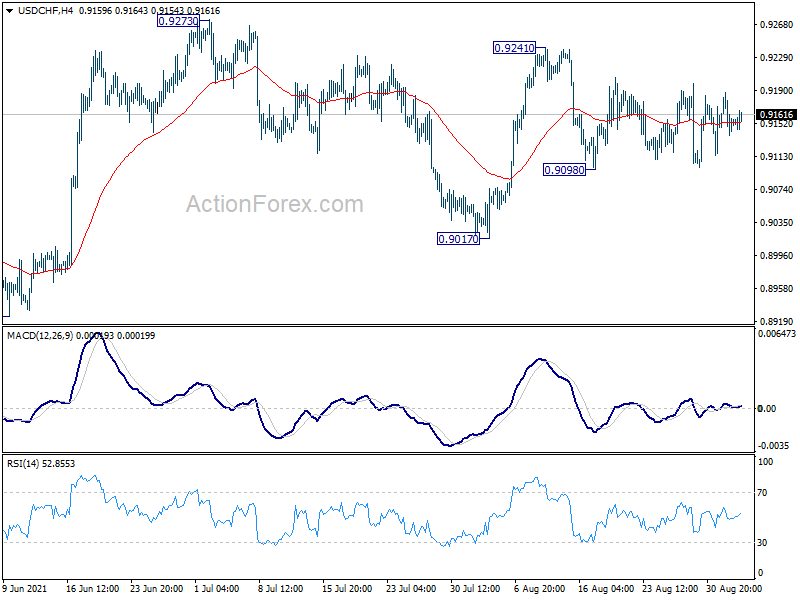
Daily Pivots: (S1) 0.9135; (P) 0.9162; (R1) 0.9185; More....
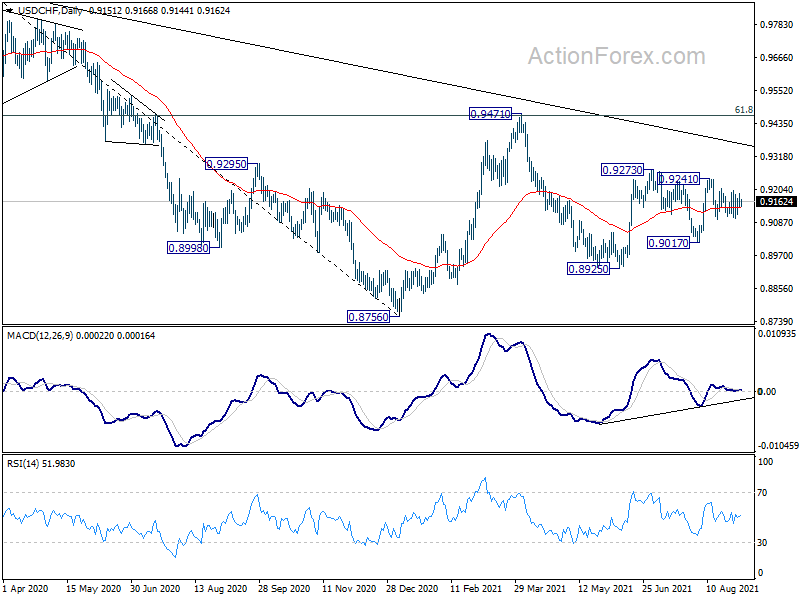
USD/CHF is still bounded in sideway trading and intraday bias remains neutral first. On the downside, break of 0.9098 will target 0.9017 support first. Further break there will likely resume the decline from 0.9471 through 0.8925 low. On the upside, break of 0.9241 resistance should resume the rise from 0.8925 through 0.927.
In the bigger picture, the failure to sustain above 55 week EMA (now at 0.9176) retains medium term bearishness in USD/CHF. Break of 0.8925 support should resume the whole decline form 1.0342 (2016 high) through 0.8756 low. However, break of 0.9273 resistance and sustained trading above 55 week EMA will be an early sign of bullish trend reversal. Focus will then turn to 0.9471 resistance for confirmation.