Sample Category Title
The Dollar Index Is Declining Amid Weak Labor Market Data From ADP
September started with renewed buying of tech stocks, which helped the Nasdaq index add 0.33% and close at a new peak yesterday. The Dow Jones industrial index decreased by 0.14%. The S&P 500 index stayed about the same. The national employment report from ADP showed that the US private sector jobs increased by 374,000 in August compared to 326,000 in July, which is much less than the forecast of 613,000. Such statistics have negatively affected the dollar index. Now, investors are waiting for the report on initial jobless claims and non-farm payrolls. If these reports are also lower than the expectations, most likely, the quantitative easing (QE) program will remain unchanged till the end of the year, and the dollar index is heading to a strong decline.
Most European stock indices rose yesterday but closed without a single dynamic. The British FTSE 100 increased by 0.4%, French CAC 40 jumped by 1.2%, Italian FTSE MIB added 0.7%, Spanish IBEX 35 jumped by 1.6%. However, the German DAX decreased by 0.1%. In Germany, shares of tire maker Continental (-2%), real estate company Vonovia (-1.5%), and chemical company BASF (-1.4%) declined the most. European Central Bank Vice President Luis de Guindos said in an interview with Spain's El Confidencial that Eurozone economies are performing better than expected in 2021, and these improvements will be reflected in further economic forecasts.
Two major factors affected oil prices yesterday. On the one hand, OPEC+ countries agreed to support the current plan to gradually increase supply by 400,000 bpd, which plays in favor of lower oil prices. On the other hand, the US government report on crude oil reserves showed a larger-than-expected drop in inventories, which would push the price up as oil demand remains at a high level. As a result, the oil price fell during the US session, suggesting that the market is paying more attention to the OPEC+ agreement than to oil inventories.
Natural gas continues to set price records. Natural gas inventories reports are expected today. A drop in inventories could lead to even more growth, as the demand is now much higher than supply.
Gold prices haven’t changed much compared to the previous day. The fundamental picture for gold is now in favor of growth, as the soft monetary policy from the Federal Reserve leads to lower US Treasury bond yields, and gold has an inverse correlation to this indicator.
Asian stock indices are trading without a single dynamic. Asia-Pacific's broadest index outside Japan, the MSCI, decreased by 0.2% from a five-week high. Japan's Nikkei added 0.2%, and South Korea's KOSPI lost 0.9%. Bank of Japan member Goushi Kataoka says that the Bank of Japan is ready to increase stimulus if a new wave of coronavirus affects the economic recovery. Japan should not lag behind other countries in supporting the economy with ultra-soft monetary policy.
Main market quotes:
- S&P 500 (F) 4,524.09 +1.41 (+0.03%)
- Dow Jones 35,312.53 −48.20 (−0.14%)
- DAX 15,824.29 −10.80 (−0.07%)
- FTSE 100 7,149.84 +30.14 (+0.42%)
- USD Index 92.52 −0.11 (−0.11%)
Important events for today:
- US Initial Jobless Claims at 15:30 (GMT+3);
- US Natural Gas Storage (w/w) at 17:30 (GMT+3).
CAD/JPY Bulls Could Prevail
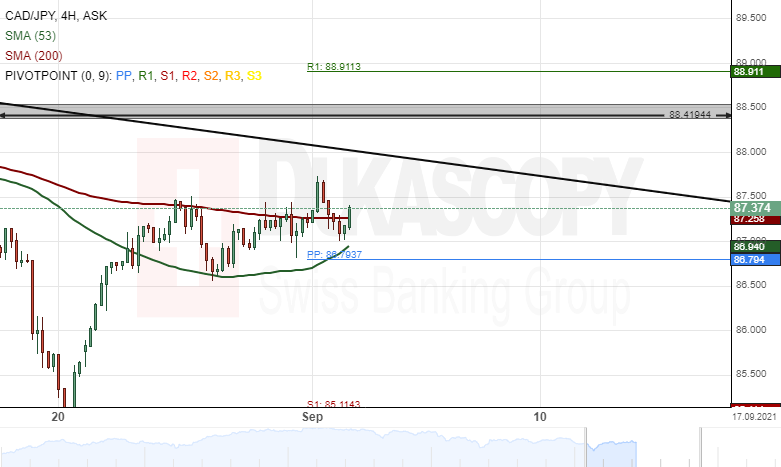
Since August 20, the Canadian Dollar has edged higher by 3.32% against the Japanese Yen. The currency pair breached the 87.50 resistance level during this week's trading sessions.
Buyers are likely to continue to push the price higher during the following trading sessions. The potential target for the exchange rate would be near the weekly resistance level at 88.91.
However, the upper boundary of a descending channel pattern near the 88.00 area could provide resistance for the CAD/JPY currency exchange rate this week.
AUD/JPY Bullish Trend Likely To Continue
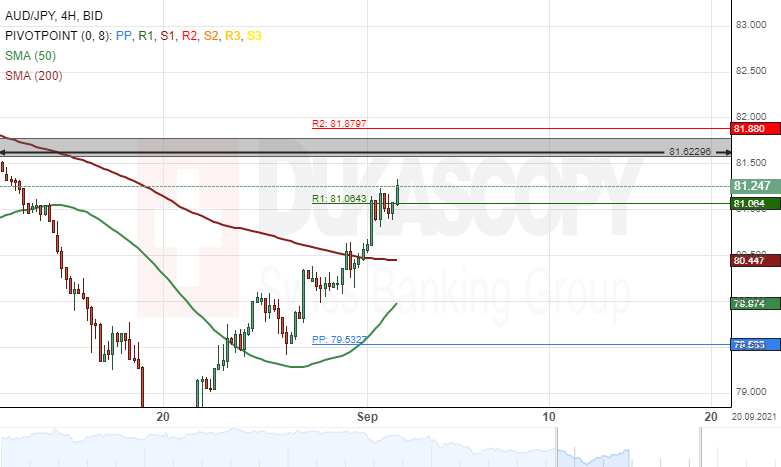
During the last two weeks, the Australian Dollar has risen by 3.77% against the Japanese Yen. The AUD/JPY currency pair breached the 50– and 200– period SMAs last week.
All things being equal, the exchange rate could continue to trend bullish during the following trading sessions. A potential breakout through the resistance level at 81.62 could occur this week.
However, if the resistance at 81.62 holds, the currency exchange rate would make a pullback towards the weekly pivot point at 79.53 during the coming week.
Gold Analysis: Trades Sideways
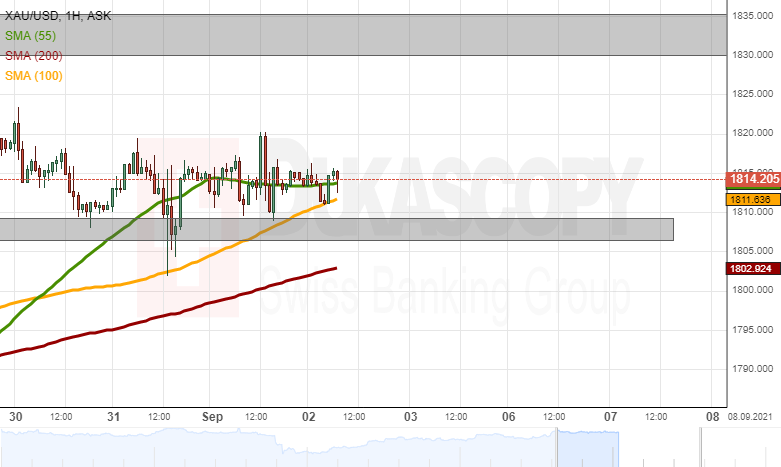
The yellow metal has continued to trade in the 1,810.00/1,815.00 zone. However, on Wednesday, a USD drop was caused by the US ADP payrolls. The event created a test of the 1,820.00 price level for gold. The 1,820.00 mark provided resistance and the bullion returned to trade in the previous zone.
Meanwhile, on Thursday morning, the 100-hour simple moving average caught up with the price. If the SMA provides enough support for a surge to start, the price would test the resistance of the 1,820.00 level. A breaking of the 1,820.00 level most likely could result in a test of the high level zone at 1,830.00/1,835.00.
On the other hand, a decline of the rate below the 55 and 100-hour SMAs and the 1,810.00 level would look for support in the 200-hour simple moving average at 1,803.00.
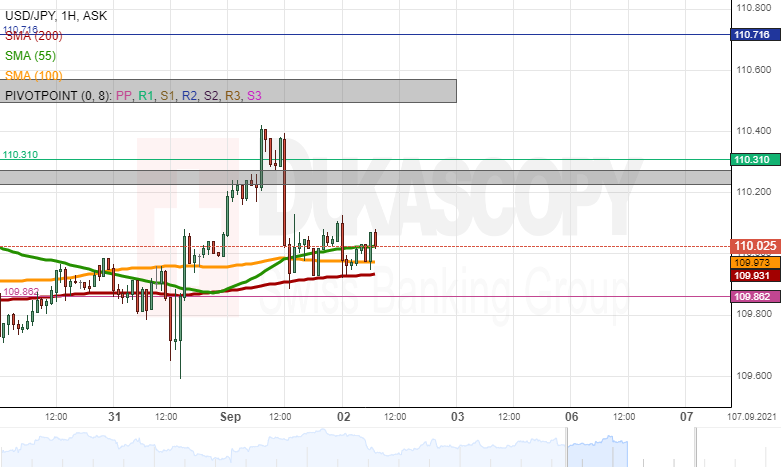
USD/JPY Analysis: Bounces Off 110.40
As the rate was testing the resistance of the 110.40 level, the US ADP payrolls caused an all out USD drop. On the USD/JPY charts it resulted in a decline to the support of the 200-hour simple moving average at 109.90. By the start of Thursday's European trading hours, the SMA was still keeping the rate up, as it tested its support three times.
If the SMA manages to hold and a surge follows, the rate could once again reach the 110.40 level and test its resistance. Above the 110.40 mark, the 110.50 level and the zone above it might provide resistance.
Meanwhile, a decline below the SMA could look for support in the weekly simple pivot point at 109.86. However, note that previously the pivot point failed to provide support. Due to that reason, a potential decline would most likely find support in the 109.60 level.
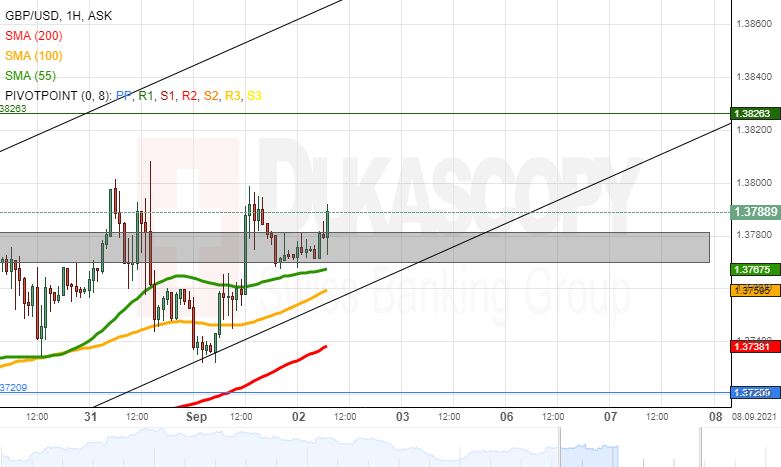
GBP/USD Analysis: Once Again Tests 1.3800
The rate surged and passed resistance levels on Wednesday, as the US ADP payrolls caused a decline of the USD. The surge of the GBP/USD was stopped by the 1.3800 level. A follow up decline eventually found support in the 55-hour simple moving average near 1.3765.
In the case that the 55-hour simple moving average pushes the rate up, the GBP/USD would most likely once again test the 1.3800 level. If a potential fourth test of the 1.3800 level manages to break its resistance, the pair could reach for the weekly R1 simple pivot point at 1.3826.
However, a failure of the 55-hour SMA to push the rate up, might result in a decline to the support of the 100-hour SMA near the 1.3760 level. Below the SMA, the lower trend line of a channel up pattern would provide support.
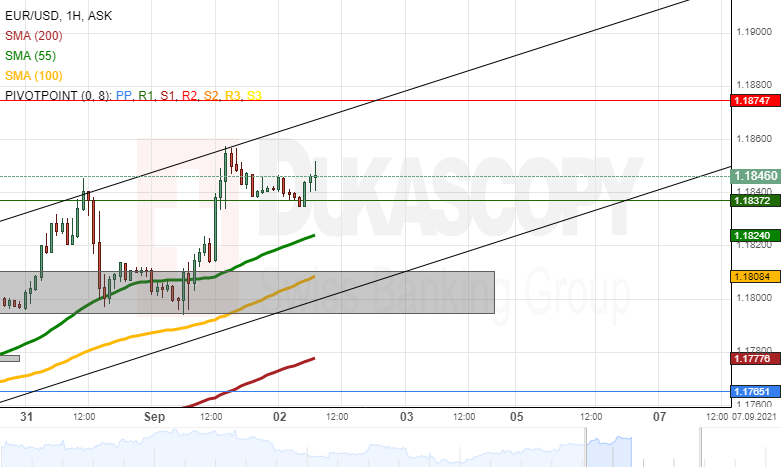
EUR/USD Analysis: Follows Pattern
The release of US ADP payrolls caused an all-out decline of the US Dollar. Due to that reason, the EUR/USD currency exchange rate began a surge. The surge reached the upper trend line of the channel up pattern, which had guided the rate since August 19.
On Thursday, the rate had retreated and traded sideways, as previous gains were being consolidated.
In the case that the pair resumes its surge, the EUR/USD would aim at the resistance of the weekly R2 simple pivot point at 1.1875. In the meantime note the upper trend line of the channel up pattern. Note that a surge could be caused by the support of the 55 and 100-hour simple moving averages.
On the other hand, a possible decline of the pair could look for support in the mentioned SMAs near 1.1825 and 1.1810. Below the SMAs, the 1.1800 level and the zone surrounding it could provide support.
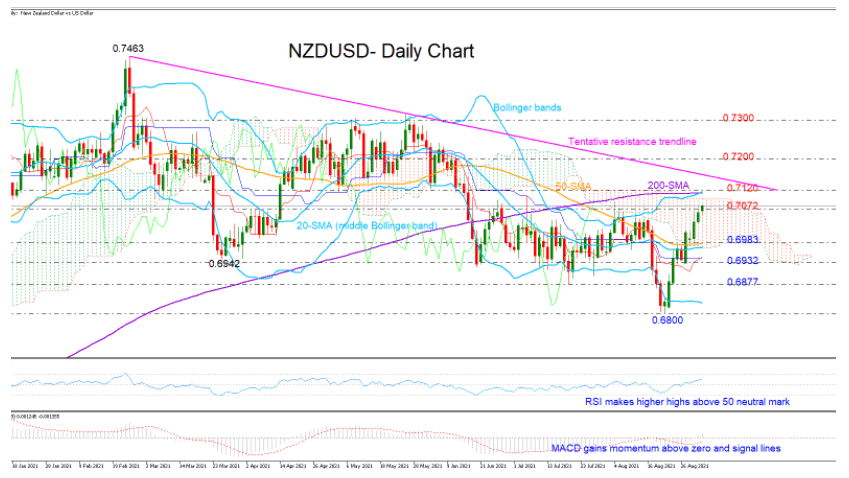
NZDUSD Enters Restricted Zone, Short-Term Bias Bullish
NZDUSD has been one of the best performers among major FX pairs this week, extending its bullish run to an almost one-month high of 0.7075 after finding support near the 50-day simple moving average (SMA).
The market action is currently taking place around the crucial resistance of 0.7072, while within breathing distance, the 200-day SMA at 0.7120 and a tentative descending trendline at 0.7145 is another key wall, which the bulls need to knock down in order to speed up towards the 0.7200 number. Beyond the latter, the spotlight will shift to the 0.7300 level.
According to the momentum indicators, upside pressures could persist in the short term as the RSI has overcome its July peak and is strengthening comfortably above its 50 neutral mark. The MACD continues to gain ground within the positive area and above its red signal line, while the price itself has still some way to go to reach the upper Bollinger band, both adding to the bullish signals.
Nevertheless, if the 0.7072 - 0.7120 area proves hard to escape, the pair could revisit the 50-day SMA at 0.6983. If this floor cracks, the next stop could be around last week’s support of 0.6932, while lower, the bears will need to close below 0.6877 before they head for the 0.6800 bottom.
In brief, NZDUSD is expected to gather additional buying interest in the short term. A clear move above the 200-day SMA and the resistance trendline could add more fuel to the rally.
Dollar Retreats, Markets Concerned Over Weak US Data
US indices little changed on Wednesday, and Asian markets retreated from 5-week highs on mixed US data. Markets and economies are often on opposite sides of the barricades. They sometimes welcome weaker data as it suggests ultra-soft policy remains in place, just like now. But sometimes, it is necessary to look at the situation through the eyes of an economist. With this approach, weak data is a negative, and yesterday was something to look at.
Worryingly, a weak ADP report showed that the private sector created only 374K jobs in August against an expected 640K. According to this metric, another 6 million people need to be hired to return to the February 2020 peak. So, it takes another 12 months at the average rate seen year to date (+480K monthly).
The ISM manufacturing index rose from 59.5 to 59.9, higher than expected. But within the index, the employment component fell below the waterline to 49, reflecting contraction. The slowdown in price growth is shown by a 6.3 point drop in the corresponding element. Such figures create room for the Fed to take its time with the unwinding of stimulus.
US car sales fell to an annual rate of 13.1M in August compared with 14.8M a month earlier and a peak of 18.5M in April this year. For the most part, it's a matter of a shortage of some models due to chip supply issues, which is pulling up the average price of new cars by 16%. That said, we can see that the higher price is, as textbook, reducing demand.
Today it is worth keeping an eye on the weekly jobless claims data with heightened interest. The markets are waiting for a smooth improvement in the figures. A continuation of jobless claims at the current levels or an increase could increase fears for the US causing a sell-off in the dollar. If there is substantial progress like a month ago, it will bring back optimism about the jobs report and provide support for the dollar.
Daily Technical Analysis
EUR/USD
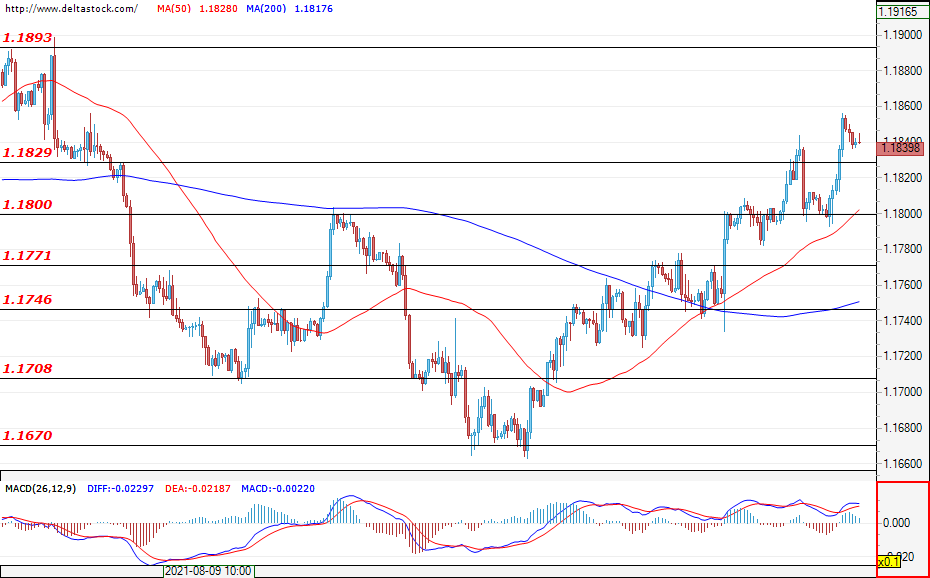
Current level - 1.1839
Following an unsuccessful test at the resistance level of 1.1829 and a short consolidation around 1.1800, the currency pair made another attempt to breach the mentioned resistance and the second test was successful. The forecast is for the bulls to build up the momentum and approach the next resistance level of 1.1893. In the negative direction, the first support lies at 1.1800. Today, increased activity can be expected around the announcement of the data on the initial jobless claims for the United States at 12:30 GMT.
| Resistance | Support | ||
| intraday | intraweek | intraday | intraweek |
| 1.1890 | 1.1890 | 1.1800 | 1.1746 |
| 1.1950 | 1.1950 | 1.1770 | 1.1700 |
USD/JPY
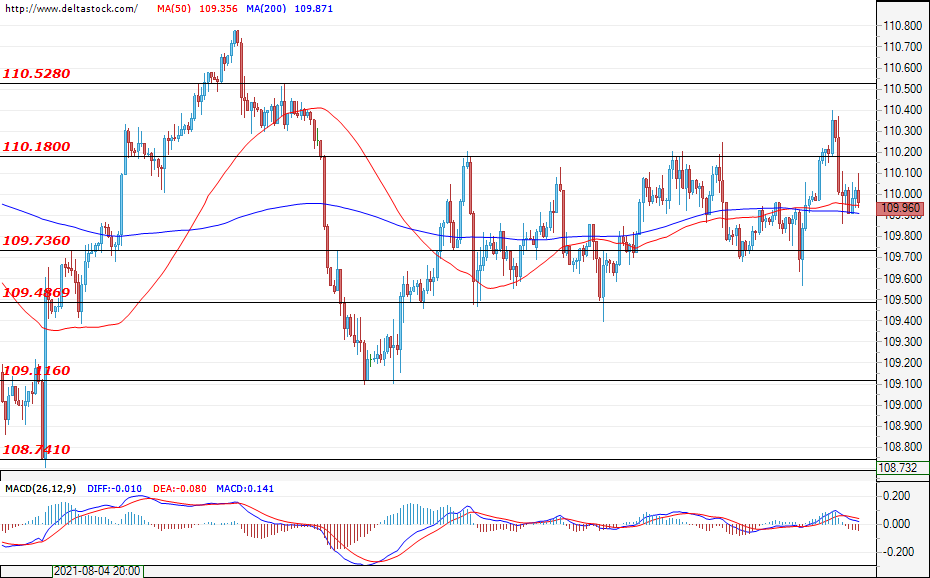
Current level - 109.96
The fleeting breach of the resistance and an upper border of the range, in which the currency pair has been trading for about a week now, at 110.18, wasn't confirmed and the price quickly bounced back into the range between 109.48 and 110.18. Neither the bears, nor the bulls manage to prevail and breach either of the borders of the range, which would set a direction for the future movement of the Ninja.
| Resistance | Support | ||
| intraday | intraweek | intraday | intraweek |
| 110.18 | 110.52 | 109.73 | 109.11 |
| 110.52 | 111.00 | 109.48 | 108.74 |
GBP/USD
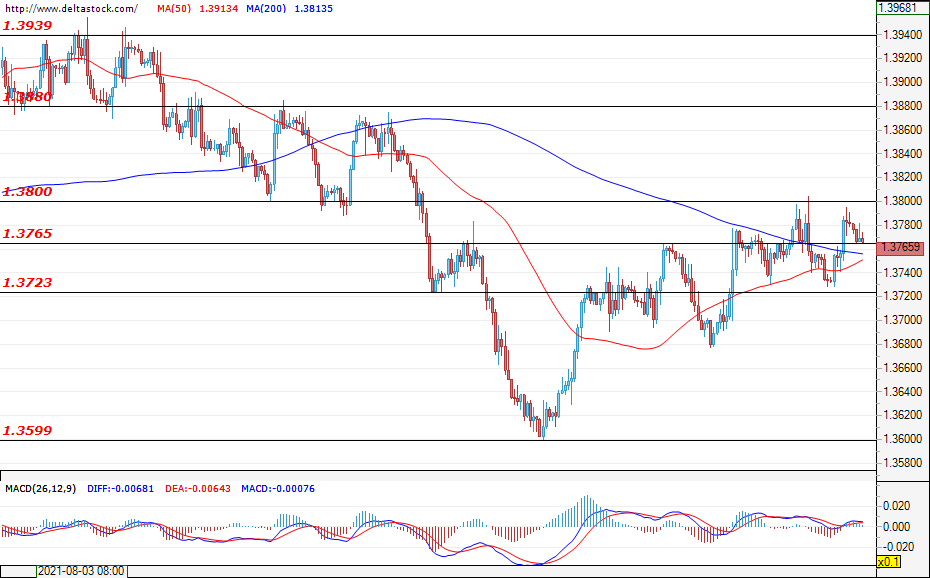
Current level - 1.3765
At the time of writing the analysis, the Cable is testing the support level of 1.3765. In case the bears don't manage to violate this level, this would signal an upward movement and a test at the resistance at 1.3800, possibly followed by a test at 1.3880. However, if the support at 1.3765 is violated, then the minor support at 1.3732 would be the next target for the bears, before they approach the main support at 1.3600.
| Resistance | Support | ||
| intraday | intraweek | intraday | intraweek |
| 1.3800 | 1.3880 | 1.3765 | 1.3567 |
| 1.3880 | 1.3939 | 1.3723 | 1.3508 |