Sample Category Title
EUR/JPY Daily Outlook
Daily Pivots: (S1) 128.69; (P) 128.87; (R1) 129.13; More....
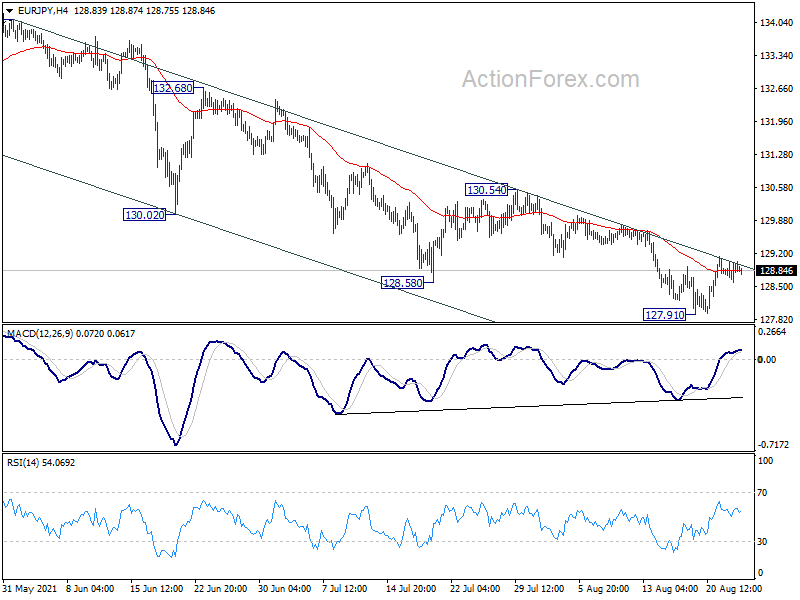
EUR/JPY is staying in consolidation from 127.91 temporary low and intraday bias remains neutral first. Further decline is expected as long as 130.54 resistance holds. On the downside, break of 127.91 will target 127.07 resistance turned support. That is close to 38.2% retracement of 114.42 to 134.11 at 126.58.
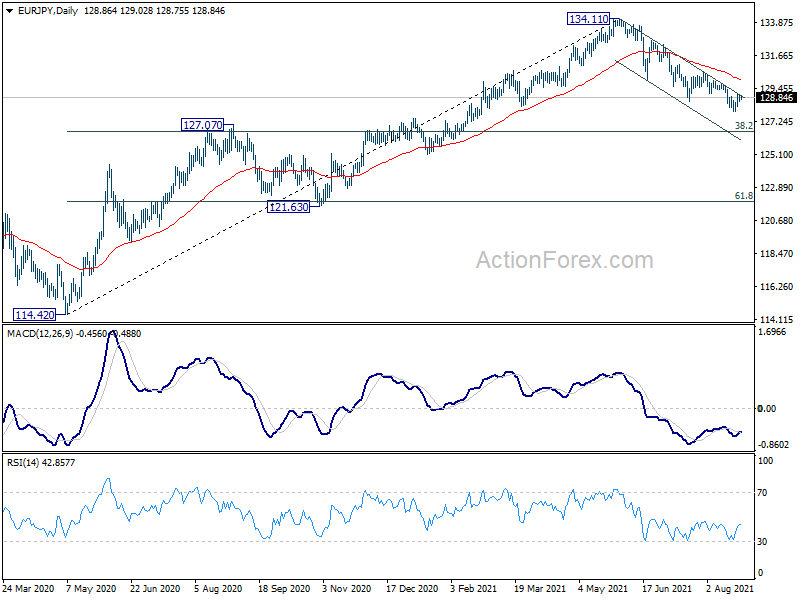
In the bigger picture, rise from 114.42 is seen as a medium term rising leg inside a long term sideway pattern. As long as 127.07 resistance turned support holds, further rise is still expected to retest 137.49 (2018 high). However, firm break of 127.07 will argue that the medium term trend has reversed, deeper fall would be seen to 61.8% retracement of 114.42 to 134.11 at 121.94.
EUR/GBP Daily Outlook
Daily Pivots: (S1) 0.8547; (P) 0.8560; (R1) 0.8577; More...
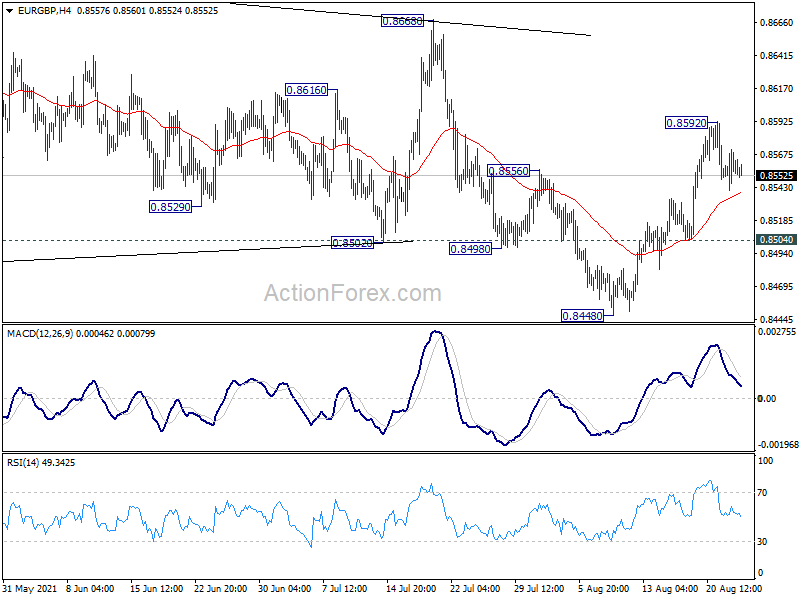
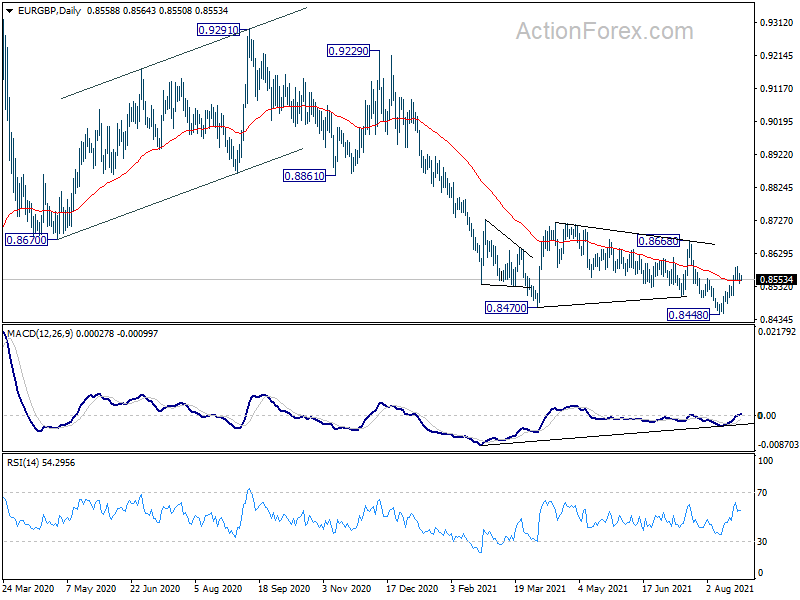
Intraday bias in EUR/GBP stays neutral for the moment. Further rise is in favor as long as 0.8504 support holds. On the upside, break of 0.8592 resistance will resume the rebound from 0.8448 to 0.8668 resistance. Firm break there will be a strong sign of near term bullish reversal at least. However, break of 0.8504 will turn focus back to 0.8448 low instead.
In the bigger picture, price actions from 0.9499 (2020 high) are still seen as developing into a corrective pattern. Deeper fall could be seen as long as 0.8668 resistance holds, towards long term support at 0.8276. However, firm break of 0.8668 resistance would argue that a medium term bottom was already formed. Stronger rise would be seen to 0.8861 support turned resistance to confirm completion of the corrective pattern.
EUR/AUD Daily Outlook
Daily Pivots: (S1) 1.6148; (P) 1.6225; (R1) 1.6276; More...
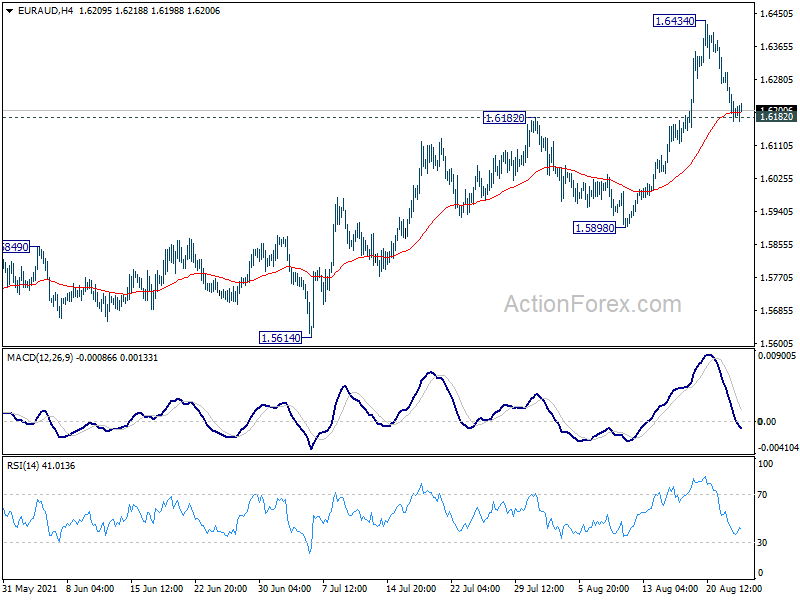
Intraday bias in EUR/AUD remains neutral at this point. Another rise will remain in favor as long as 1.6182 resistance turned support holds. On the upside, break of 1.6434 will resume larger rise from 1.5250 to 1.6827 resistance next. On the downside, though, break of 1.6182 will bring deeper pull back towards 1.5898 structural support instead.
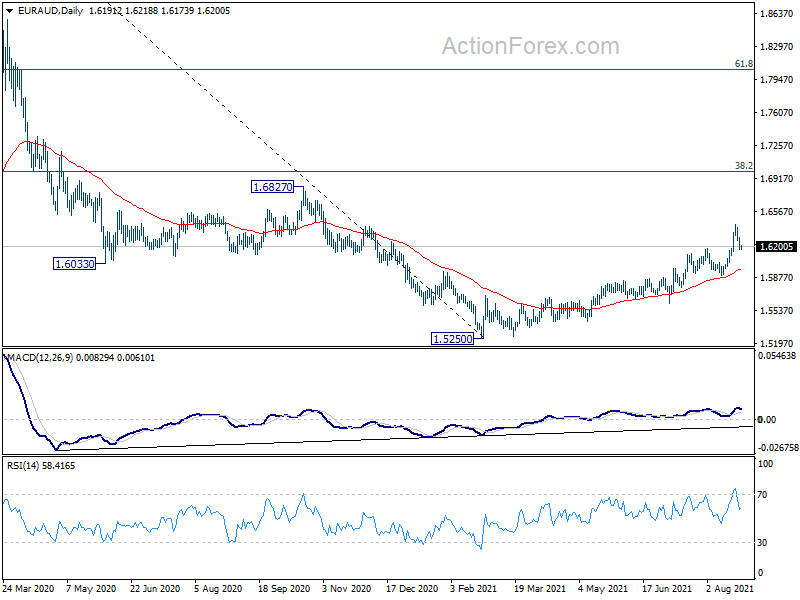
In the bigger picture, rise from 1.5250 medium term bottom is currently seen as a correction to the down trend from 1.9799 first. Stronger rise would be seen to 38.2% retracement of 1.9799 to 1.5250 at 1.6988 next. We'd tentatively expect strong resistance from there to limit upside, at least on first attempt. Meanwhile, break of 1.5898 support will indicate that the rebound has completed and bring retest of 1.5250 low.
XAUUSD Is Possibly Bullish
Technical analysis
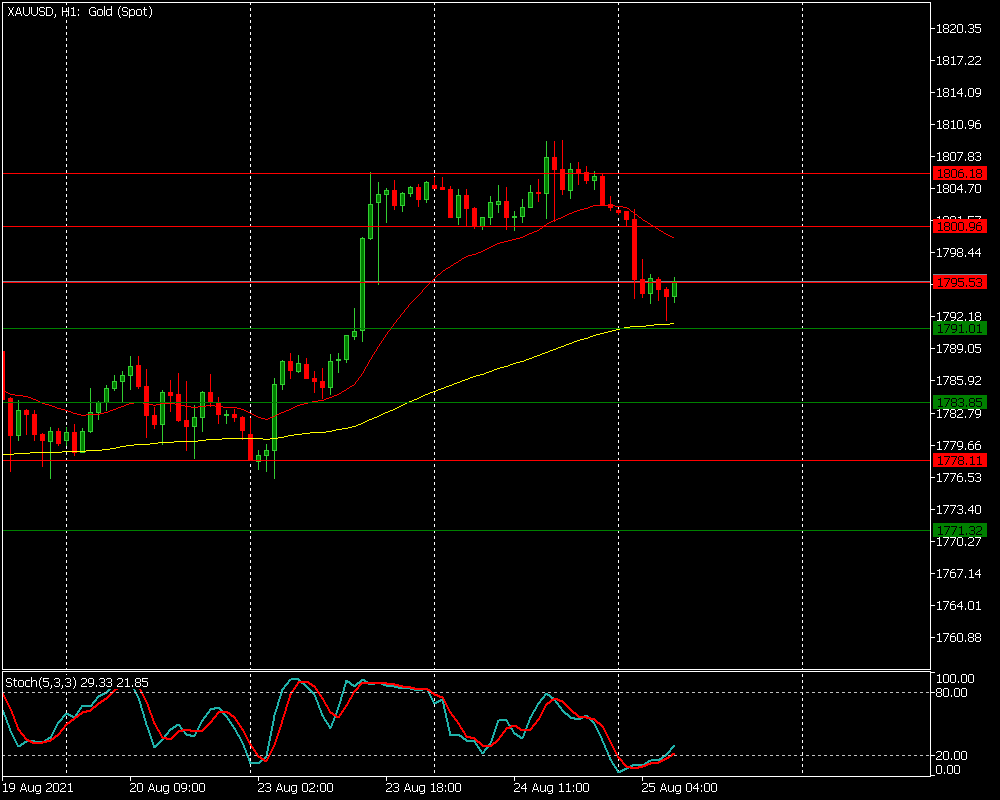
The price supported by MA (120)
The Stochastic indicates a possible correction upward.
What the possible outcomes are
Gold had been caught between mixed signals from Fed officials before the breakout on Monday. Nevertheless, the yellow metal is under pressure ahead of this week’s Jackson Hole Federal Reserve symposium.
In our most likely scenario, XAUUSD may challenge the first resistance level of 1,795.
If the price passes the initial resistance level, it could test the next higher at 1,800 and 1,806.
Contrarily, the pair may fail to break the first resistance level and retreat towards 1,791.
If the pair falls below the first support level, we can expect a downtrend towards 1,783 and 1,778.
Key levels
Support 1,791 1,783 1,778
Resistance 1,795 1,800 1,806
NASDAQ And S&P Soars As Travel And Energy Stocks Roar
US stocks rose to a record high as energy and hospitality industries rallied. The S&P 500 index rose to a record $4,486 while the tech-heavy index rose to $1,019. This was its first close above $15,000 on record. Companies in the hotel, airline, and energy sectors rose as investors remained optimistic that the economy will rebound despite the new Delta variant. Also, they were optimistic about the recent full authorization of the Pfizer vaccine. Meanwhile, meme stocks like GameStop, AMC, and Naked Brand Group popped. AMC and GameStop shares rose by more than 20%. The rally in stocks extended in the futures market after the House passed the $1 trillion infrastructure package and the $3.5 trillion anti-poverty plan.
The New Zealand dollar was little changed after the latest trade numbers from the country. According to the statistics agency, the country exported goods worth more than N$5.75 billion in July, which was slightly below the previous month’s N$5.96 billion. In the same period, exports increased from N$5.71 billion to more than N$6.16 billion. As a result, the trade deficit widened to more than N$1.1 billion. New Zealand extended its lockdown on Tuesday after confirming 41 new cases.
The euro declined slightly as investors waited for the latest German sentiment data by the ifo Institute. These are important numbers that provide an early signal about business investments. Analysts expect the data to show that business sentiment inched down slightly in August as the country faced the current Delta wave. Also, manufactures are still facing substantial labour and parts shortages. Elsewhere, the US will publish the latest core durable goods orders while the Energy Information Administration will release the latest inventories data.
EURUSD
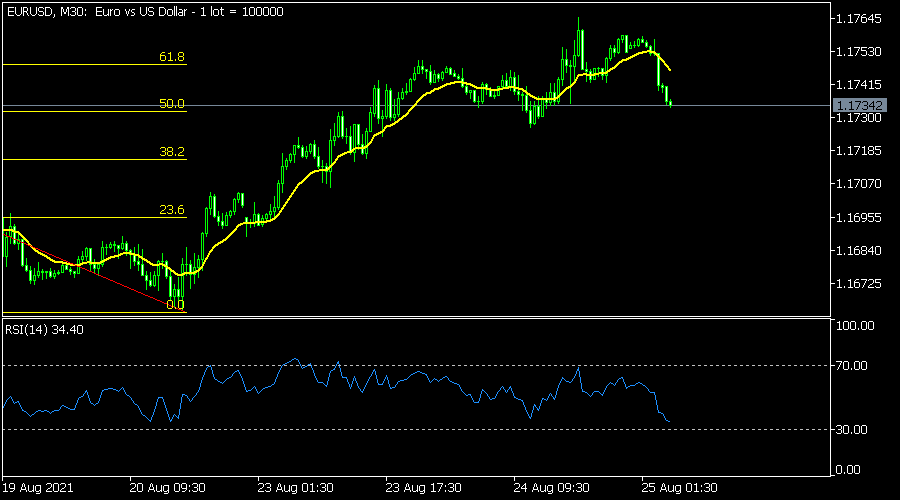
The EURUSD pair declined slightly in the overnight session as the market waits for the Jackson Hole Summit. The pair is trading at 1.1734, which was lower than this week’s high of 1.1765. On the 30-minute chart, the pair has formed what looks like a double-top pattern. It also moved from above the 61.8% Fibonacci retracement to the current 50% retracement level. The Relative Strength Index has also been in a bearish trend. Therefore, the pair will likely keep falling, with the next key target being at the 38.2% retracement level at 1.1715.
NDX100
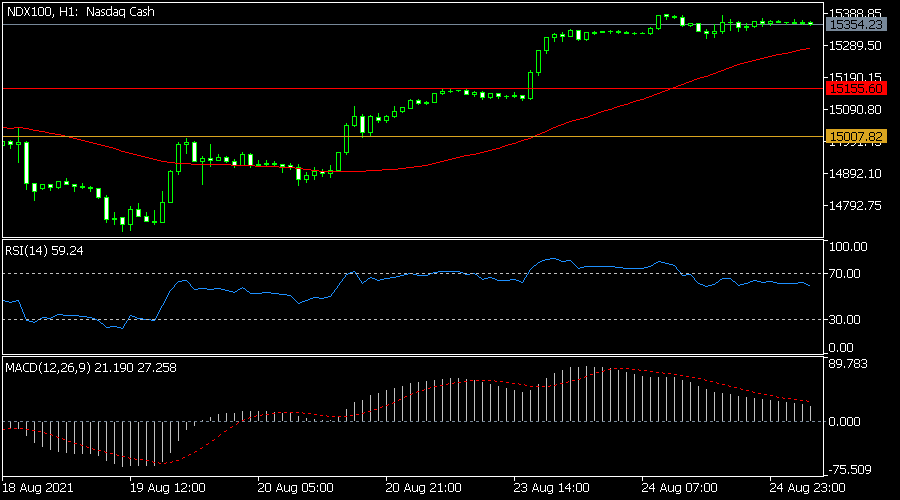
The Nasdaq 100 index rose to an all-time high as the risk-on sentiment returned. Futures tied to the index are trading at $15,352. On the hourly chart, the bullish trend is being supported by the short and longer-term moving averages. At the same time, the MACD and the Relative Strength Index (RSI) have formed a bearish divergence pattern. This is a sign that the bullish trend may be running out of steam. Therefore, there is a possibility that the index will pull back and head towards the key support at $15,155.
XBRUSD
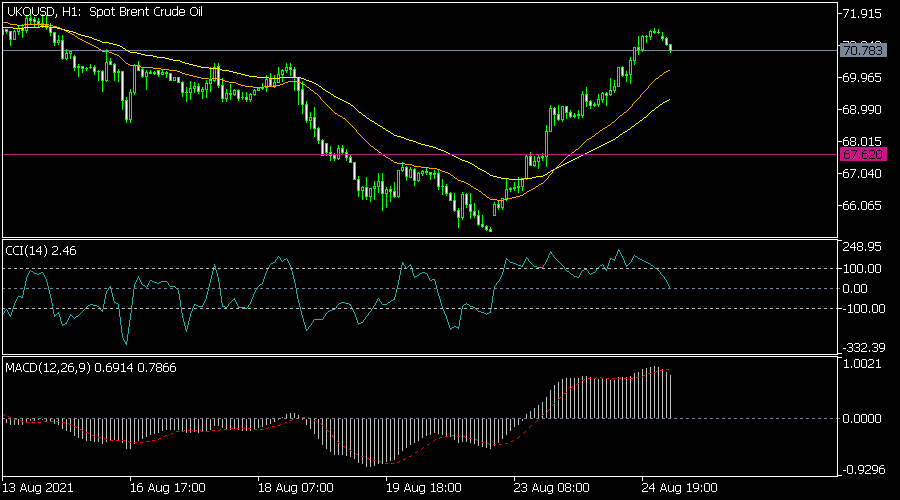
The price of Brent crude oil tilted lower slightly after the relatively weak inventories data. The numbers showed that there was a drawdown of more than 1.65 million, which was lower than the expected 2.3 million. It is trading at 70.85, which was slightly below this week’s high of 71. The pair is above the Ichimoku cloud and the 25-day moving average on the hourly chart. The DeMarker indicator has also moved below the overbought level. Still, the bullish trend is intact, meaning that the price will likely keep rising.
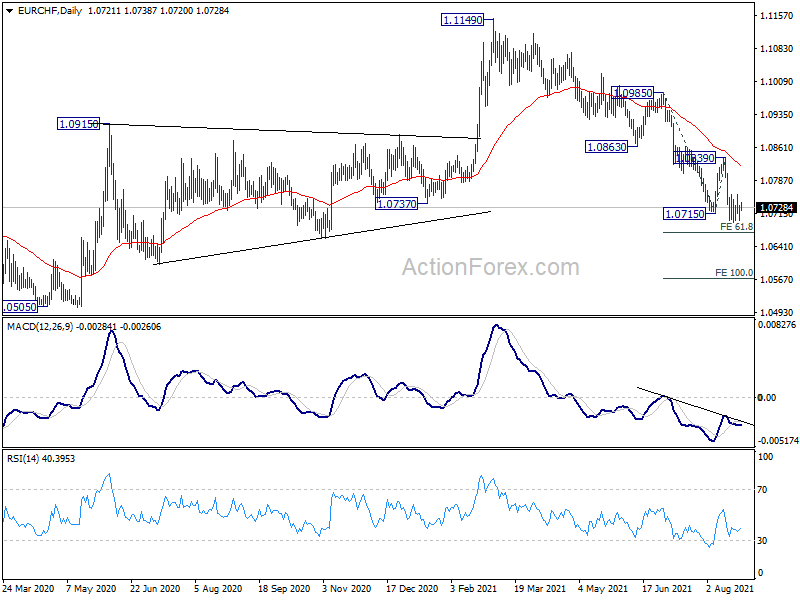
EUR/CHF Daily Outlook
Daily Pivots: (S1) 1.0711; (P) 1.0723; (R1) 1.0745; More....
EUR/CHF is staying in consolidation above 1.0694 temporary low and intraday bias remains neutral first. With 1.0839 resistance intact, outlook remains bearish for further decline. On the downside, break of 1.0694 will resume larger fall from 1.1149. Next target is 61.8% projection of 1.0985 to 1.0715 from 1.0839 at 1.0672 first. Break will target 100% projection at 1.0569 next.
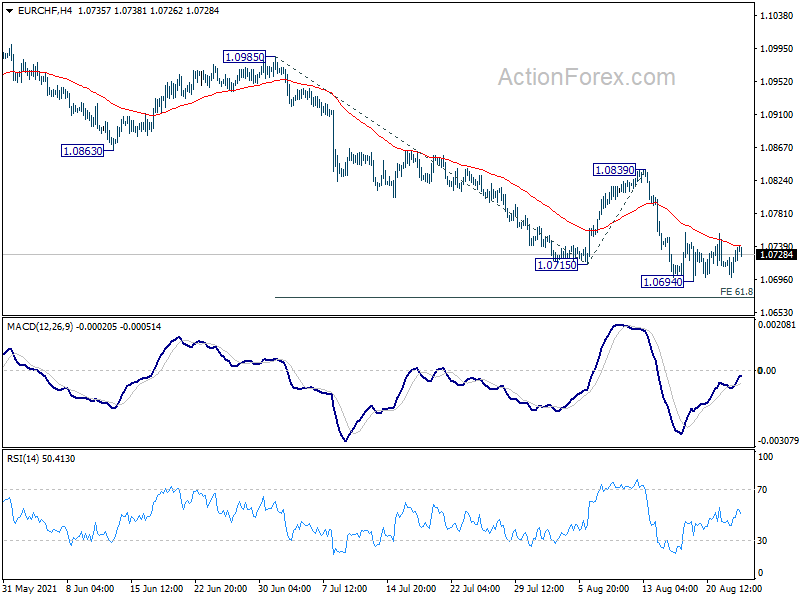
In the bigger picture, rebound from 1.0505 (2020 low) should have completed at 1.1149 already. The three-wave corrective structure argues that the downtrend from 1.2004 (2018 high) is not over yet. Medium term outlook will now stay bearish as long as 55 week EMA (now at 1.0863) holds. Break of 1.0505 low would be seen at a later stage.
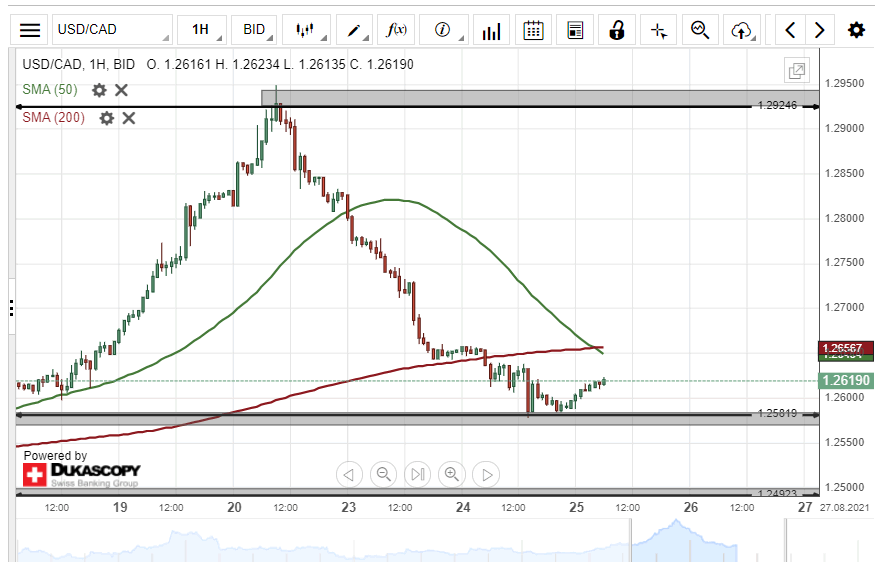
USD/CAD Bounces Off Support
On Tuesday, the US Dollar declined by 72 pips or 0.57% against the Canadian Dollar. The USD/CAD currency pair tested the 1.2581 level during yesterday's trading session.
Technical indicators suggest buying signals on the daily time-frame chart. Most likely, the USS/CAD exchange rate could edge higher during the following trading session.
However, bullish traders might encounter a resistance cluster at 1.2655 within Tuesday's session.
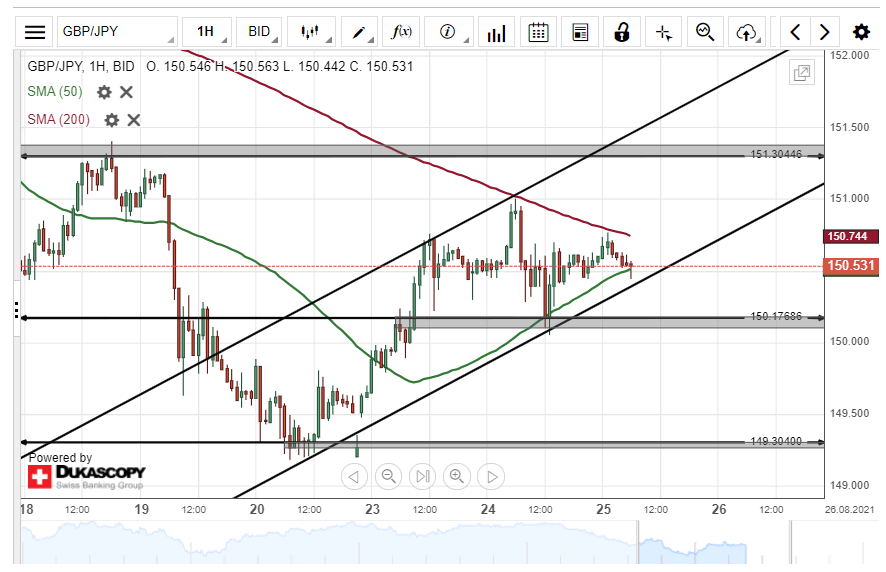
GBP/JPY Bears Could Prevail
On August 24, the British Pound fell by 74 pips or 0.49% against the Japanese Yen. The decline was stopped by the 50– hour simple moving average during Tuesday's trading session.
Technical indicators suggest selling signals on the daily time-frame chart. Most likely, the GBP/JPY exchange rate could continue to edge lower during the following trading session.
However, the 50– hour SMA could still provide support for the currency exchange rate within this session.
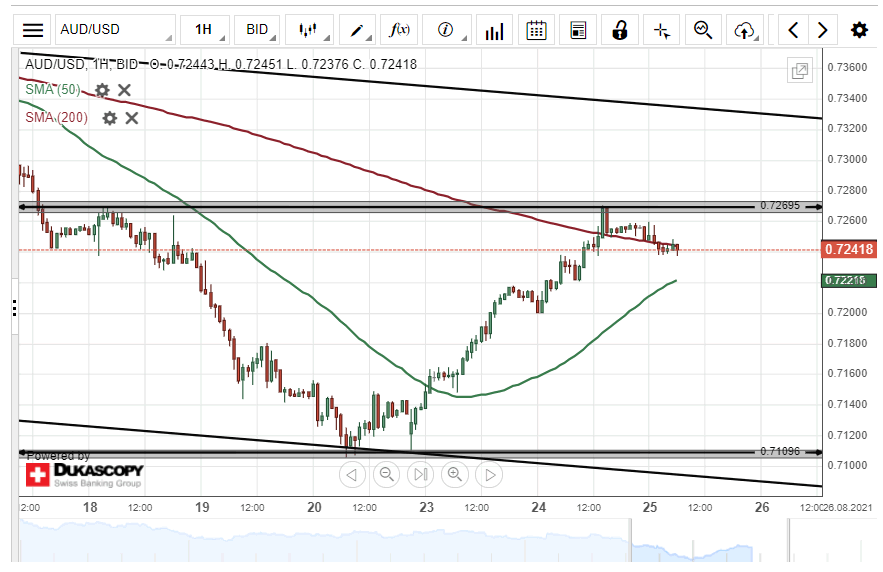
AUD/USD Potential Target At 0.7320
On August 24, the Australian Dollar surged by 68 pips or 0.94% against the US Dollar. The currency pair breached the 200– hour simple moving average during yesterday's trading session.
As for the near future, the exchange rate could continue to edge higher in a descending channel pattern. Bullish traders are likely to target the 0.7320 level within this session.
However, the AUD/USD currency exchange rate might encounter resistance near the 0.7269 area during the following trading session.
EUR/JPY Could Edge Higher
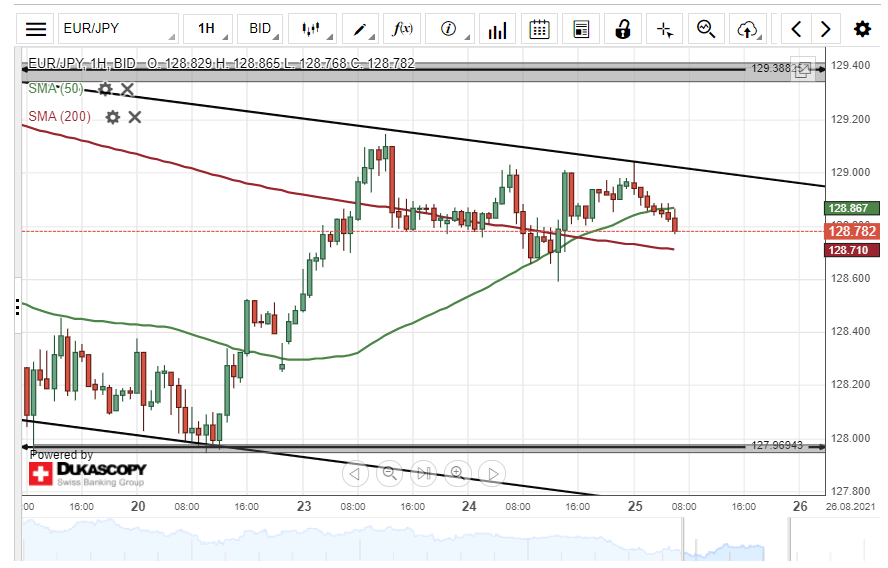
The EUR/USD currency pair bounced off a support level formed by the 50– and 200– hour SMAs at 128.66 on Tuesday. As a result, the common European currency surged by 31 pips or 0.24% against the Japanese Yen during Tuesday's trading session.
Technical indicators suggest buying signals on the 4H time-frame chart. Most likely, the exchange rate could continue to edge higher within the following trading session.
However, the upper line of a descending channel pattern at 129.00 could still provide resistance for the currency exchange rate within this session.