Sample Category Title
USDJPY Rangebound Between Trendlines
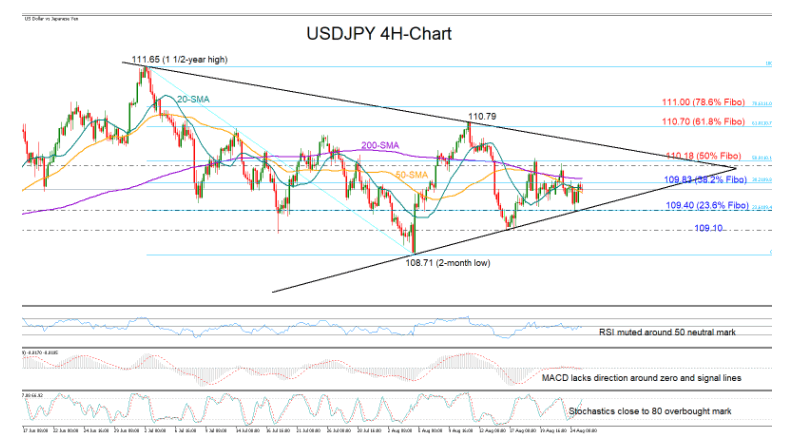
USDJPY is in a consolidation phase between two converging trendlines in the four-hour chart, moving sideways within the 110.21 - 109.40 area over the past week.
Encouragingly, the lower trendline managed to add strong footing under the price on Tuesday at 109.40, raising speculation that the pair could sail northwards again, but the 38.2% Fibonacci retracement of the 111.65 – 108.71 down leg came immediately to block the way higher on Wednesday at 109.83.
The momentum indicators are currently providing little hope for a meaningful upside correction as the RSI and the MACD remain in a tight range near their neutral levels, while the Stochastics have already reduced their distance with the 80 overbought level, flagging there is not much bullish fuel left in the tank.
Nevertheless, a close above the 38.2% Fibonacci of 109.83 and the 200-period simple moving average (SMA) is expected to drive the price up to the 50% Fibonacci of 110.18, a break of which could set off another intense battle near the upper trendline seen around 110.50. A successful move above the latter could magnify buying exposure in the market, shifting the spotlight towards the 61.8% and 78.6% Fibonacci levels at 110.70 and 110.00 respectively.
In the bearish scenario, if the price slides below the supportive trendline, where the 23.6% Fibonacci of 109.40 is also placed, the sell-off could speed up towards the previous low of 109.10. Failure to hold above the latter could bring the two-month low of 108.71 and therefore the case of a trend deterioration under examination.
Summarizing, USDJPY is holding a neutral bias in the short-term picture. A trendline breakout is required to navigate the market accordingly.
GBP/USD Outlook: The Pair Even Traded Above The 1.3720 Resistance Level
The British Pound started a recovery wave above the 1.3700 resistance against the US Dollar. The GBP/USD pair even traded above the 1.3720 resistance level.
The pair traded as high as 1.3747 and settled above the 50 hourly simple moving average. It seems like the pair is struggling to clear the 1.3745 and 1.3750 resistance levels.

The next key resistance is near the 1.3780 level on FXOpen. If there is a clear break above the 1.3760 and 1.3780 resistance levels, the pair could even attempt a move above the 1.3800 resistance zone in the near term.
On the downside, an initial support is near the 1.3710 level. There is also a key bullish trend line forming with support near 1.3710 on the hourly chart. A break below the trend line and 1.3700 could lead the pair back towards 1.3650.
EUR/USD Outlook: Near-Term Bias To Remain Negative While Recovery Is Capped By Pivotal Fibo Barrier
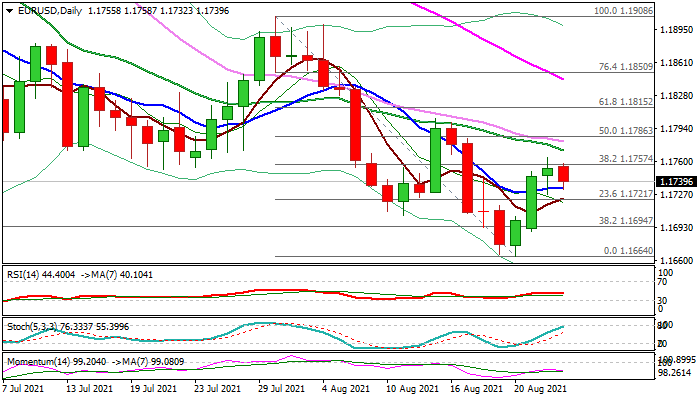
The Euro standing at the back foot in early Wednesday’s trading after three-day recovery failed to break pivotal Fibo resistance at 1.1757 (38.2% of 1.1908/1.1664).
Near-term action is consolidating between Fibo barrier and 10 DMA (1.1733) which marks solid support, but return and close below would signal recovery stall and increase downside risk. Fresh negative momentum and RSI turning south on daily maintain slight bearish bias, but traders await stronger direction signal.
Below 10DMA, pivotal supports lay at 1.1694 (Fibo 38.2% of 1.0635/1.2349 ascend) and 1.1664 (Aug 20 low), break of which would bring larger bears fully in play.
Conversely, sustained break of 1.1757 Fibo barrier and falling 20/30 DMA’s (1.1771/81) would sideline bears for stronger correction.
Res: 1.1757, 1.1771, 1.1781, 1.1804
Sup: 1.1733, 1.1694, 1.1664, 1.1600
Germany Ifo business climate dropped to 99.4 in Aug, supply bottlenecks and rising inflections
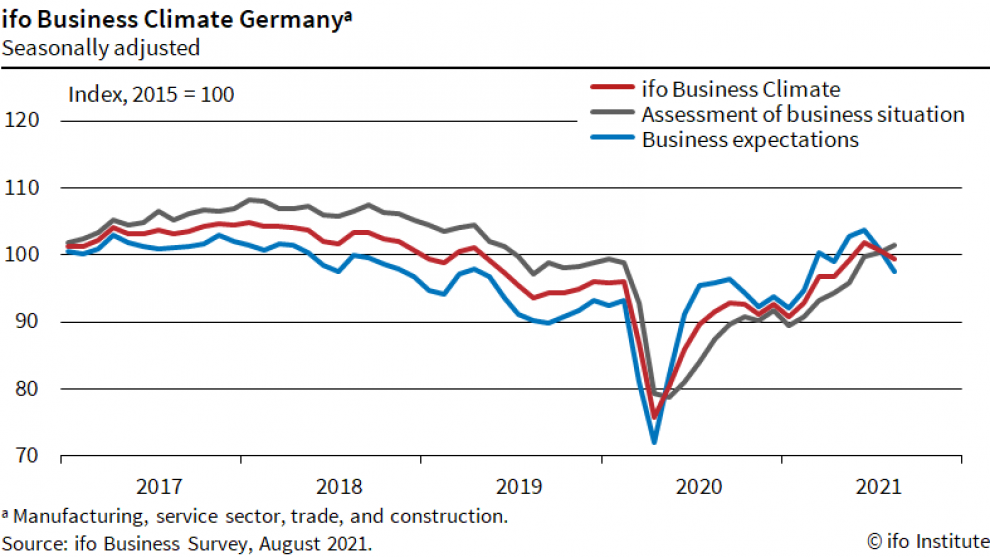
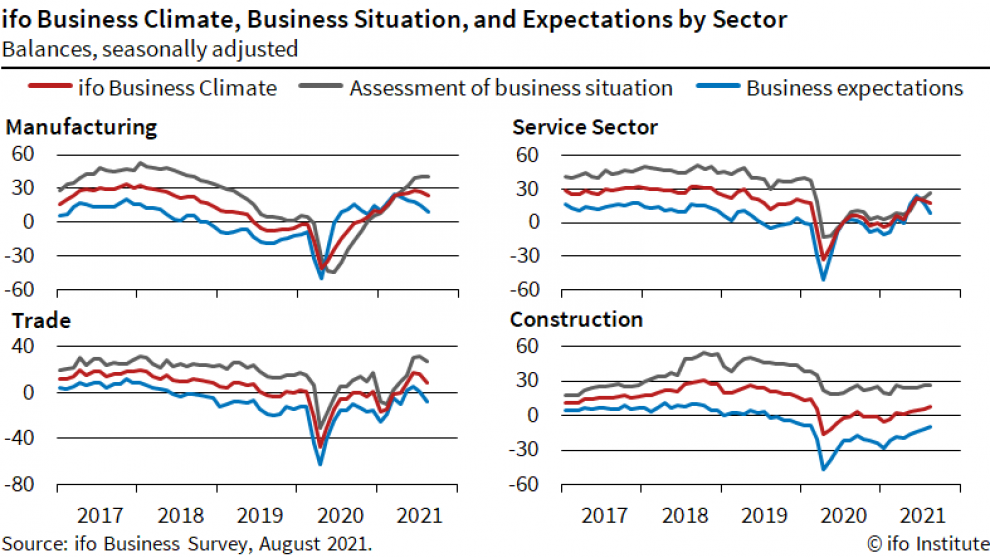
Germany Ifo Business Climate dropped from 100.8 to 99.4 in August, below expectation of 100.4. Current Assessment index rose from 100.4 to 101.4, above expectation of 100.8. However, Expectations index dropped from 101.2 to 97.5, below expectation of 100.0.
Looking at some more details, manufacturing dropped from 27.4 to 24.1. Services dropped from 19.8 to 17.7. Trade dropped from 15.8 to 9.0. Construction rose from 6.0 to 7.8.
Ifo said: "This decline was due mainly to significantly less optimism in companies' expectations. Concerns are growing in the hospitality and tourism sectors in particular. By contrast, companies assessed their current situation as somewhat better than in the previous month. Supply bottlenecks for intermediate products in manufacturing and worries about rising infection numbers are putting a strain on the economy."
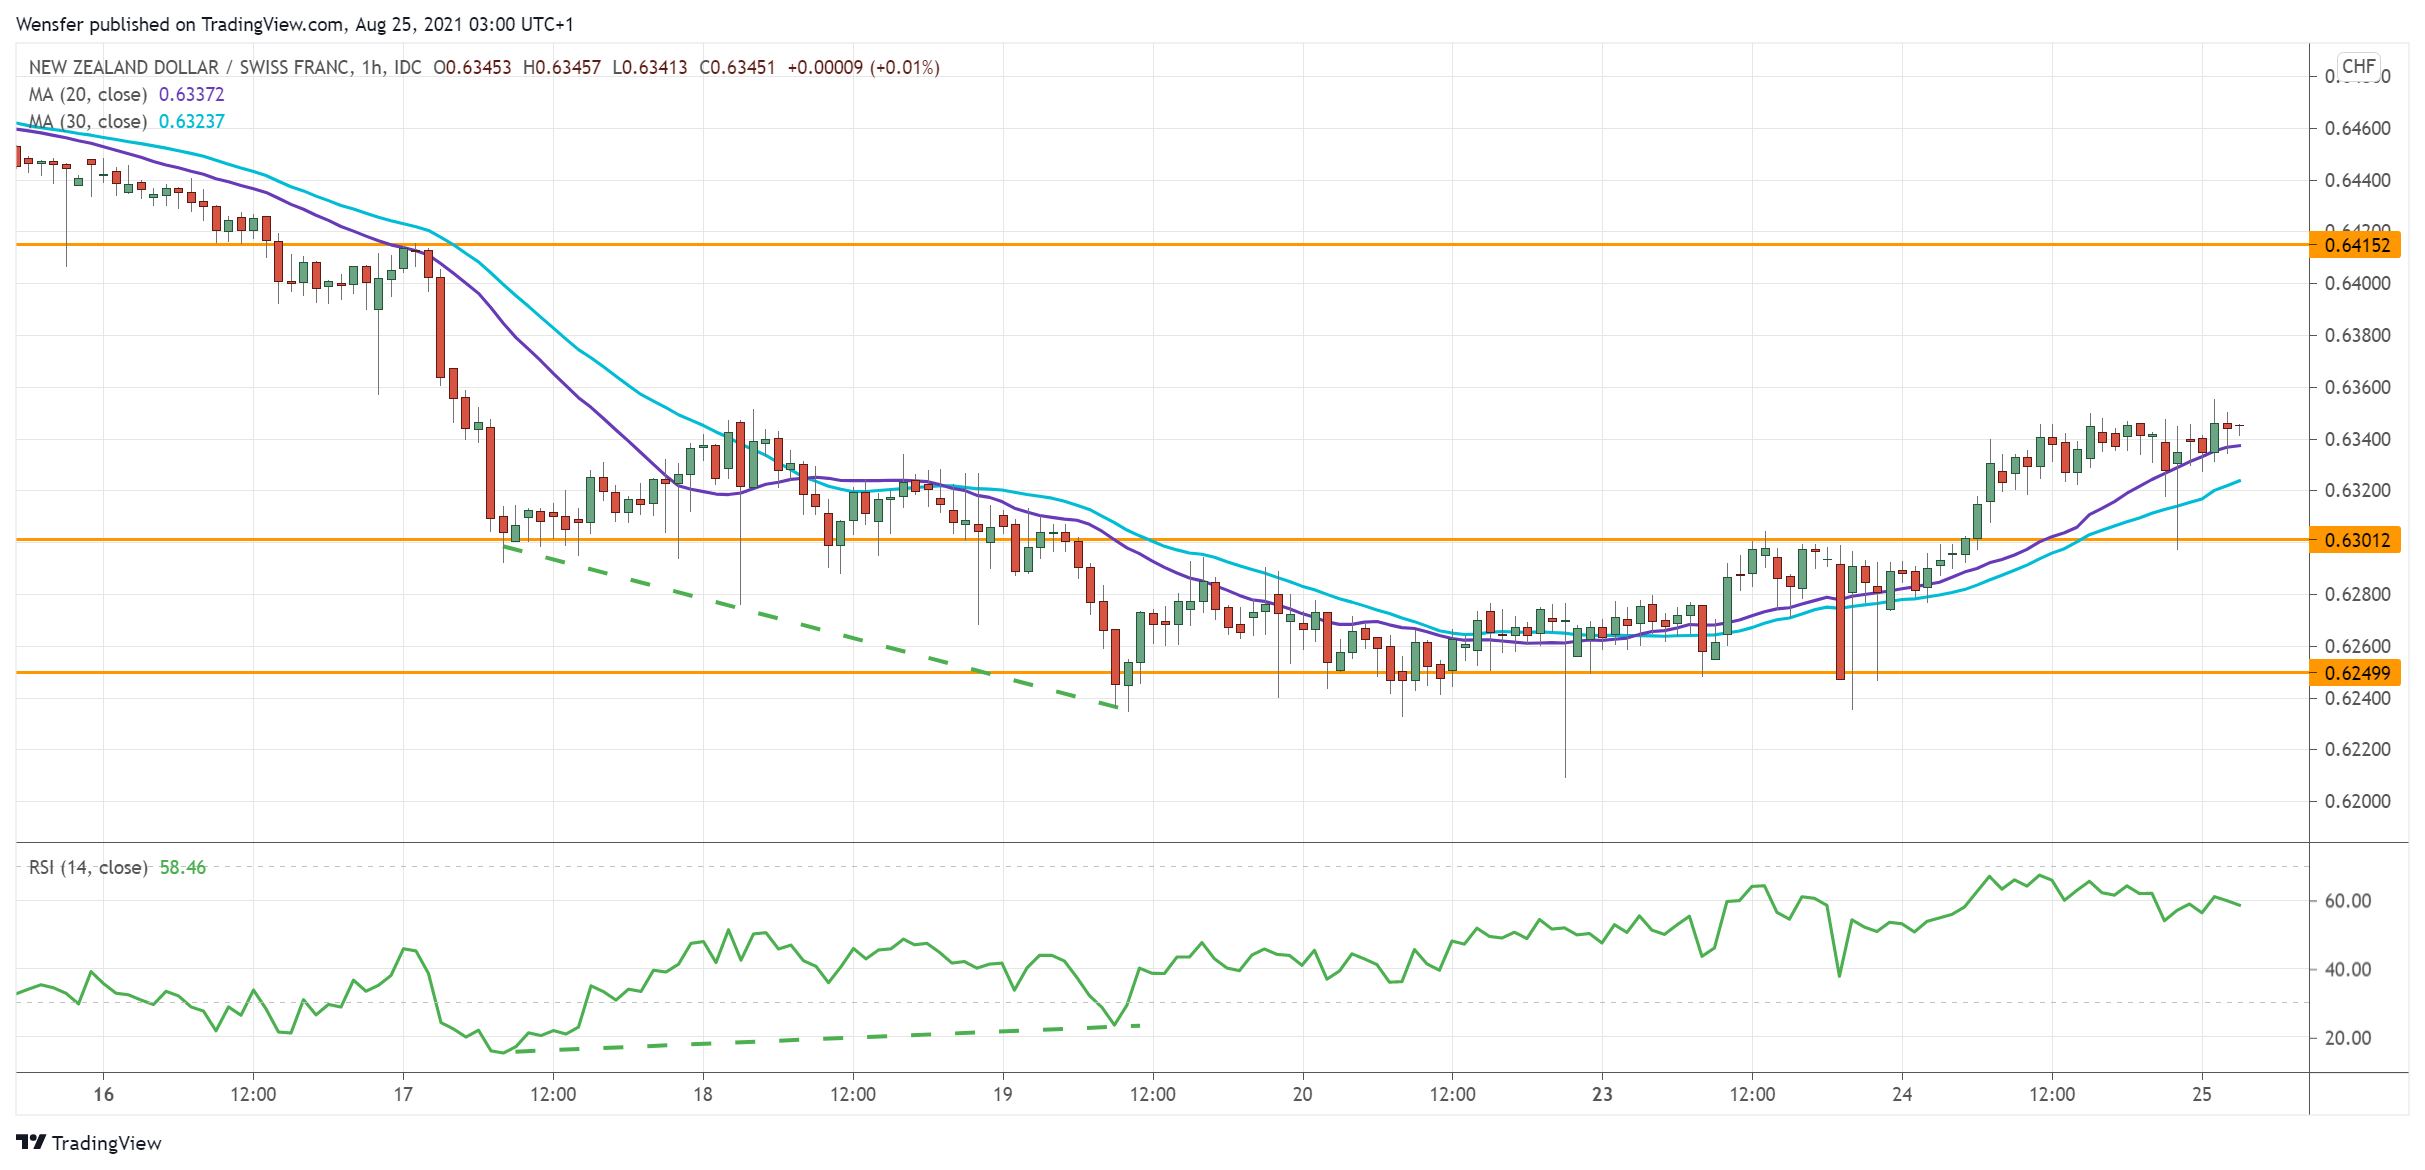
NZD/CHF Bounces Off Key Support
The New Zealand dollar climbed after the RBNZ’s chief economist said that the outbreak has limited effect on monetary policy.
The pair saw buying interest at December’s low at 0.6250. The RSI’s bullish divergence in this demand zone was an important signal that sellers had become less aggressive.
The subsequent rally above 0.6330 is a confirmation that a rebound is underway.
0.6415 would be an intermediate resistance. 0.6300 is fresh support in case of a pullback as the RSI inches towards an overbought situation.
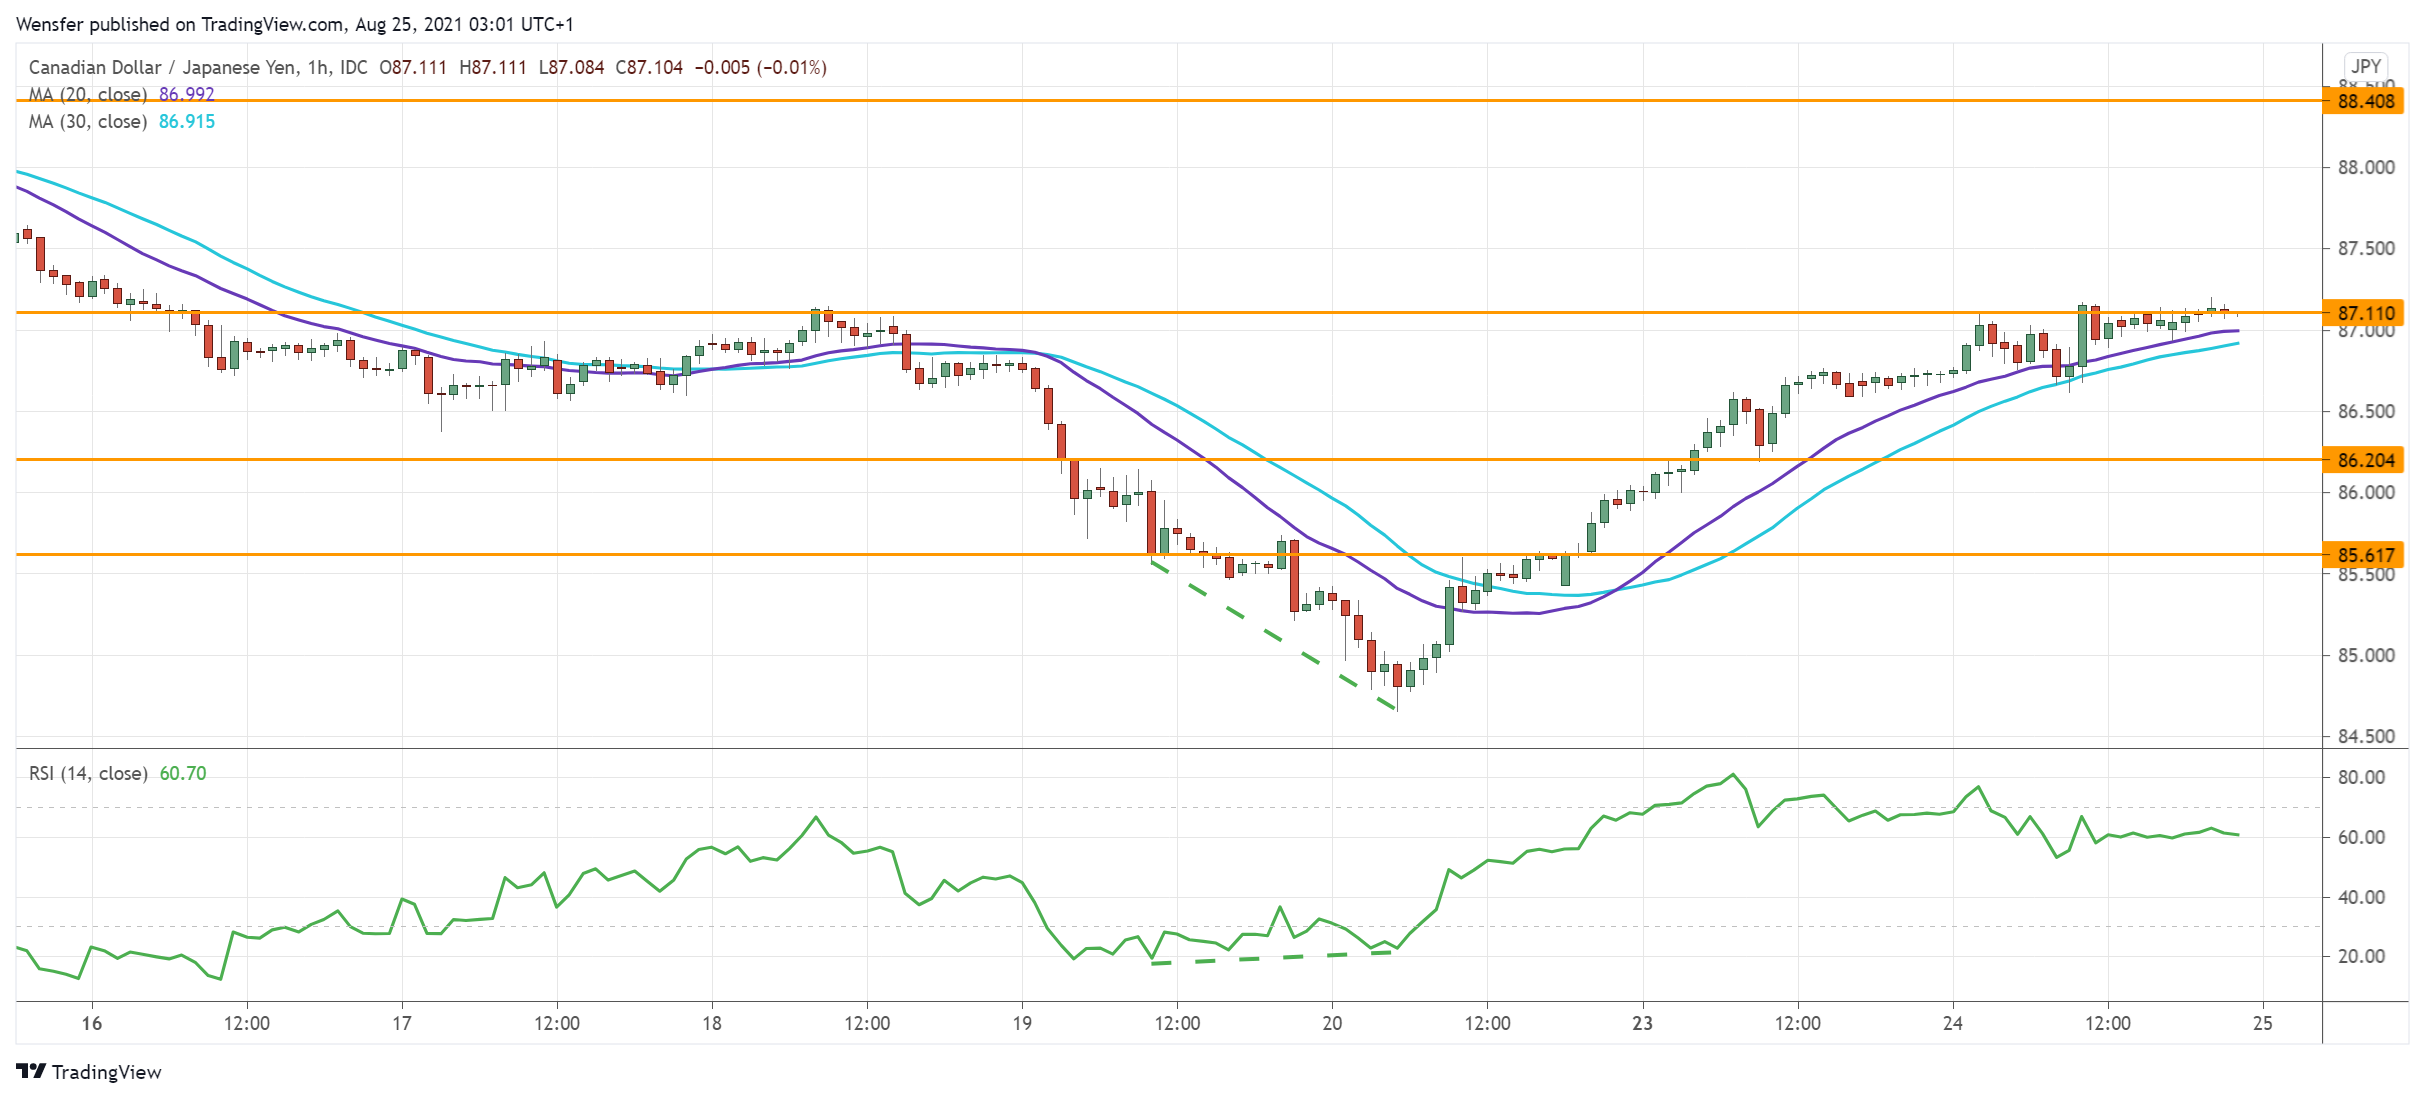
CAD/JPY Grinds Resistance
The Canadian dollar bounces back supported thanks to a recovery in oil price.
The break below the daily support at 85.50 suggests that sentiment may have turned downbeat in the medium-term. However, there is still room for an intraday rebound after the RSI’s double-dip into the oversold area.
The indicator’s divergence also showed a slowdown in the sell-off.
A close above 87.10 would lead to the supply zone at 88.40 where we can expect stronger selling pressure. 86.20 is fresh support on the downside.
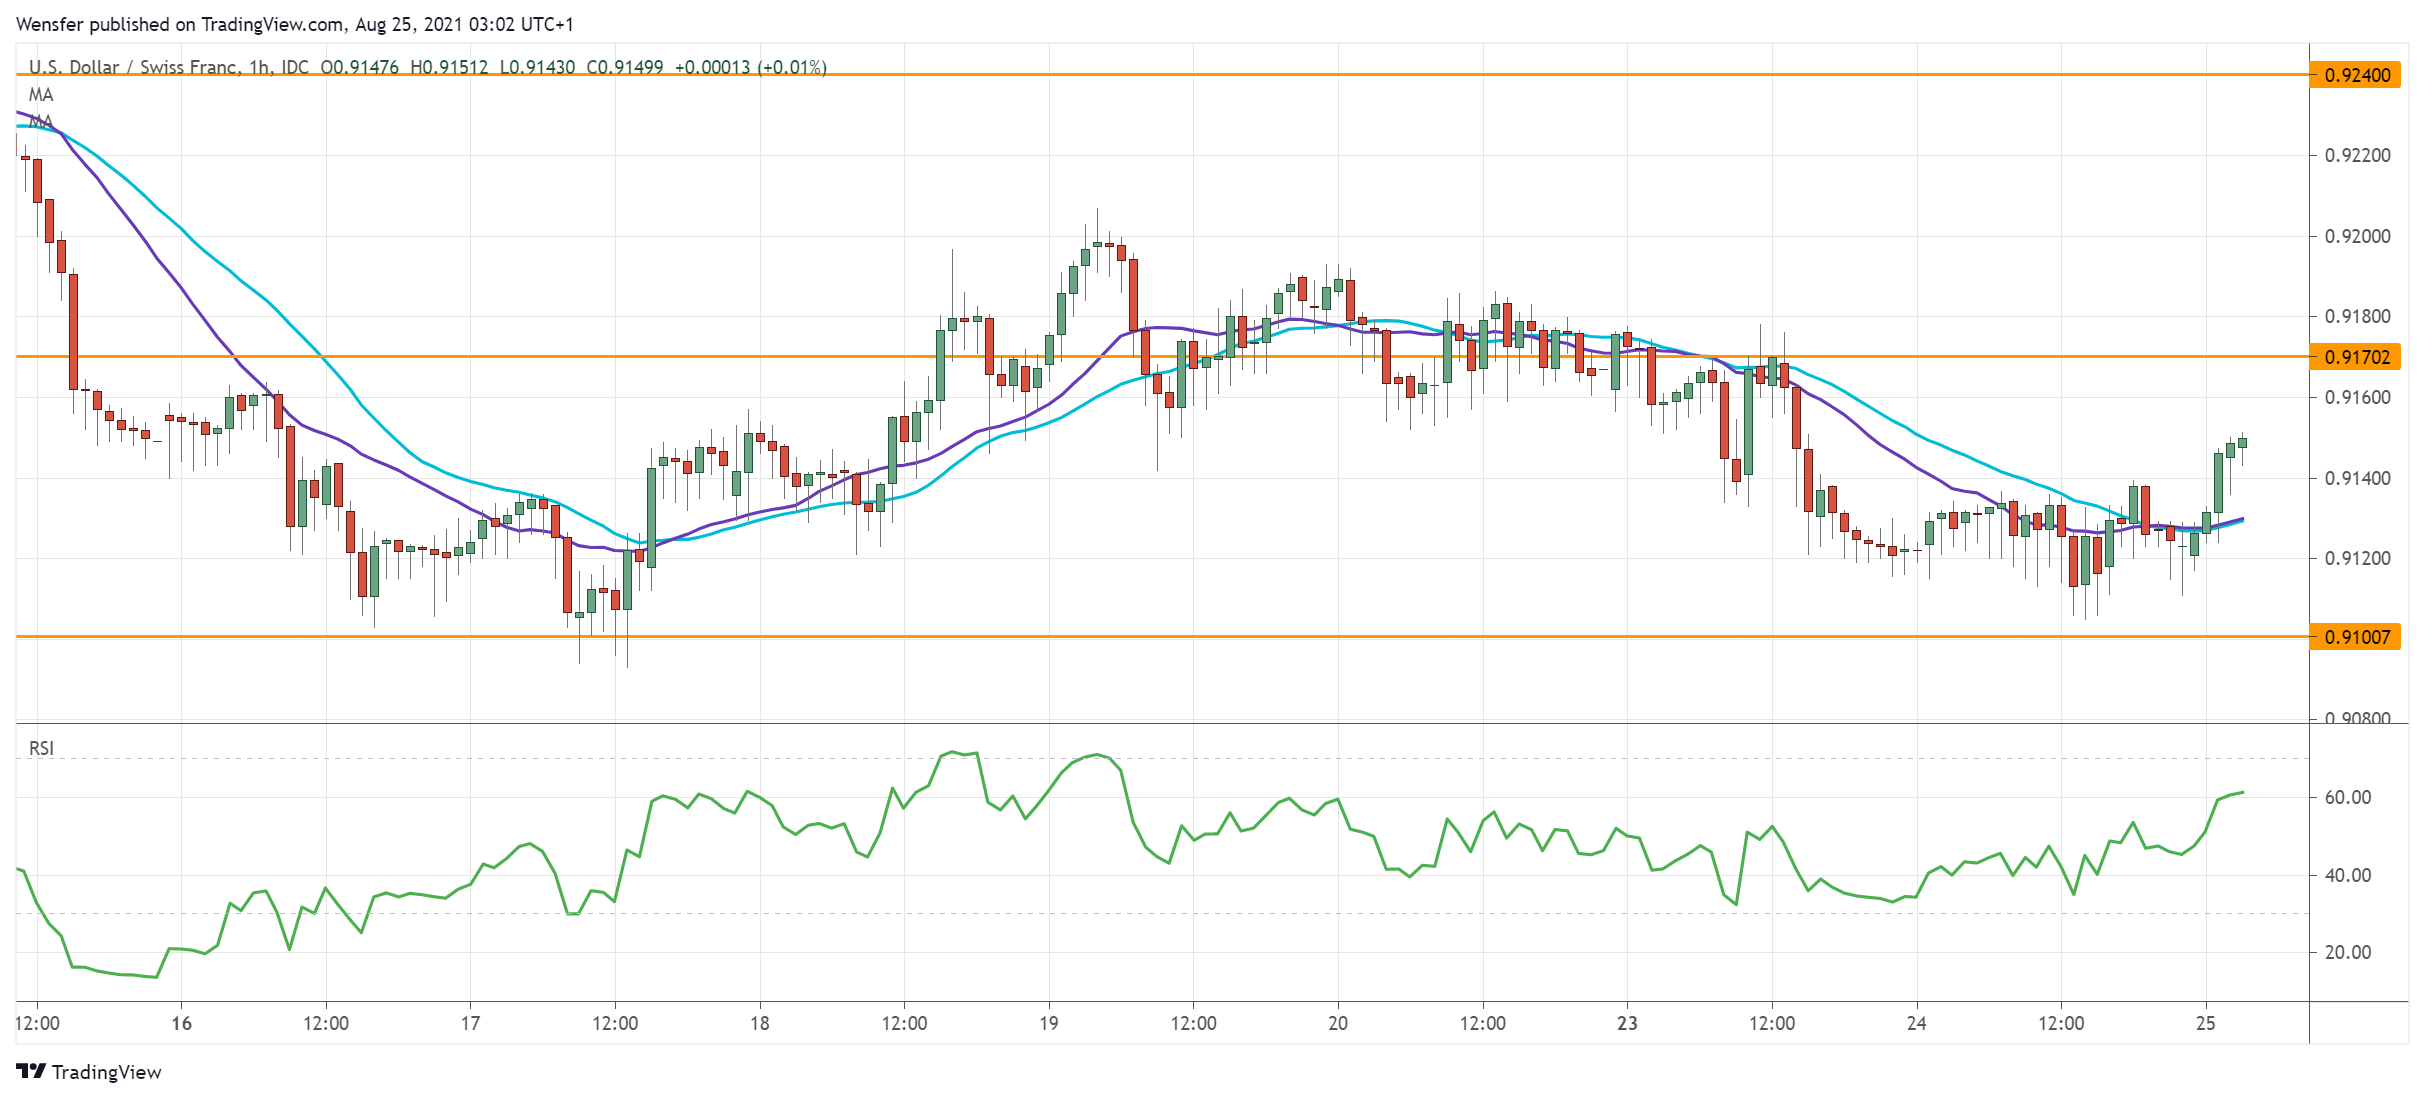
USD/CHF Retests Fibonacci Level
The US dollar takes a backseat as traders await the Fed’s update at the Jackson Hole symposium tomorrow.
The pair is trading within a narrowing range between 0.9020 and 0.9240. This is a sign of momentary hesitation amid mixed data signals.
The greenback is testing again the 61.8% (0.9100) Fibonacci retracement level from the August rally.
A rebound will need to clear 0.9170 to attract more patient players. A bearish breakout towards 0.9020 on the other hand may invalidate the recent rally.
Dollar: Acceleration Expected
The S&P 500 index closed at historic highs for the 50th time this year, gaining 0.15% on the day. There is a lull in the currency market waiting for monetary policy signals from Jackson Hole. This situation is quite dull for investors and maybe a trap for short-term traders.
The Dollar Index has retreated to weekly lows and paused in wait for further signals. Speculators have high hopes that the symposium in Jackson Hole will shape the trend for the next couple of quarters.
An acceleration of the upward trend in the Dollar is most likely. From June until now, we have seen the first phase of this reversal in consolidation and timid attempts at growth. However, even in this phase, we have witnessed higher highs and lows in the USD index.
Locally, the technical picture has already indicated a trend reversal. During the last two months, buyers have supported the Dollar on dips towards the 50-day moving average. Also, in August, the DXY broke out of a converging range, and now its resistance has turned into support.
If we do see a reversal, an acceleration should soon follow. Typically, a new trend gains strength after confirmation of a break. However, market forces now prefer to wait for clear signals from the Fed, as too much is at stake.
It is hard to deny that monetary policy looks less and less like a race to see who is softer. This is returning the markets to normal functioning: Strong macro data supports rather than weakens the Dollar.
The same applies to its relationship with other currencies. The dynamics of currency pairs against the Dollar will increasingly be determined by the monetary policy cycle of the two central banks.
In China, for example, the central bank and the authorities have turned from tightening the screws to supporting weakening economic growth. In recent days, we have seen some softening of regulators' rhetoric, which has provided an influx of buyers into beaten equities and sectors and a fivefold increase in reverse repo volumes at the end of the month to support liquidity.
In contrast, the New Zealand dollar had gained the previous two days on reports that the local Central Bank had considered a 50-point rate hike at its last meeting but decided that markets were not yet ready for such a move.
In Russia, the central bank has been actively raising the rate to keep it above inflation, which has kept the rouble from falling against the Dollar. In Brazil, on the other hand, the local central bank has not kept up with the inflation trend, which has created increased pressure on the real.
Hence we can see that the currency market has already switched from crisis mode to regular operation. And at the start of this cycle, the USD tends to out-compete its competitors until other central banks are confidently on the path of normalisation of monetary policy, which takes 3-9 months.
NZDUSD Still Rises After The Rebound Off 0.6800
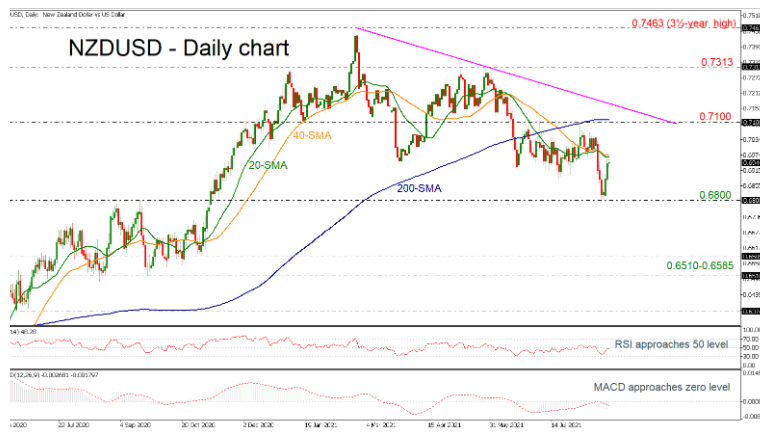
NZDUSD is still moving higher after the rebound off the 0.6800 support level, reaching the 20- and 40-day simple moving averages (SMAs).
Technically, the RSI indicator is flattening near the neutral threshold of 50, while the MACD is rising in the bearish territory, approaching the trigger line.
If the price jumps above the SMAs, the next immediate resistance could come from the 0.7100 psychological level, which holds near the 200-day SMA. Even higher, the market could meet the medium-term descending trend line around 0.7170 before meeting the 0.7313 barrier.
On the other hand, a continuation of the broader bearish outlook could take the market down to the 0.6800 handle. Steeper decreases could drive traders towards the 0.6510-0.6585 support zone.
In brief, NZDUSD has been in a bearish movement since February 25 and only a jump above the falling trend line may shift the bias to positive.
GBP/JPY Daily Outlook
Daily Pivots: (S1) 150.10; (P) 150.56; (R1) 151.06; More...
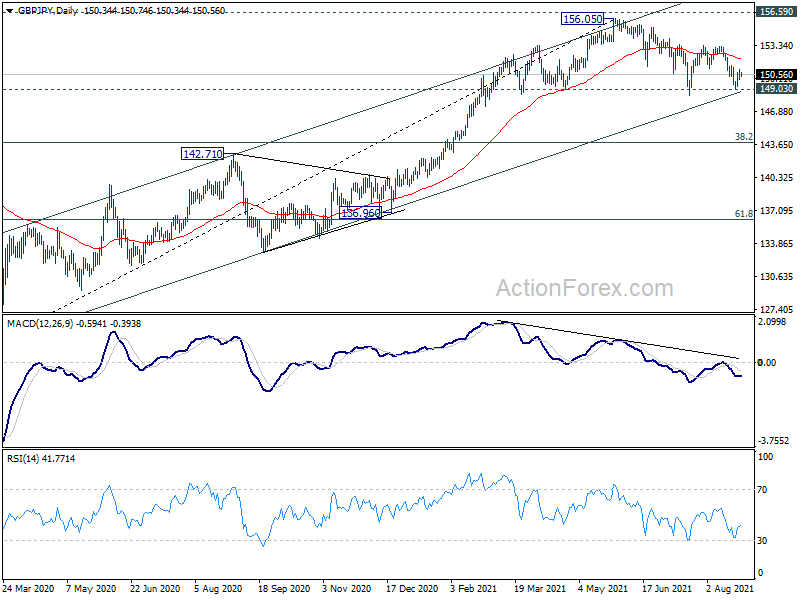
Intraday bias in GBP/JPY remains neutral and outlook is unchanged. Further decline is expected as long as 151.38 resistance holds. Decisive break there will carry larger bearish implication and target 143.78 fibonacci level next. On the upside, above 151.38 minor resistance will turn bias back to the upside for 153.42 resistance instead.
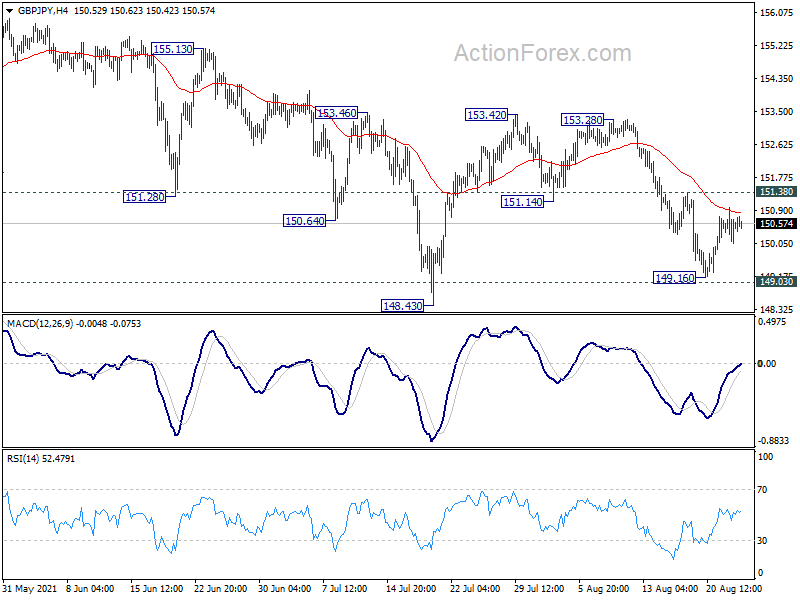
In the bigger picture, rise from 123.94 is seen as the third leg of the pattern from 122.75 (2016 low). As long as 149.03 support holds, such rise would still resume at a later stage. However, sustained break of 149.03 support will indicate rejection by 156.59. Fall from 156.05 would be at least correcting the whole rise from 123.94. Deeper fall would be seen back 38.2% retracement of 123.94 to 156.05 at 143.78 first.