

Sample Category Title
USD/JPY Analysis: Ignores Support Levels
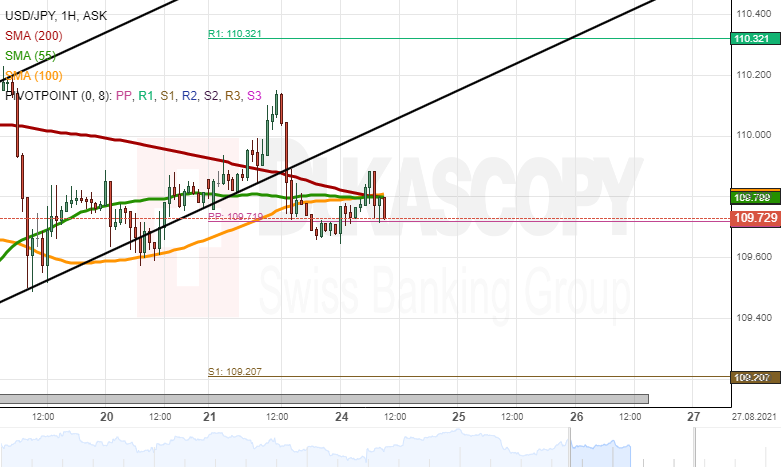
Despite passing the resistance of the 110.00 level, the USD/JPY currency exchange rate did not surge to the weekly R1 at 110.32. Instead, the pair bounced off the 110.15 level and declined, ignoring all technical support levels. Namely, the 55, 100 and 200-hour SMAs, the weekly simple pivot point and the lower trend line of a channel up pattern were passed by the rate.
On Tuesday morning, the currency exchange rate was fluctuating between the 109.65 and 109.90 levels.
If the USD/JPY currency exchange rate starts a surge, it would immediately face the resistance of the 110.00 level. Above the 110.00 mark, the 110.15 and 110.20 could once again provide resistance.
In the case of a decline, the rate could find support in the 109.60 and 109.50 level, which provided the rate with support throughout the prior week.
GBP/USD Analysis: Recovers To 1.3750
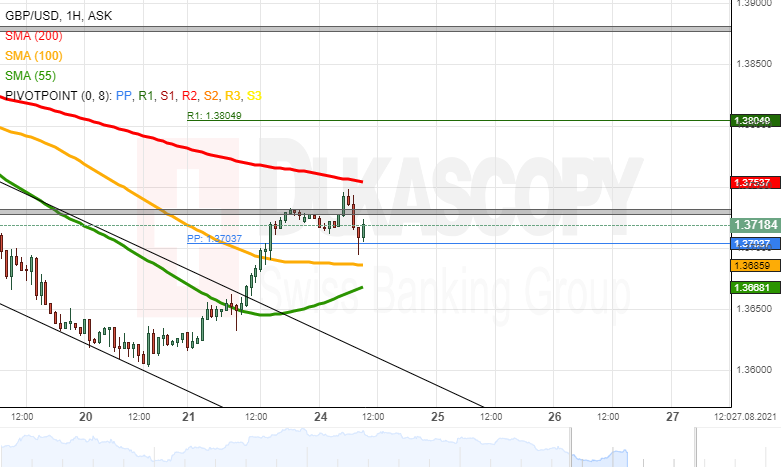
The recovery from the support of the 1.3600 mark broke one resistance level after another. However, by the middle of Tuesday's European trading hours, it appeared that the GBP/USD had ended its surge. Namely, the rate had bounced off the 1.3750 mark and declined to 1.3700.
In the case that the rate passes the support of the 1.3700 level, the GBP/USD would look for support in the 55 and 100-hour simple moving averages near 1.3670 and 1.3680. Below the SMAs, the 1.3650 level could stop the rate's decline.
Meanwhile, a recovery from the 1.3700 mark could once again test the resistance of the 1.3750 level and the 200-hour simple moving average. A passing of these levels could result in the pair reaching the 1.3800 level.
EUR/USD Analysis: Surge Reaches Resistance
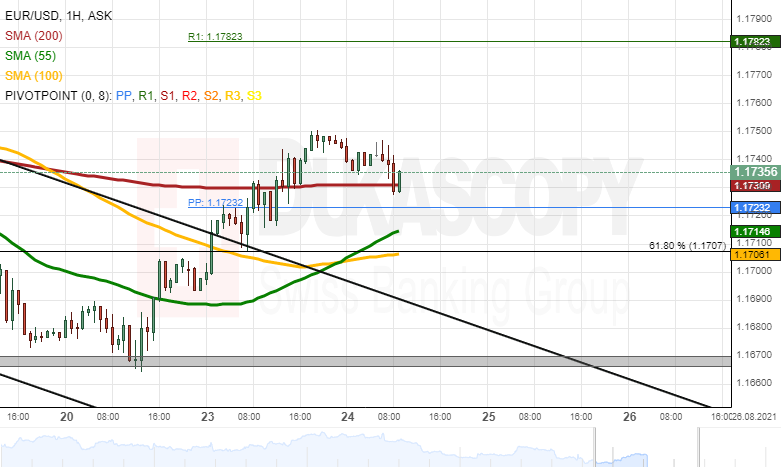
The surge of the EUR/USD managed to pass the resistance of the weekly simple pivot point at 1.1723 and the 200-hour simple moving average near 1.1730. Moreover, the rate reached the 1.1750 level before slightly declining on Tuesday morning.
In the case that the currency exchange rate surges, the pair would need to pass the resistance of the 1.1750 level before reaching for the weekly R1 simple pivot point at 1.1782. Above the pivot point, the 1.1800 mark could provide resistance just like it did during mid-August.
On the other hand, a potential decline of the rate would find support in the 200-hour simple moving average at 1.1730, the weekly simple pivot point at 1.1723, the 55-hour simple moving average at 1.1714 and the 1.1700 level. The 1.1700 level's support is being strengthened by the 100-hour simple moving average and a 61.80% Fibonacci retracement level.
Stocks Extend Rebound, Dollar Tanks As Fed Taper And Delta Worries Ease
- Risk sentiment continues to improve as Fed seen delaying taper signal
- Delta fears also subside as FDA's full approval of Pfizer vaccine adds to optimism
- Wall Street flirts with record highs, dollar flounders as commodity currencies fight back
Fed taper expectations pared back amid virus risks
Growing signs that the Delta wave is proving to be a bigger headwind for the US economy than initially anticipated have cooled expectations that the Federal Reserve will commit to a tapering timeframe at this week's Jackson Hole conference. Policymakers will begin their virtual deliberations on Thursday, but while Fed Chair Jay Powell will likely provide some further clues on how much progress has been made in the recovery, he will probably stop short of signalling a taper move in September.
Spiralling virus cases amid a worsening Delta outbreak in America appear to have dented growth in August. The IHS Markit flash PMI was the latest survey to point to slowing growth yesterday, with the composite PMI falling to the lowest since December. The worrying trend in the near-term outlook puts all the more focus on the August jobs report. And although a taper announcement in September hasn't totally been taken off the table, investors are now more certain that the Fed won't withdraw its stimulus too aggressively, especially after hawkish Dallas Fed chief Kaplan expressed some concern about the Delta variant.
Stocks get a shot in the arm
But as Delta woes threaten to dominate policymakers' taper discussions this week, markets are in better spirits thanks to easing fears of a hawkish Fed and some optimism on the vaccine front.
The US FDA granted the Pfizer-BionTech Covid-19 vaccine full approval on Monday, raising hopes that the decision will encourage more people inoculated. Many Americans have been hesitant to get vaccinated because until now, all the Covid shots were approved for emergency use only.
America has fallen behind the vaccination race, with both Canada and the EU overtaking it in recent months. If the move by the FDA encourages a higher uptake of the Pfizer vaccine, it would lessen the pressure for some states to tighten restrictions.
Wall Street definitely seems to be pinning its hopes on that as the rebound from last week's troughs gathered further steam after the news. The S&P 500 closed just shy of its all-time high from a week ago, while the Nasdaq Composite set a new record.
Asian stocks also extended their recovery today on signs that the latest virus outbreak in China is subsiding. However, European shares were mixed at the open.
Dollar on steadier footing after fall, kiwi rallies again
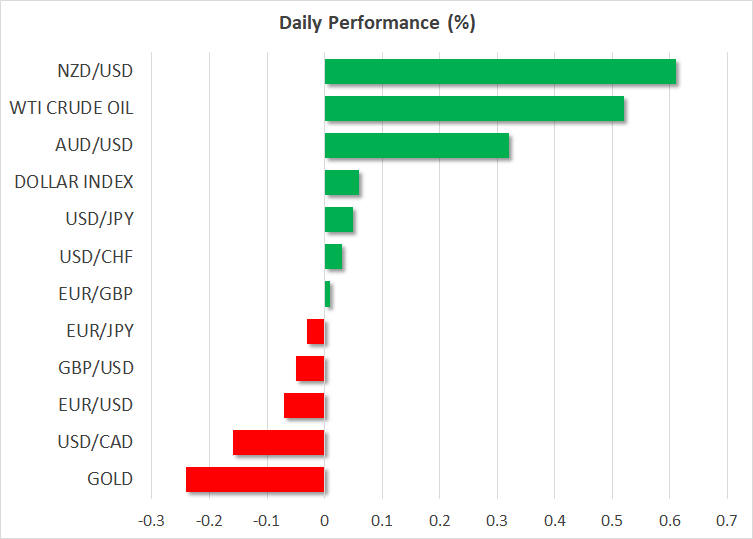
The US dollar, meanwhile, was steadier, edging up slightly against a basket of currencies today after taking a painful tumble yesterday.
The commodity-linked currencies were once again the biggest winners. A strong bounce back in the price of major commodities such as oil and copper is aiding the commodity dollars, which have jumped between 1.5% and 2% from their lows. But the New Zealand dollar got an additional boost today, gaining 0.6%, after RBNZ Assistant Governor Christian Hawkesby said that the only reason why the Bank didn't hike rates last week is because it would have posed a communication problem when the country just went into a lockdown. Hawkesby also confirmed that a 50 basis points hike was discussed, fuelling expectations that a rate increase in the Autumn is a done deal.
The euro and pound were slightly softer today.
New home sales out of the US is the only major data on the agenda on Tuesday but investors will be keeping a close watch on the happenings in Congress amid divisions within the Democrats on whether to pass the $3.5 trillion social infrastructure plan before the $1 trillion bill on traditional infrastructure, which has already been approved by the Senate.
The Analytical Overview Of The Main Currency Pairs
The EUR/USD currency pair
Technical indicators of the currency pair:
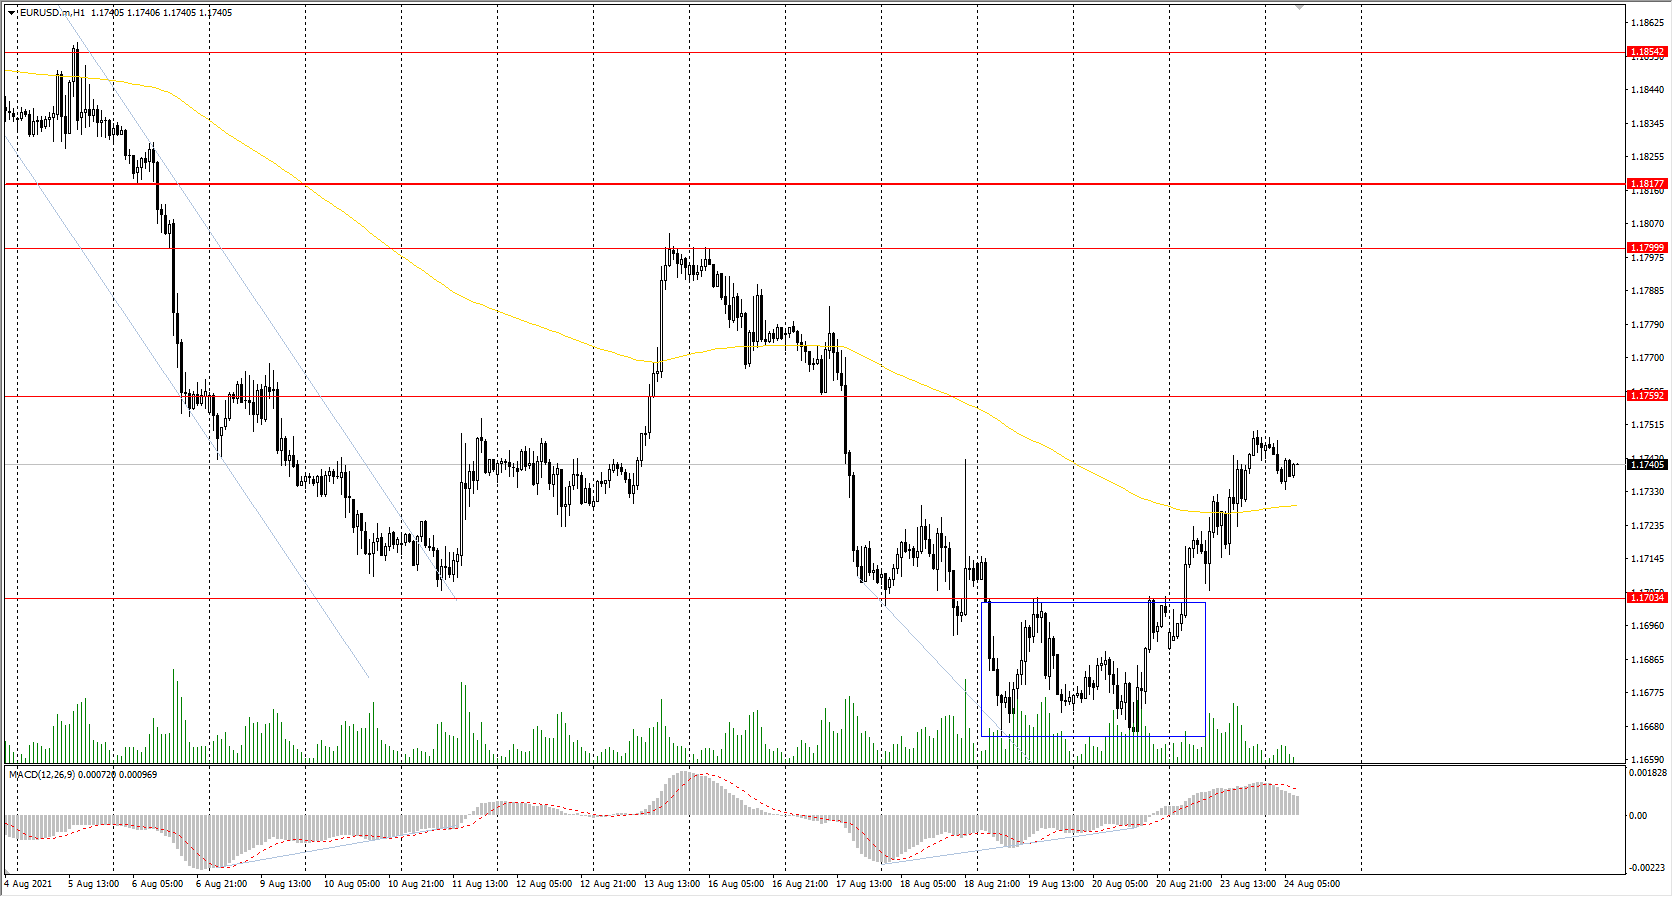
Prev Open: 1.1688
Prev Close: 1.1745
% chg. over the last day: +0.48%
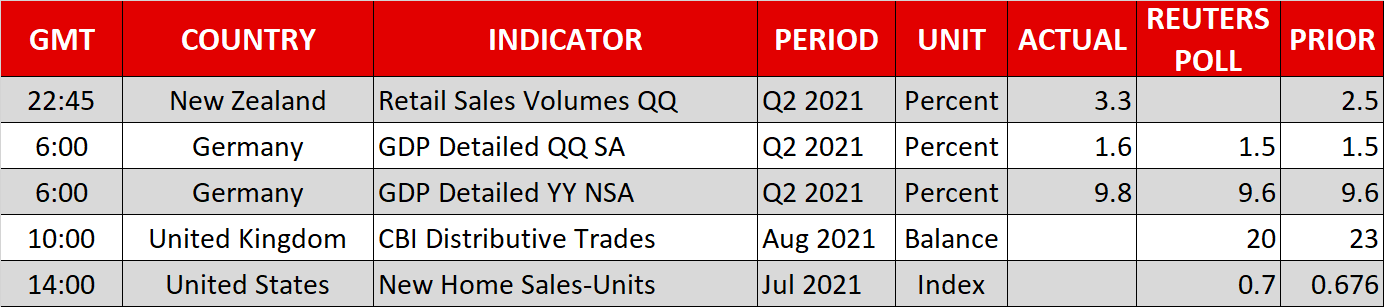
Germany's Manufacturing PMI index also slowed in August. In general, in Europe, economic activity in the manufacturing sector decreased. On the other hand, the business activity index in the services sector remained at about the same levels. Economists expect the data to be much better in the third quarter. Due to a sharp drop in the dollar index, the European currency managed to get stronger yesterday.
Trading recommendations
Support levels: 1.1704, 1.1620
Resistance levels: 1.1759, 1.1799, 1.1817, 1.1854, 1.1894, 1.1934, 1.1969
From a technical point of view, the general trend in the EUR/USD currency pair is bearish. The price has consolidated above the support level and formed a false breakdown zone below. Taking into account the divergence on the MACD indicator on the higher timeframes, the buyers' pressure is higher now. Under such market conditions, it is best to look for sell trades from the resistance levels, where sellers showed the initiative. Buy trades can only be considered intraday from the support levels where the buyers have shown the initiative.
Alternative scenario: if the price breaks through the 1.1817 resistance level and fixes above, the mid-term uptrend will likely resume.
News feed for 2021.08.24:
- Germany GDP (q/q) at 09:00 (GMT+3);
- US New Home Sales (m/m) at 17:00 (GMT+3).
The GBP/USD currency pair
Technical indicators of the currency pair:
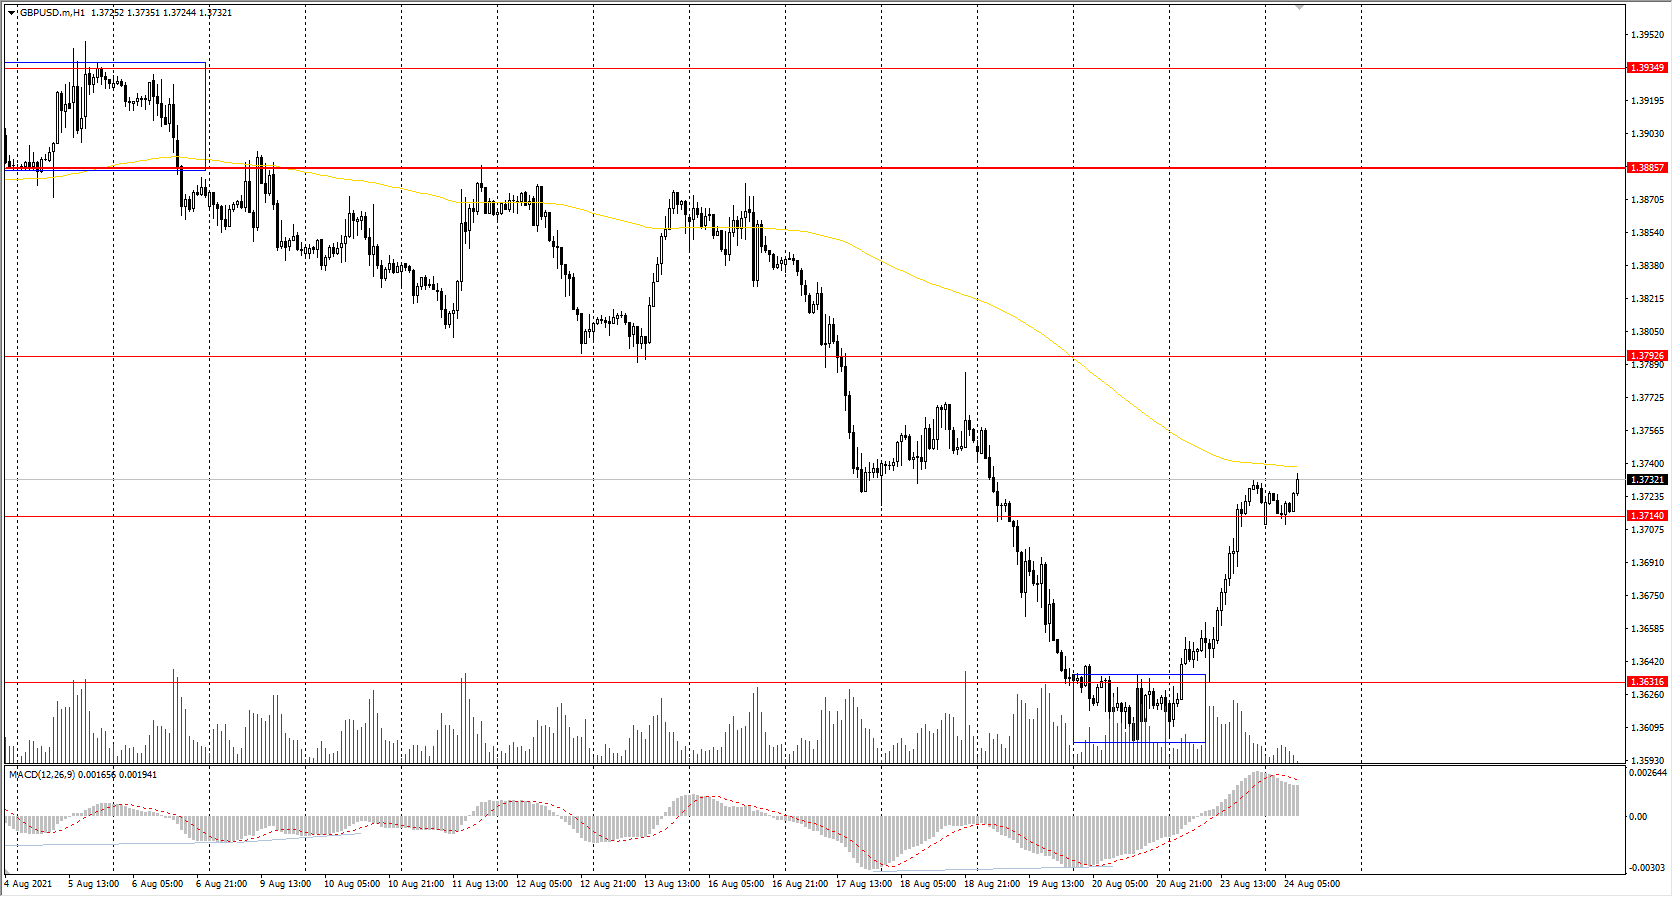
Prev Open: 1.3621
Prev Close: 1.3721
% chg. over the last day: +0.73%
UK manufacturing activity slightly fell in August but was better than economists' expectations. Services PMI index hit a two-month low. These are clear signs that the pace of recovery is slowing. But due to the decline of the US dollar index and increase in Brent crude oil prices, the British pound added 100 points yesterday.
Trading recommendations
Support levels: 1.3714, 1.3632, 1.3614, 1.3525
Resistance levels: 1.3793, 1.3772, 1.3886, 1.3935, 1.4002
On the hourly time frame, the GBP/USD trend is bearish. The price has consolidated above the support level and formed a false breakdown zone below. The MACD indicator has become positive with no signs of a reversal. Under such market conditions, it is better to look for sell trades from the resistance levels. There are no optimal entry points for buy deals now.
Alternative scenario: if the price breaks out through the 1.3885 resistance level and consolidates above, the bullish scenario will likely resume.
The USD/JPY currency pair
Technical indicators of the currency pair:
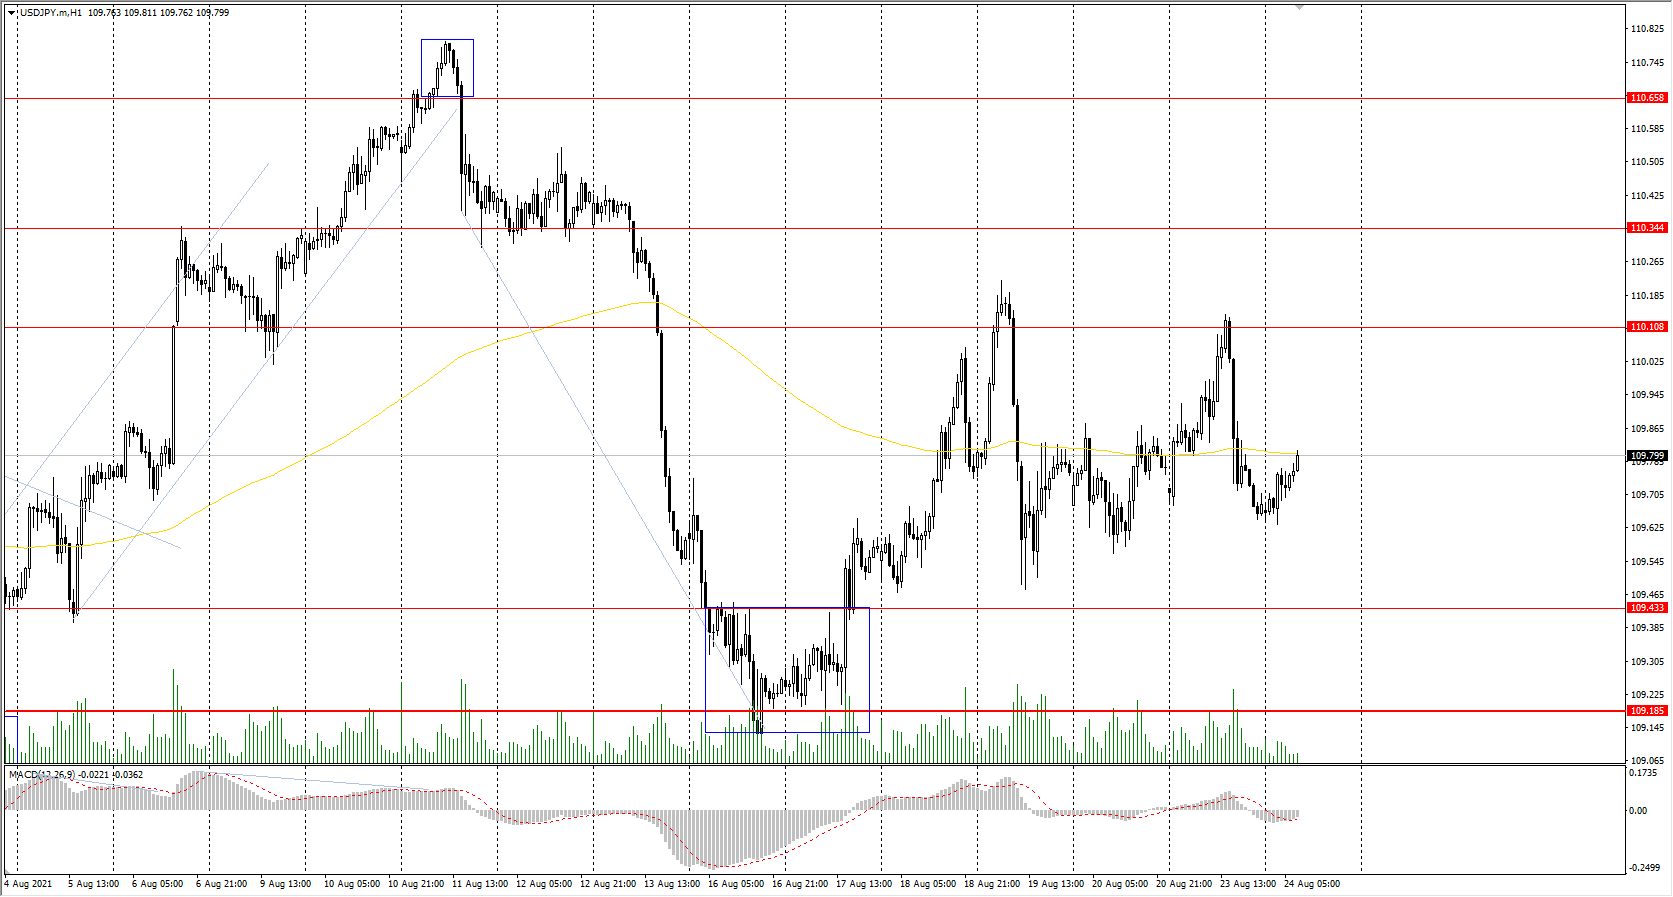
Prev Open: 109.72
Prev Close: 109.68
% chg. over the last day: -0.04%
According to a report from the Bank of Japan, the Consumer Price Index increased by 0.1% in August. This data confirms the view that inflation is unlikely to accelerate in Japan and the Bank of Japan will need to maintain its extremely soft monetary policy for an extended period.
Trading recommendations
Support levels: 109.43, 109.19, 108.65
Resistance levels: 110.11, 110.34, 110.66, 110.95, 111.48
The main trend on the USD/JPY currency pair is bullish. The fall of the dollar index compensated for the negative impact of the manufacturing sector news on Monday. As a result, the USD/JPY currency pair is trading flat. The MACD indicator has become inactive. Under such market conditions, it is best for traders to look for buy trades from the support level, where the buyers have shown initiative. Sell positions should be considered only on lower time frames from the resistance levels and only with short targets.
Alternative scenario: if the price falls below 109.18, the uptrend is likely to be broken.
News feed for 2021.08.24:
- Japan BOJ Core CPI (m/m) at 08:00 (GMT+3).
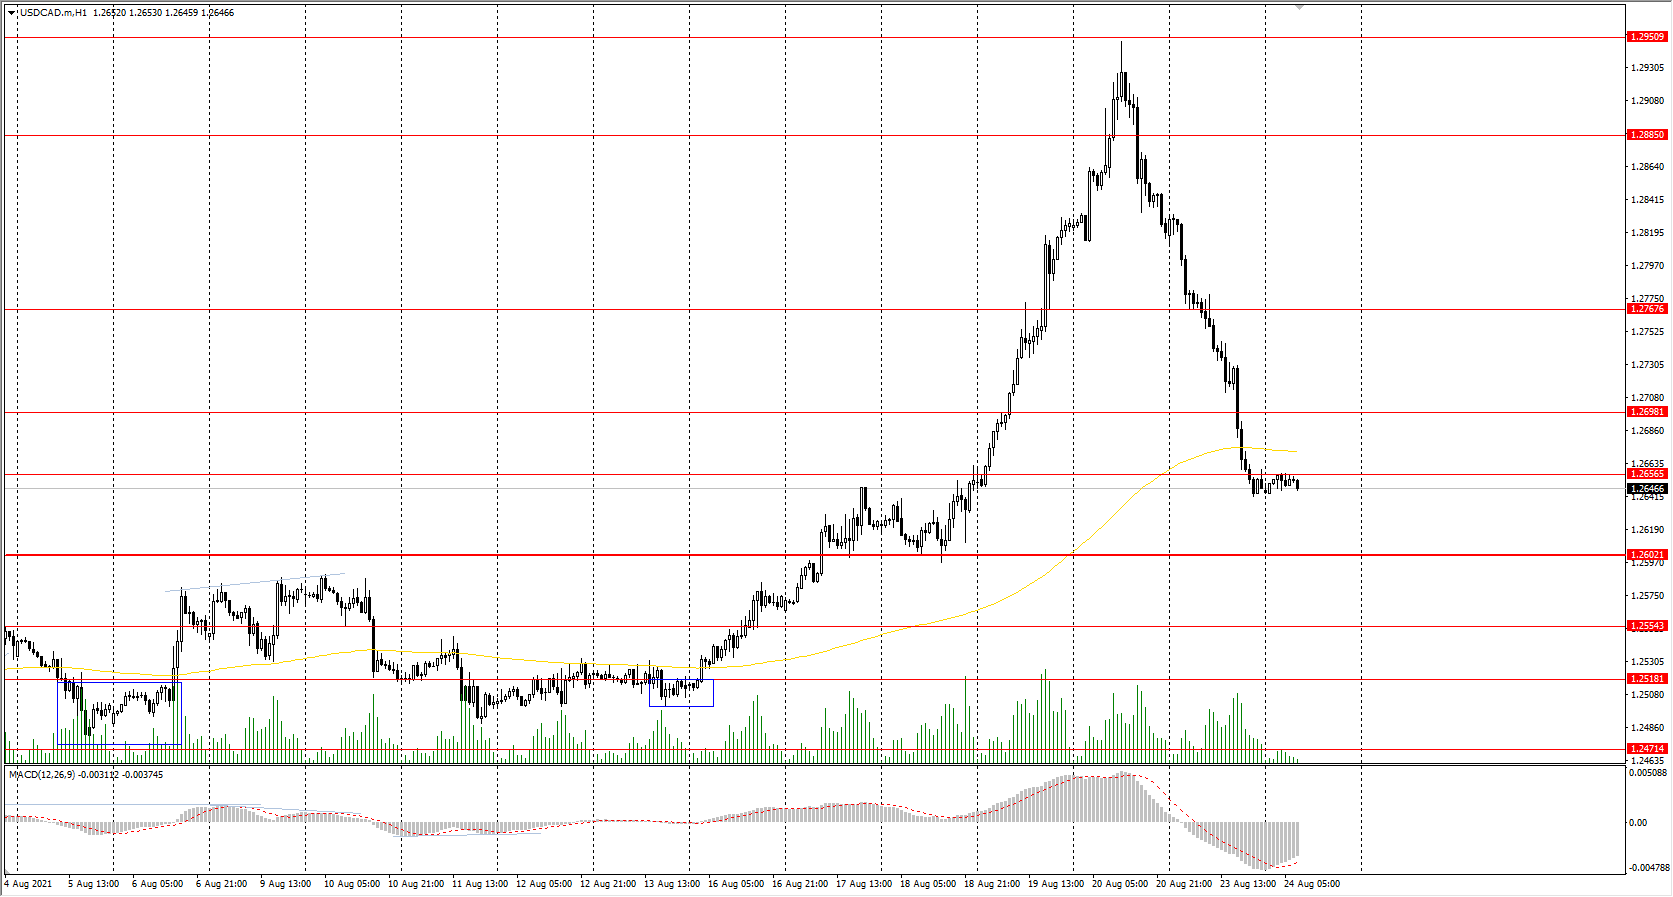
The USD/CAD currency pair
Technical indicators of the currency pair:
Prev Open: 1.2817
Prev Close: 1.2647
% chg. over the last day: -1.34%
The USD/CAD currency pair is highly dependent on the dynamics of the dollar index and oil prices. The dollar index sharply decreased yesterday while the oil prices significantly increased, which caused a sharp strengthening of the Canadian dollar and, accordingly, an aggressive USD/CAD quote decrease.
Trading recommendations
Support levels: 1.2602, 1.2554
Resistance levels: 1.2656, 1.2713, 1.2812, 1.2891, 1.2951
In terms of technical analysis, the USD/CAD trend is still bullish. But now, the price has approached the priority change level. Buy positions should be considered from the support levels after the buyers’ initiative. There are no optimal entry points to sell deals now, because the support level is ahead.
Alternative scenario: if the price breaks through down the 1.2602 support level and fixes below, the uptrend is likely to be broken.
Option Cycles Explain Intra-Month Cycles In Equity Markets
The US indices Nasdaq100 and S&P500 made new all-time highs on Monday, gaining 1.46% and 0.85% on the day. Last week's drawdown was bought back as quickly as it was in the last several months.
The daily charts of the S&P500 clearly show how the American market indices have been falling over the last year by the expiration date of the monthly options (third Friday of the month). In the meantime, explanations for market movements due to fears of increased illness or a sell-off are falling by the wayside.
The monthly options cycles explain the market development much more than the other reasons, which is somewhat scary. Previously, this connection was difficult to isolate, but it shows up much clearly near market extremes.
Since last September, it is obvious to see how technical the chart has become: there is deterioration in the performance of equities in the days before the expiry. For the last four months, like clockwork, the S&P500 has fallen towards its 50-day average by the time of the options' recharge and received actual support near the third week and the beginning of the fourth.
The impact of option life cycles could become stronger next month when there will also be a quarterly futures expiry.
The intensification of this correlation in the markets indicates an increased propensity for professional speculators, who widely use options on equities and indices to hedge risks.
This correlation is clear evidence of an overheated equity market, which makes for fragile conditions. But it is not enough to take short positions right now. There are enough fundamental positives in the markets (economic boom, tight labour, ultra-soft monetary policy) to buy short-term drawdowns.
The said correlation can break at any moment, and it is very dangerous to rely on it as a permanently working model. Instead, it is a reason to pay attention to the timing of market drawdowns and demand - whether they intensify after expiry.
Interestingly, in the FX market, although the dollar is under some pressure on rising equities, the DXY has maintained an uptrend since June with a strengthening of buying on the decline towards the 50-day average.
The two trends rarely coexist for long, so it is worth keeping a close eye on which one will take the upper hand, and it is often the case that turning points are better seen in the currency market rather than the stock market.
NZD/USD Attempts Reversal
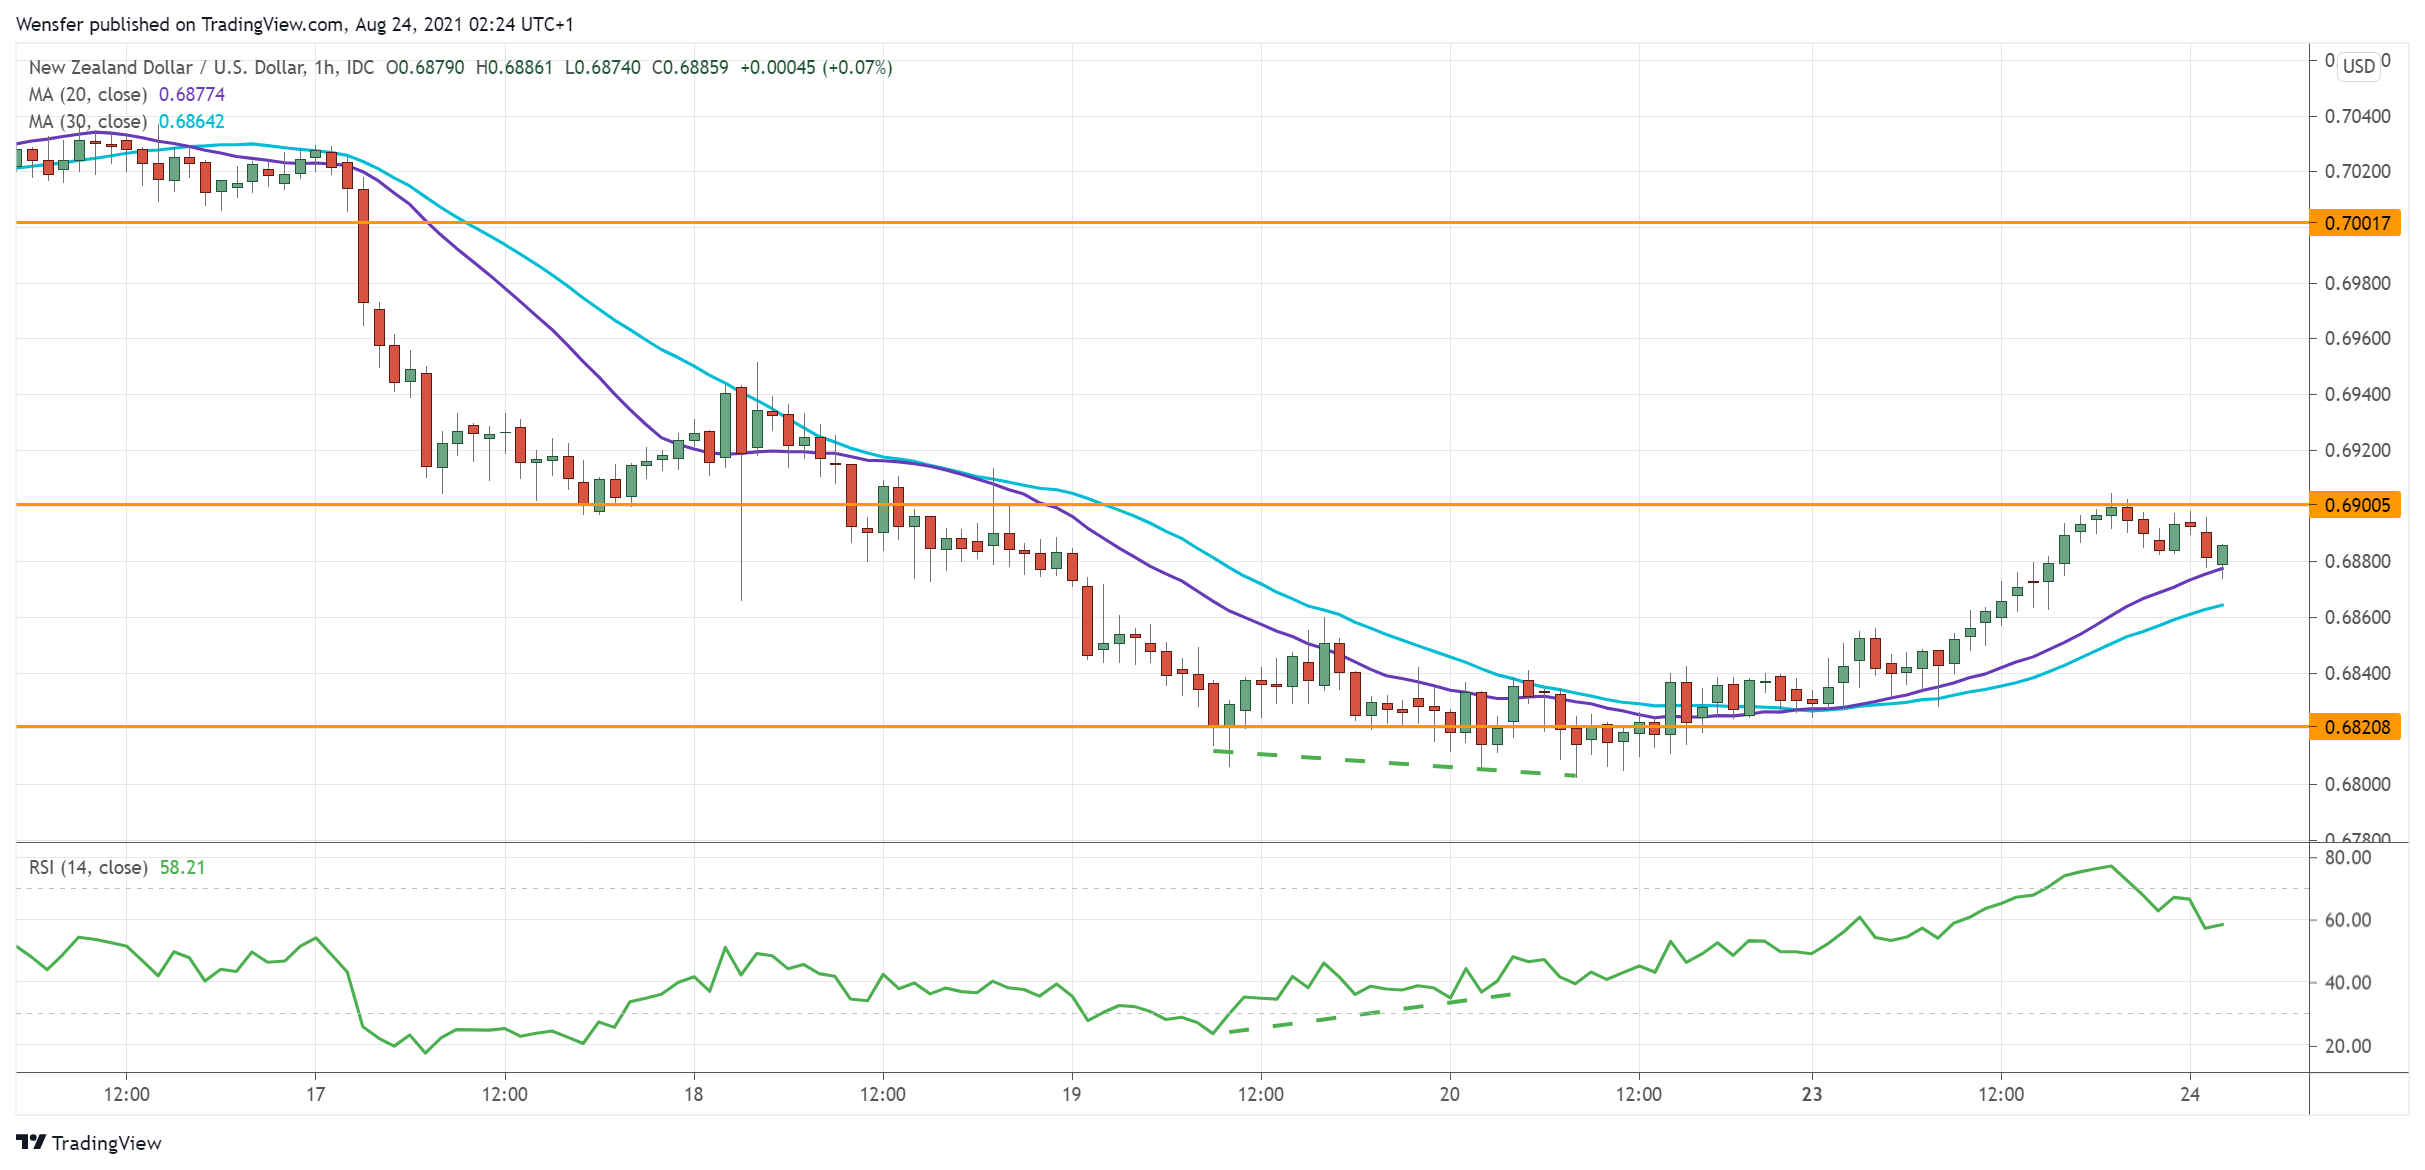
The New Zealand dollar rose back after the Q2 retail sales beat expectations.
The RSI divergence was a giveaway that the bearish momentum was losing steam. The confirmation came in the form of a bullish MA cross and a breakout above 0.6860. Buyers may see sellers taking profit as an opportunity to rack up stakes.
0.6900 is a key resistance ahead as its breach may build the case for a reversal. Then the psychological level of 0.7000 would be within reach.
However, a fall below 0.6820 may send the price towards 0.6700.
EUR/USD Pushes Towards Resistance
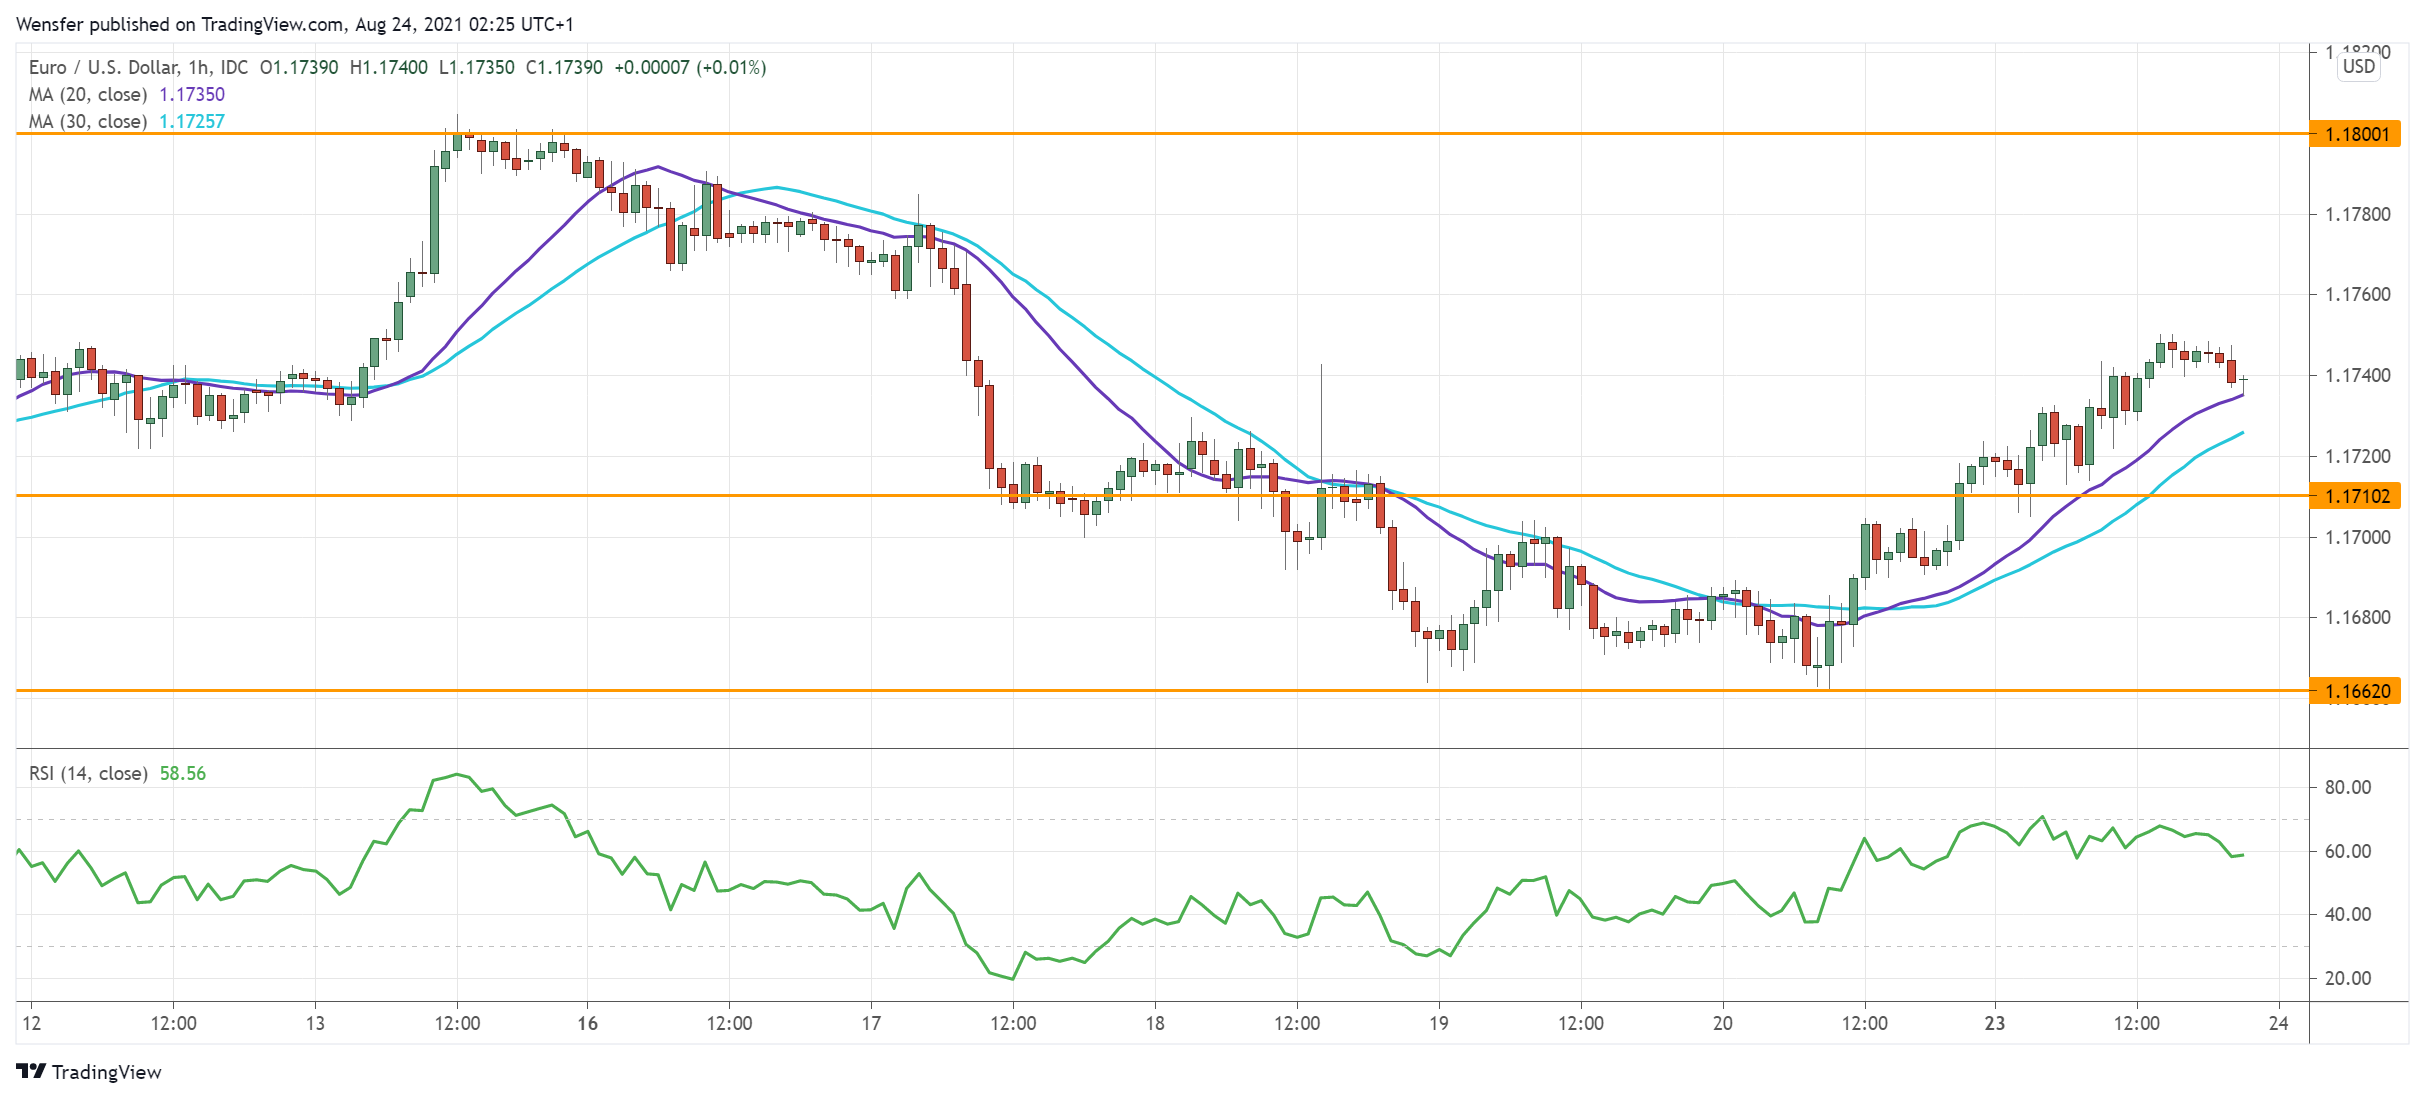
The US dollar softened after a drop in August’s Markit manufacturing and services PMI.
The pair’s break below the daily support at 1.1710 has put the bulls on the defensive. Though the RSI’s oversold situation triggered the buy-the-dips mentality going into the weekend.
The single currency has managed to lift 1.1740, opening the door to the key supply zone at 1.1800. A bullish breakout may initiate a reversal.
Otherwise, a drop below 1.1710 may keep the euro under water for an extended period of time.
NAS 100 Break To New Highs
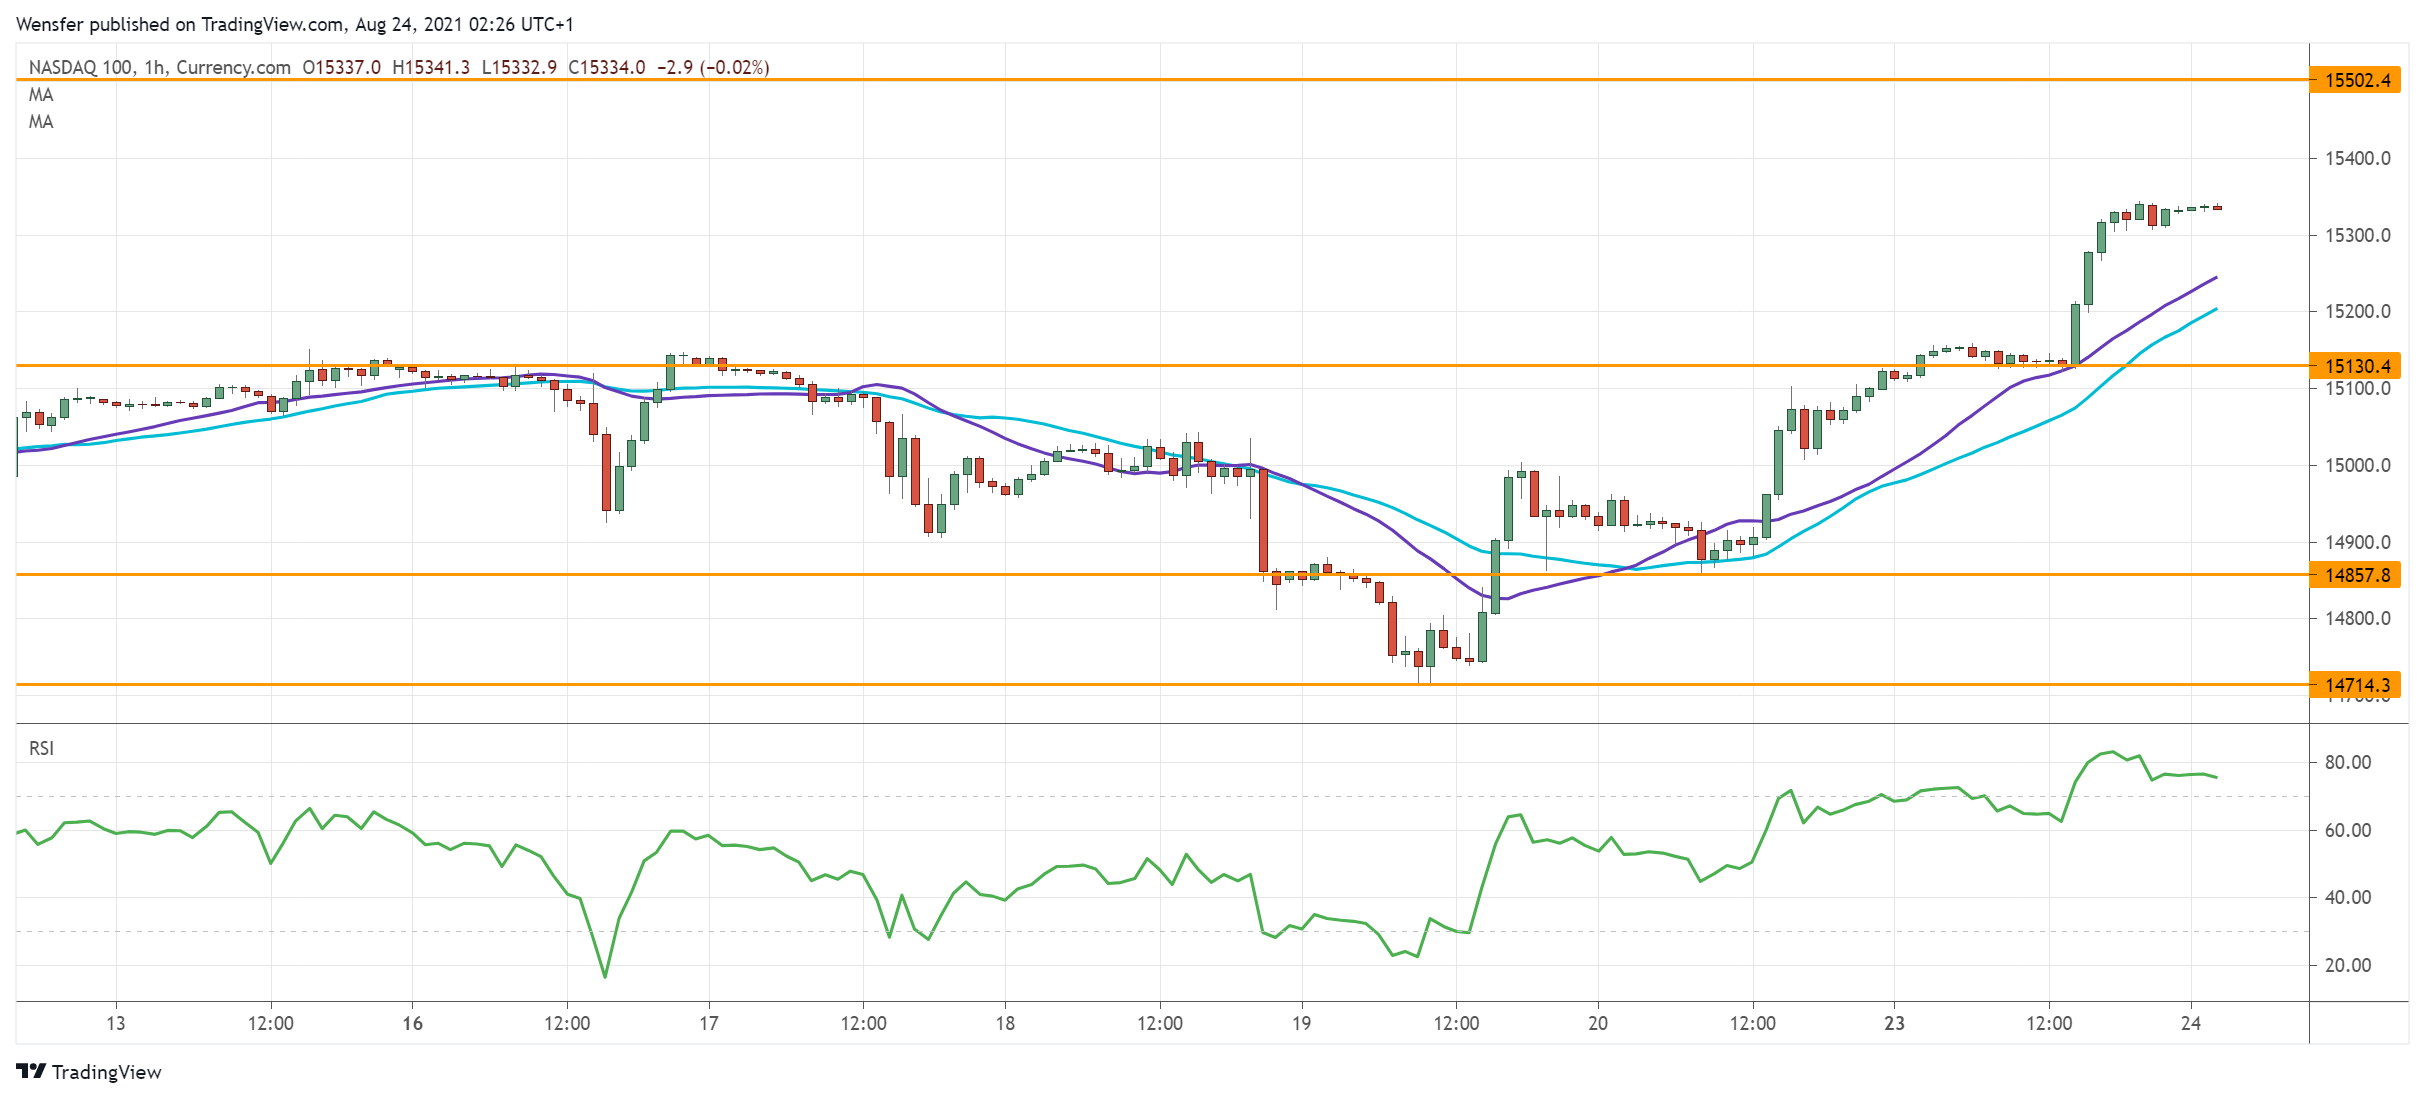
The Nasdaq 100 surges as rising Delta cases may force the Fed to reconsider the tapering timeline.
Buyers have pushed into new highs after clearing the resistance at 15140. Bullish breakout candles suggest that sellers have rushed to cover while momentum traders bid up. This is a sign that sentiment remains upbeat and recent pullbacks were merely an accumulation phase for the bulls.
15500 would be the next target. 15130 near the former resistance would be the first support to let the RSI cool off the overbought zone.
FDA Approval Of The Pfizer Vaccine In Later Trading
Markets
Yesterday was all about eurozone PMIs, the final reading in the run-up to the ECB policy meeting on September 9. Business confidence remained lofty with the composite PMI coming in at 59.5 (from 60.2). The services PMI stabilized at a 15-year high (59.7). Growth in the service sector even overtook that of manufacturing for the first time in the recovery from the pandemic (manufacturing output index at 59.2). Underlying details all confirmed a strong and solid recovery is unfolding with price pressures still very much in full swing, from temporary elements including supply chain delays as well as from “wage growth as a result of the job market gain”. Strong European data along with the full FDA approval of the Pfizer vaccine in later trading (see below) helped shape the positive vibe rolling over markets, pushing equity <1% higher in Europe and 0.6-1.5% in the US. Brent oil surged more than 5% from $65 to $68.75. The German Bund underperformed USTs though finished well above intraday lows. The yield curve bear steepened with the long end 1.4 (10y) to 2 (30y) bps higher. The 10y tested the -0.46% resistance area but the move lacked thrust. Peripheral spreads widened a tad or two. The US curve steepened with the short end (3y,5y) 1.1-1.4 bps lower. The US dollar slid amid brighter sentiment. EUR/USD rose from sub 1.17 to first (minor) resistance at 1.174/5. It held a status quo against the Japanese yen, which came under selling pressure itself. EUR/JPY on the other hand left further behind 128 (finished at 128.85). The British pound, then, shrugged off a PMI disappointment. EUR/GBP fell from an intraday high just south of 0.86 to 0.856.
Wall Street’s performance inspires Asia this morning. Full risk-on gives equities wings and clips those of core bonds (US yields up to 1.8 bps higher). Major currencies (USD, EUR, JPY) trade unconvincingly and lackluster. The yen underperforms. EUR/USD is sticking to yesterday’s closing levels. We’re probably in for more dull trading today given the empty economic calendar and as the countdown to other key events including the ECB minutes, US PCE and Jackson Hole (Powell’s speech is on Friday 4pm) begins. A benign risk setting in theory gives the euro (and sterling) the upper hand. It’s also an opportunity for Germany’s 10y yield to leave the -0.50% support finally behind. It’s only very tentative, but the bottoming out process in real yields (at -2%) is a good sign in that direction. A first minor resistance in US yields is located near 1.30% (10y).
News headlines
In a deficit financing scheme similar to the one that was put in place between the Central Bank of Indonesia and the Government last year, both agreed that the central bank will again purchase government bonds worth of up to a total of 439 trillion rupiah (~ $30.50 bln) in 2021 and 2022. The interest rate on the floating rate bonds will be equal to the Bank’s three month reverse repo rate, but part of the interest rate cost will be returned to the government. The BI governor said that he couldn’t imagine buying vaccines and funding medical expenses at the market government funding cost of about 6.3%, current 10-y government bond interest rate (source Reuters).
The IMF on Monday decided to distribute about $650 billion of Special Drawing Rights to its members. According to Managing director Georgieva, the biggest ever pay-out of monetary reserves aims to provide additional liquidity, support foreign exchange reserves of member countries and make them less reliant on expensive domestic or external funding. Countries can use the SDR allocation to support their economies and step up their fight against the coronavirus crisis, but should not use the fiscal space to delay needed economic reforms or debt restructuring.
The US Food and Drug Administration on Monday gave full approval for the Pfizer/Biontech Covid-19 vaccine, the first Covid vaccine to receive this status. The vaccine now has full approval for use of people of the age of 16 and older. US officials, including US President Biden, already used this ‘full approval’ to convince citizens to have confidence in the safety and the efficacity of the vaccine and raise the global vaccination rate.