Sample Category Title
GBPUSD Lays Foundation For An Upside Reversal
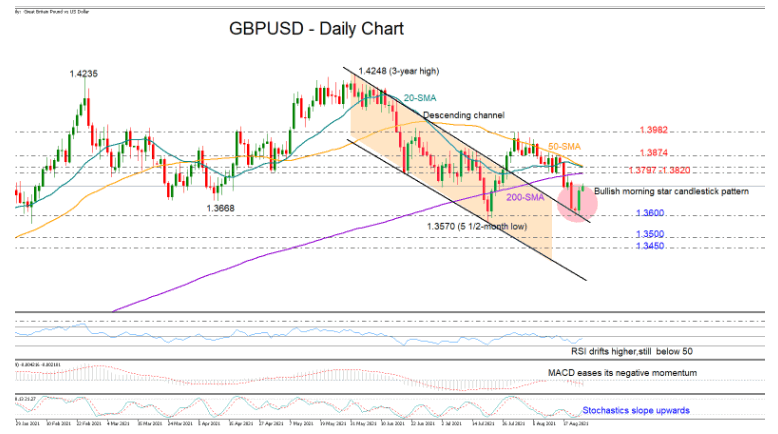
GBPUSD built the foundation for a new bullish wave after completing a morning star candlestick pattern with a tall green candle on Monday.
The cheering setup occurred near the surface of the broken descending channel, which acted as a lifesaving support this time, and around the previous low of 1.3570, further endorsing the case for an upside reversal.
In momentum indicators, signals are encouraging as well given the clear rebound in the RSI and the Stochastics, though the former has yet to climb above its 50 neutral mark, while the MACD remains below its red signal line despite somewhat easing its negative momentum.
Hence, some careful attention is still required as the price is approaching the restrictive 200-day simple moving average (SMA) at 1.3797, while within a short distance, the 50- and 20-day SMAs and the tough 1.3874 resistance could also immediately ruin the bullish mood. Higher, the rally could extend up to July’s peak of 1.3982.
Alternatively, a downside extension may retest the channel’s upper boundary and the recent lows around 1.3600. If this floor collapses, the way would clear for the 1.3500 -1.3455 area.
Summarizing, GBPUSD has set the stage for the next bullish round, but the path could be rocky as the price is converging towards a key resistance territory.
EURJPY Takes A Breather After Bearish Move
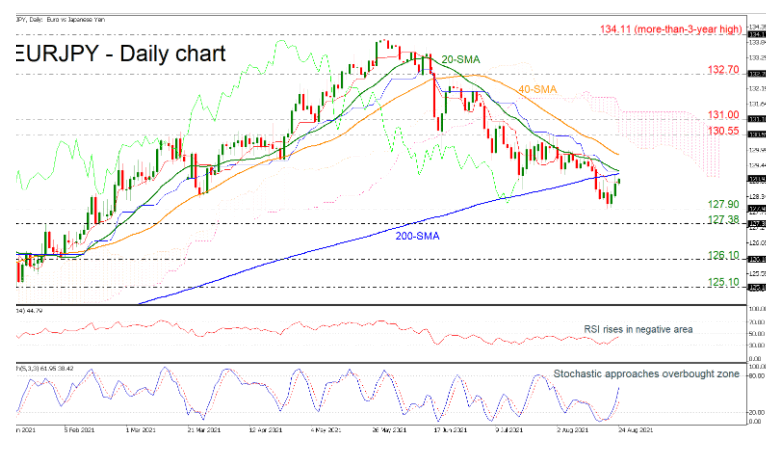
EURJPY is pointing upwards for the third straight day after the bounce off the 127.90 support level. The price is moving towards the 200-day simple moving average (SMA) and if it surpasses this line, the market could shift from bearish to neutral. The RSI indicator is mirroring the positive view, while the stochastic is approaching the overbought zone.
More bullish actions could find immediate resistance at the 40-day simple moving average (SMA) around 129.82 ahead of the 130.55 barrier. Overcoming these obstacles, the door could open for the 131.00 psychological level and next for the 132.70 hurdle.
On the other hand, a pullback of the 200-day SMA could ease the upside pressure and take the price until the 127.90 and the 127.38 supports. If the bears take the upper hand again, this could push EURJPY towards 126.10.
To conclude, EURJPY has been in a descending movement since June 1 and only a significant close above the SMAs may change this current bearish outlook.
XAUUSD Is Possibly Bearish
Technical analysis
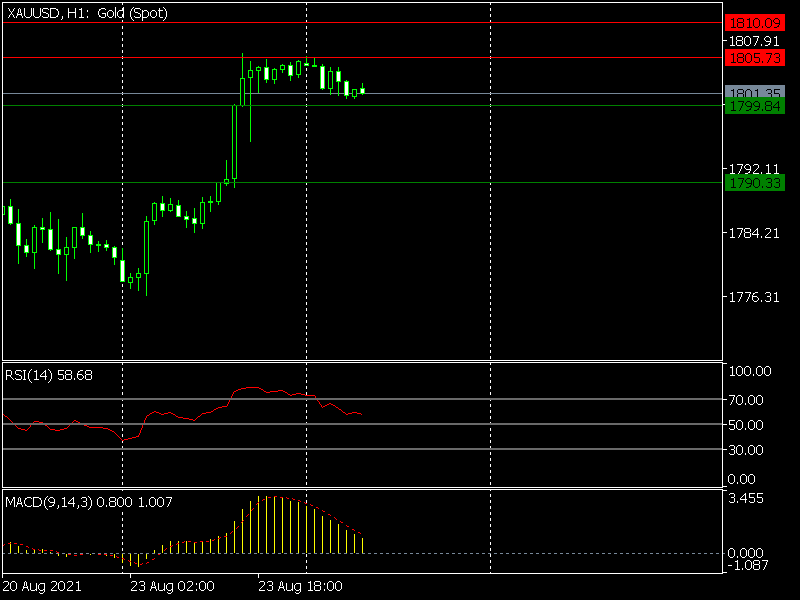
The MACD indicator line is above 0, pointing down
The RSI is above 50.
What the possible outcomes are
XAUUSD steadies above 1,800 after the strong rally of Monday trading. In the meantime, the yields of benchmark U.S. -10 year Treasury bills start to rise, marking the opposite direction for XAUUSD.
If the price passes the initial support level of 1,799.84, it could test the next lower at 1,790.33.
Alternatively, if the price reverses, then it could reach the first resistance level of 1,805.73.
A pass above the first level can move the price up higher towards 1,810.09.
Key levels
Support 1,799.84 1,790.33
Resistance 1,805.73 1,810.09
Crude Oil Price Spikes After A Fire At Mexico’s Pemex Facility
The price of crude oil continued its recovery after a major fire in a Pemex-owned facility. The fire, in Mexico, left 5 people dead and more than 420,000 barrels of oil per day off the market. Still, this supply shortage will likely not last long considering the company is considering restarting 125 wells that had been taken offline within days. Later today, the price will react to the latest inventories numbers by the American Petroleum Institute (API). The price will also react to the overall sentiment in the market about the state of the pandemic.
The US dollar declined slightly as the risk-on sentiment returned in the market. The dollar index declined by more than 0.20% in the overnight session. Investor concerns about the new wave of Covid eased after recent successes in New Zealand and China. The currency also declined after weaker-than-expected US manufacturing and services PMI numbers. The US also published strong existing home sales numbers. Later today, the statistics agency will release the latest new home sales numbers. Analysts expect the data to show that sales increased from 676k in June to 700k in July.
The economic calendar will be relatively muted today. The key economic numbers to watch will be the second reading of the German GDP data that will come out in the morning session. The data is expected to show that the economy expanded by 1.5% on a QoQ basis and by 9.6% on an annualized basis. Earlier on, New Zealand published strong quarterly retail sales numbers. The sales increased from 3.2% in the first quarter to 3.4% in the second quarter. Investors will also keep an eye on the rebounding stock and cryptocurrencies market.
EURUSD
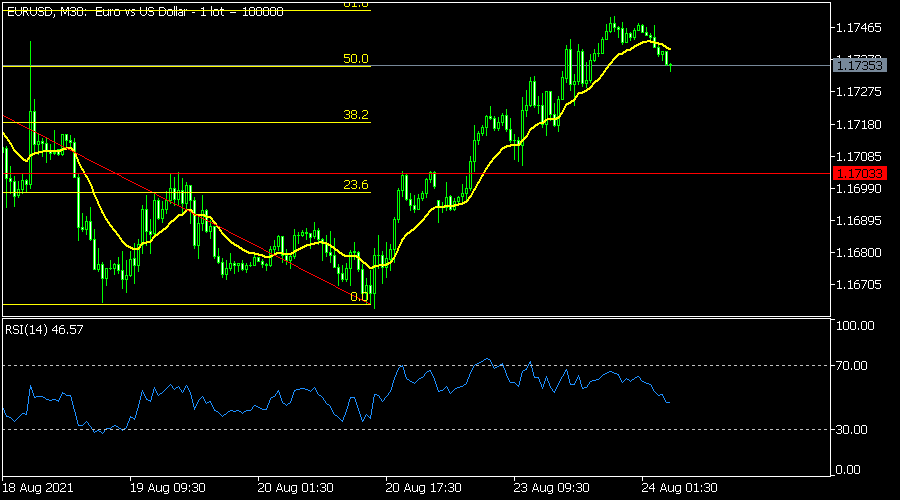
The EURUSD pair was little changed in the overnight session. It is trading at 1.1735, which was a few pips below yesterday’s high at 1.1752. On the 30-minute chart, the pair has moved back to the 30-minute chart while the Relative Strength Index shows that a bearish divergence pattern has happened. The pair even crossed the 25-period moving average. Therefore, it will likely maintain the bearish trend as investors wait for the Jackson Hole summit.
XBRUSD
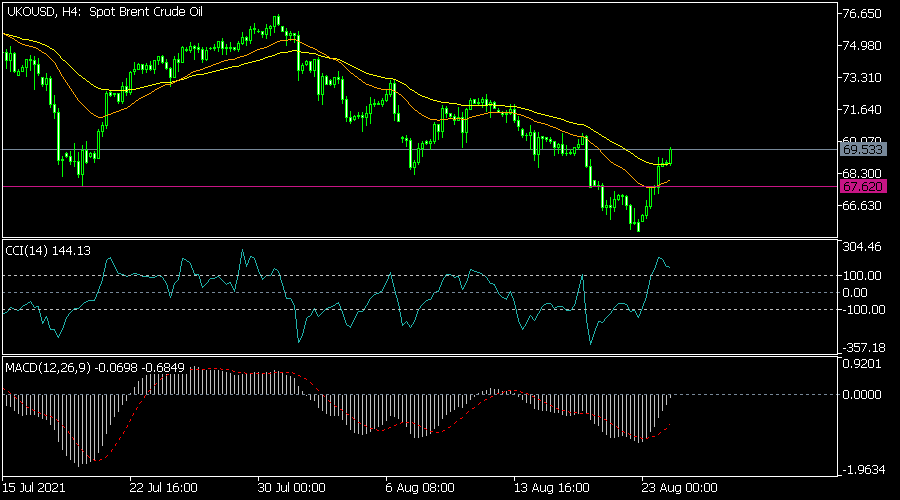
The price of Brent crude oil rose to an intraday high of 69.57, which was substantially higher than last week’s low of 65.23. On the four-hour chart, the pair managed to cross the 25-day and 15-day moving averages while oscillators like DeMarker, MACD, and the Relative Strength Index (RSI) continued their bullish trend. The pair will likely maintain the bullish momentum as investors target moves above the key resistance at 70.0.
NZDUSD
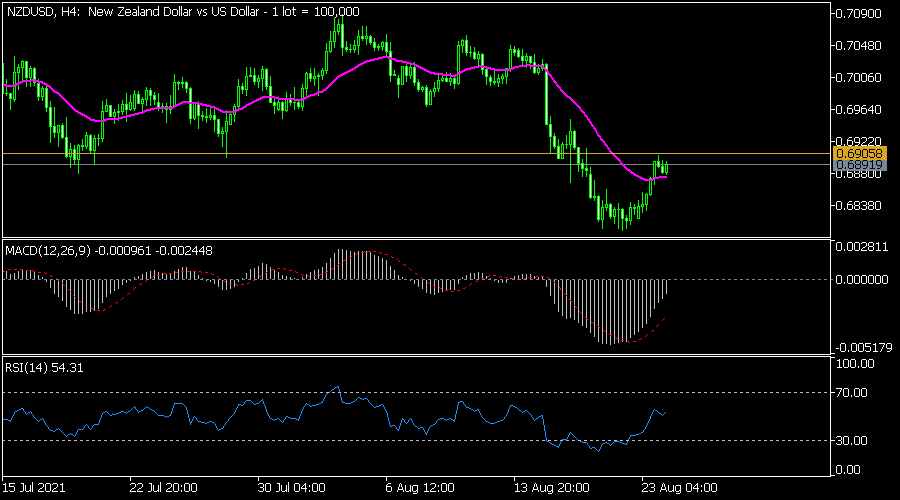
The NZDUSD pair jumped to an intraday high of 0.6900 after positive New Zealand retail sales numbers. On the four-hour chart, the pair managed to move above the 25-day moving average while the MACD has made a bullish crossover. It also retested the key resistance at 0.6900, which was the lowest level in July. The Relative Strength Index (RSI) has moved from the oversold level of 29 to 54. Therefore, the pair will likely maintain the bullish trend today.
RBNZ Hawkesby said 50bps hike actively considered, NZD/USD jumps
RBNZ Assistant Governor Christian Hawkesby told Bloomberg that the decision to stand pat on OCR last week was mostly due to communications problem. It's hard to explain the case when if the rate hike was delivered on the same day as New Zealand returned to pandemic lockdown.
He added that the decision was not due to risks and the policy decisions "won't be tightly linked" to COVID -19. Demand as proven to be more resilient than anticipated.
Most surprisingly, Hawkesby also indicated that the central bank has considered a 50bps rate hike. "A 50 basis point move was definitely on the table in terms of the options that we actively considered," he said.
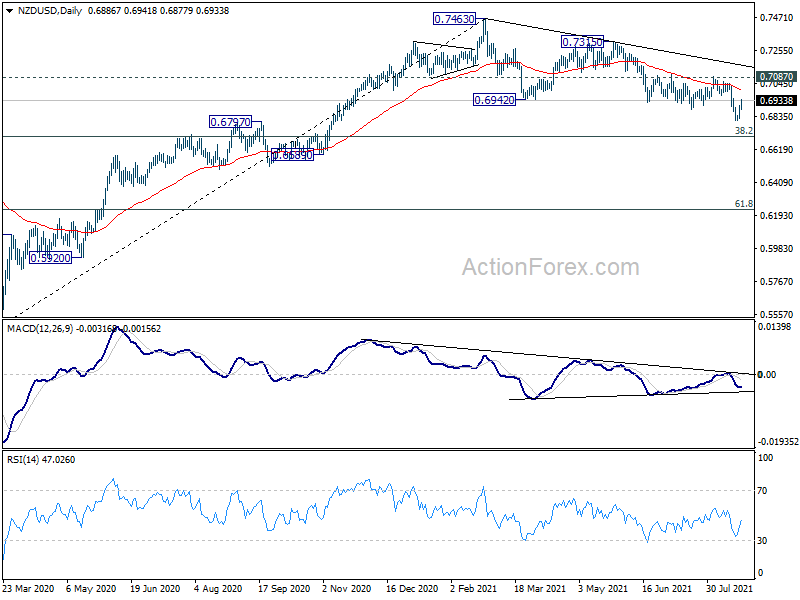
NZD/USD's rebound form 0.6804 accelerated higher today but stays well below 0.7087 resistance so far. It's too early to say that the corrective pattern from 0.7463 has completed, with NZD/USD staying even below 55 day EMA. NZD/USD could have another dip to 38.2% retracement of 0.5467 to 0.7463 at 00.6701 before resuming the medium term up trend.
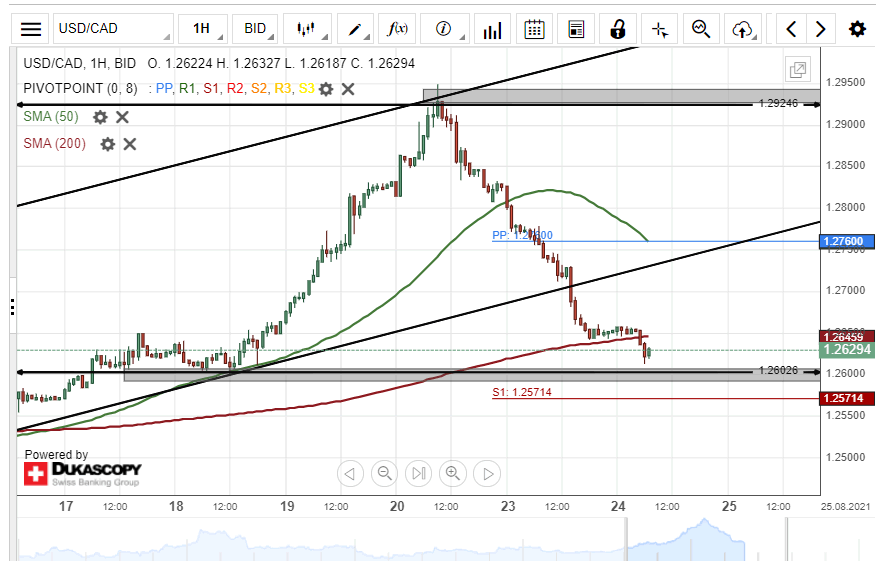
USD/CAD Breached Channel Pattern
Downside risks pressured the USD/CAD currency pair lower on Monday. As a result, the US Dollar declined by 188 pips or 1.47% against the Canadian Dollar during yesterday's trading session.
Given that a breakout has occurred through the lower line of an ascending channel pattern, bearish traders are likely to continue to drive the exchange rate south during the following trading session.
However, the weekly support level at 1.2571 could provide support for the currency exchange rate within this session.
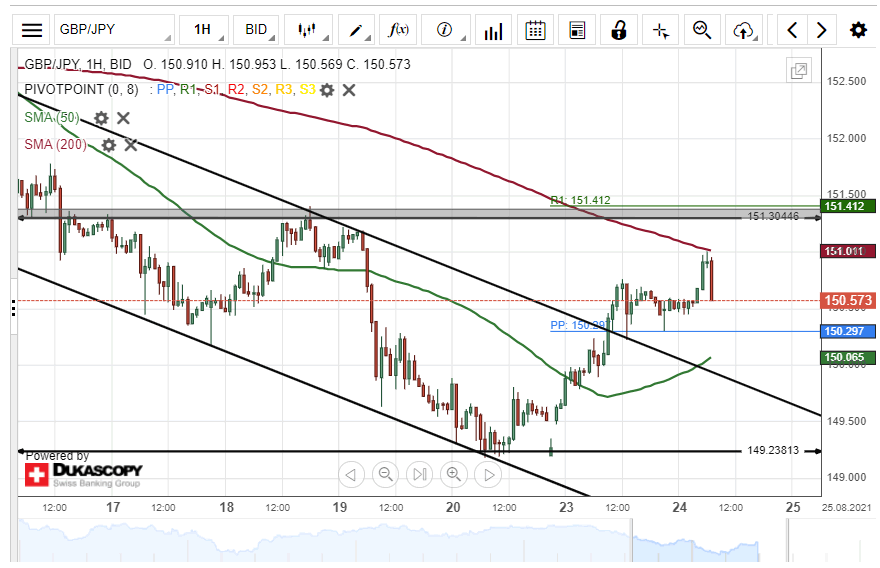
GBP/JPY Breakout Occurs
On Monday, the British Pound surged by 126 pips or 0.84% against the Japanese Yen. A breakout occurred through the upper boundary of a descending channel pattern during yesterday's trading session.
Given that a breakout has occurred, bullish traders are likely to continue to pressure the exchange rate price higher during the following trading session.
However, the 200– hour simple moving average at 151.04 could provide resistance for the GBP/JPY currency exchange rate within Tuesday's trading session.
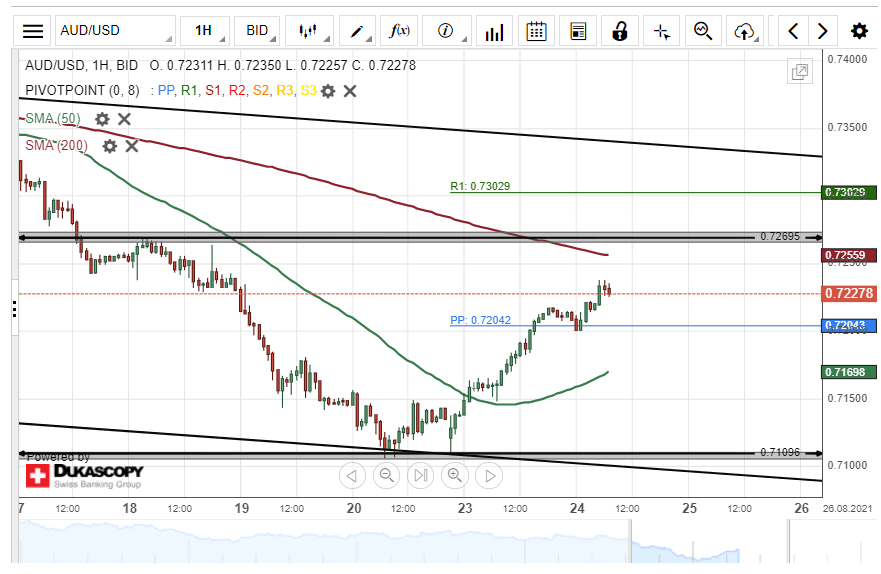
AUD/USD Bullish Run Likely To Continue
Upside risks dominated the AUD/USD currency pair on Monday. As a result, the Australian Dollar surged by 93 pips or 1.31% against the US Dollar during yesterday's trading session.
All things being equal, the exchange rate is likely to continue to edge higher during the following trading session. The possible target for bullish traders will be near the weekly resistance level at 0.7302.
However, the 200– hour simple moving average at 0.7259 could provide resistance for the currency exchange rate in the shorter term.
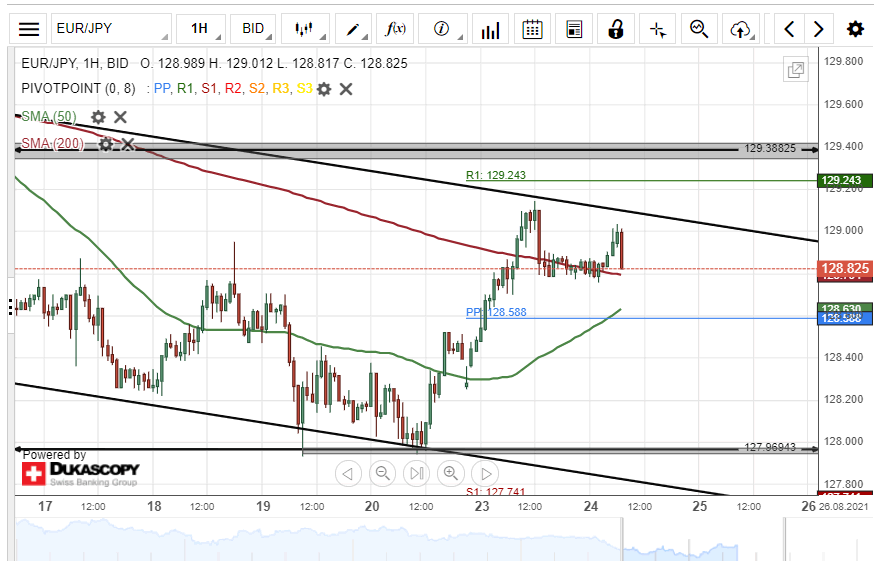
EUR/JPY Breakout Could Occur
On Monday, the European single currency edged higher by 82 pips or 0.64% against the Japanese Yen. The currency pair breached the 200– hour simple moving average during Monday's trading session.
As for the near future, the EUR/JPY exchange rate could continue to edge higher. A breakout through the upper line of a descending channel pattern might occur within this session.
However, if the channel pattern holds, a decline towards a support cluster formed by the weekly pivot point and the 50– hour SMA at 128.58 during the following trading session.
Daily Tecnical Analysis
EUR/USD
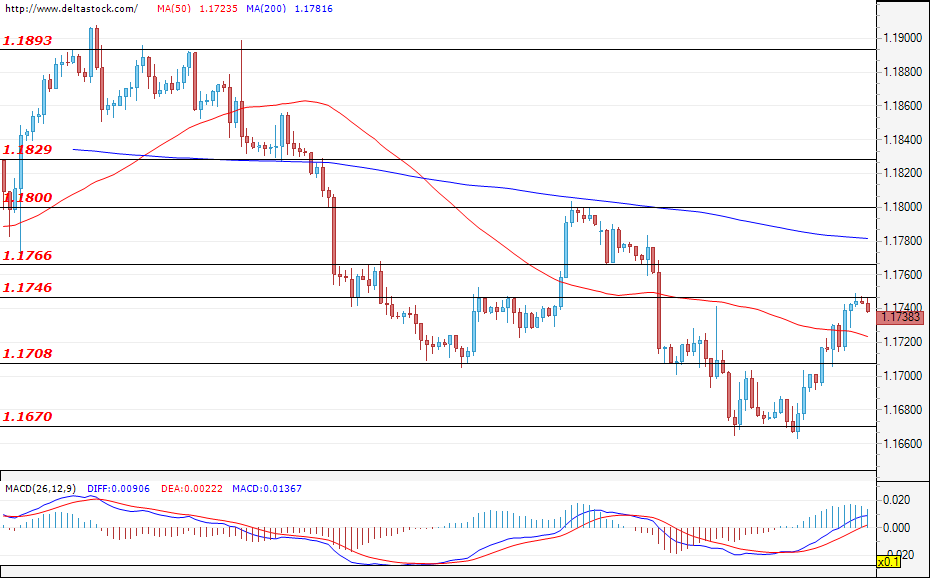
Current level - 1.1738
The confirmation of the breach of the zone at 1.1708 helped the euro to continue to recover some of its recent losses against the dollar. During the early hours of today’s trading, the pair tested the resistance level at 1.1746, but only a violation of the next target at 1.1766, followed by a move above the level at 1.1800 could strengthen positive expectations for the future path of EUR/USD. If bears re-enter the market, we will most likely witness a move towards the support zone at 1.1708. A successful breach of the mentioned level would easily put an end to the positive move and pave the way for the EUR/USD to attack the important support zone at 1.1670.
| Resistance | Support | ||
| intraday | intraweek | intraday | intraweek |
| 1.1746 | 1.1800 | 1.1708 | 1.1600 |
| 1.1766 | 1.1830 | 1.1670 | 1.1530 |
USD/JPY
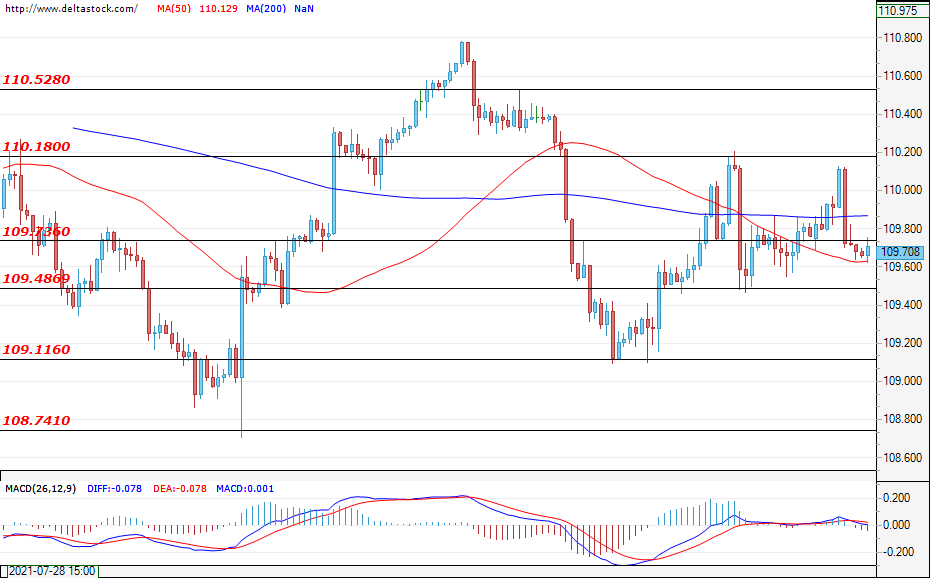
Current level - 109.70
During yesterday’s trading session bulls lost momentum and bears prevailed. The greenback depreciated against the yen and the pair consolidated under the support level at 109.73. At the time of writing, the currency pair continues to trade in the zone between 109.49 and 110.18 and only a successful breach of one of the borders could set a clear direction for the USD/JPY. If bears continue to prevail and violate the level at 110.18, the sell-off will most likely deepen towards the support zone at 109.12. The first target for the bulls is still the mentioned resistance at 110.18, followed by the local high at 110.52.
| Resistance | Support | ||
| intraday | intraweek | intraday | intraweek |
| 110.18 | 110.52 | 109.48 | 109.11 |
| 110.52 | 111.00 | 109.11 | 108.74 |
GBP/USD
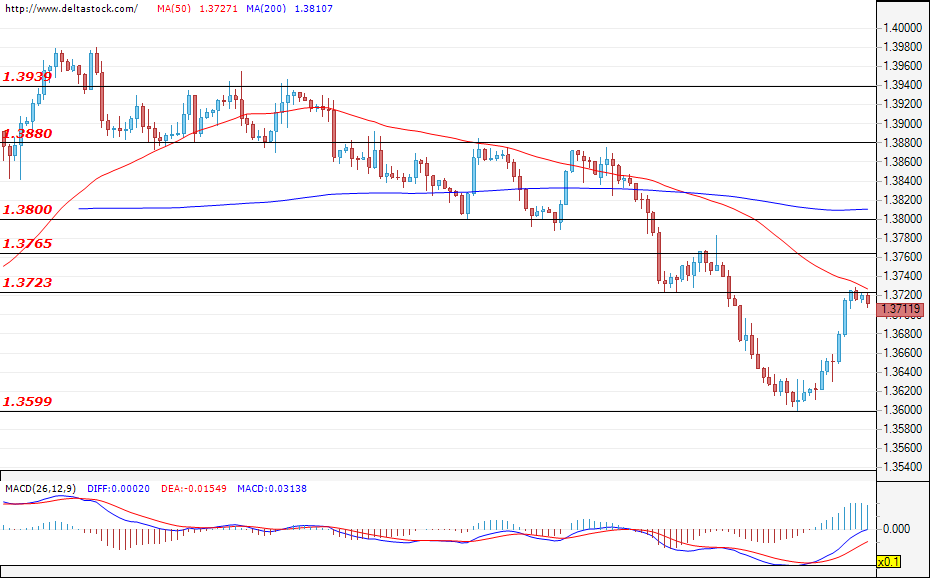
Current level - 1.3711
The sterling gained some ground against the dollar and the pair is testing the resistance zone at 1.3723. A successful breach could lead to a more sustained recovery of the Cable and will most likely lead to a test of the next target at 1.3765, followed by the level at 1.3800. If bears re-enter the market and the resistance at 1.3723 is not breached, the pair will most likely head towards the support zone at 1.3599. If the aforementioned level is breached, the negative expectations for the GBP/USD will be strengthened and the Cable will most likely suffer more losses.
| Resistance | Support | ||
| intraday | intraweek | intraday | intraweek |
| 1.3723 | 1.3880 | 1.3600 | 1.3508 |
| 1.3765 | 1.3939 | 1.3567 | 1.3508 |