Sample Category Title
USD/JPY Analysis: Returns To Pattern
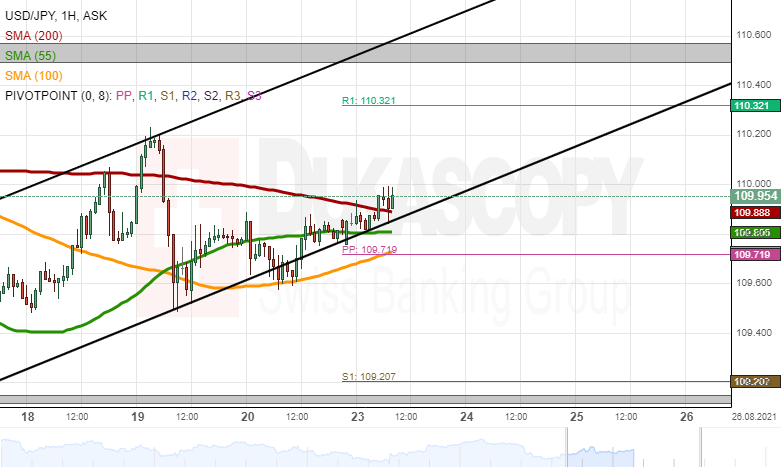
The USD/JPY passed the supporting trend line of the channel up pattern, which guided the rate since August 15. However, the 100-hour simple moving average almost immediately provided the pair with additional support. Afterwards, the rate returned to trading in the borders of the channel.
On Monday morning, the USD/JPY currency exchange rate was testing the resistance of the 110.00 level.
In the case that the rate manages to surge, it could reach for the resistance of the weekly R1 simple pivot point at 110.32. On the other hand, a decline would most likely find support in the 55 and 200-hour simple moving averages and the lower trend line of the channel up pattern in the 109.80/109.90 zone.
Gold Analysis: Remains Below 1,800.00
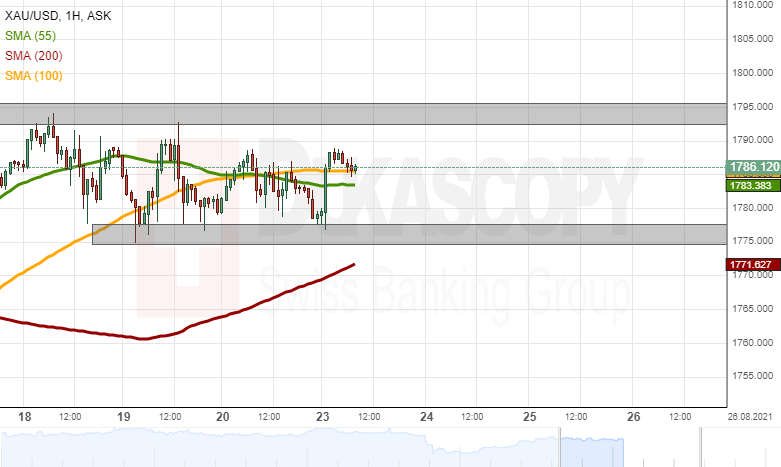
Since August 18, the yellow metal's price has been fluctuating between the support of the 1,775.00/1,777.00 zone and the resistance of the 1,792.00/1,796.00 levels. Meanwhile, the commodity price was ignoring the 55 and 100-hour simple moving averages that were located between the mentioned zones.
In the case of a surge above the 1,792.00/1,796.00 zone, the commodity price would almost immediately face the resistance of the 1,800.00 level. Above the 1,800.00 mark, the price could reach for the previous August high levels near 1,830.00.
On the other hand, a potential decline below the support zone of 1,775.00/1,777.00 could look for support in the 200-hour simple moving averages.
AUD/NZD Decline Could Continue
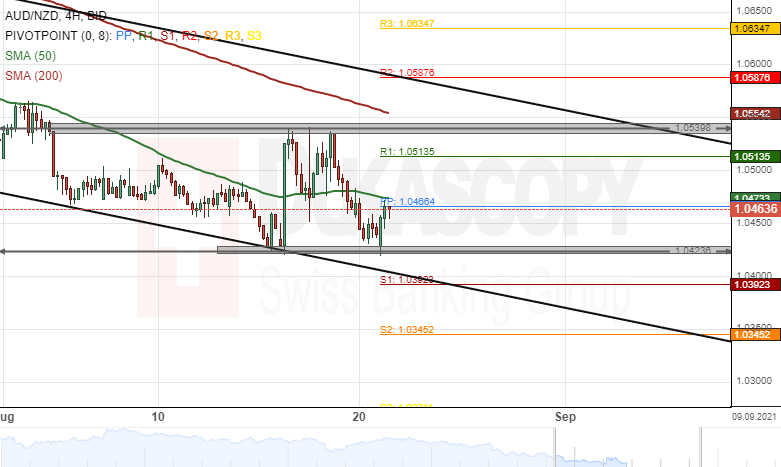
The Australian Dollar declined by 101 pips or 0.96% against the New Zealand Dollar last week. The AUD/NZD currency pair breached the 50– hour simple moving average during last week's trading sessions.
Technical indicators suggest selling signals on the 4-hour, daily and weekly time-frame charts. Most likely, bears could continue to drive the exchange rate lower during the following trading sessions.
However, sellers might encounter a support level at 1.0423 within this week's trading sessions.
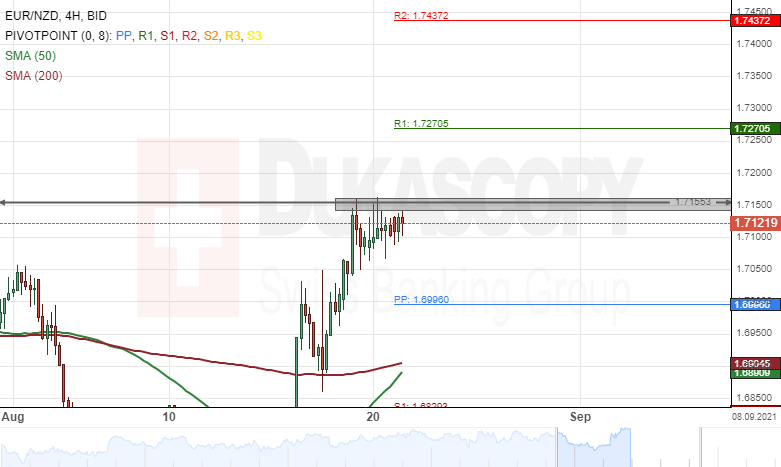
EUR/NZD Remains Near 1.7150
The common European currency has surged by 3.00% against the New Zealand Dollar during the last two weeks. The currency pair tested the 1.7150 level last week.
Currently, the exchange rate is trading near the resistance level near the 1.7150 area.
If the EUR/NZD pair breaks the resistance line, a surge towards the weekly R2 at 1.7437 could be expected this week.
However, if the resistance level holds, bearish traders might pressure the currency exchange rate lower during the following trading sessions.
UK PMI manufacturing dropped to 60.1, services tumbled to 55.5
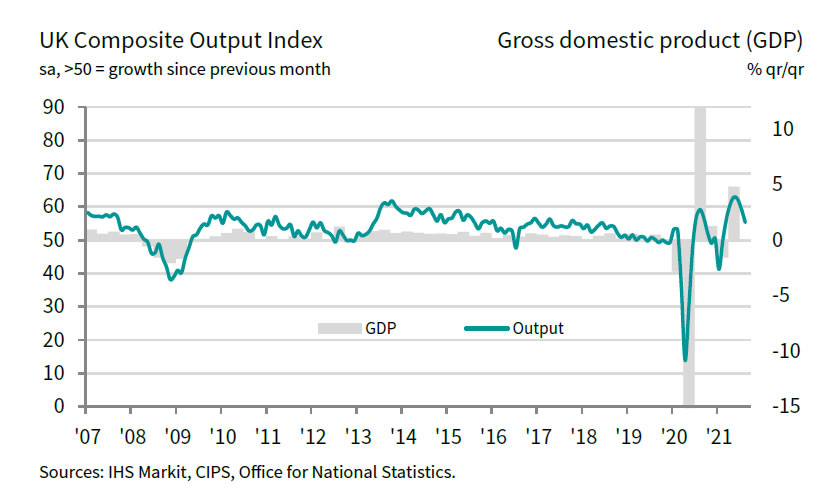
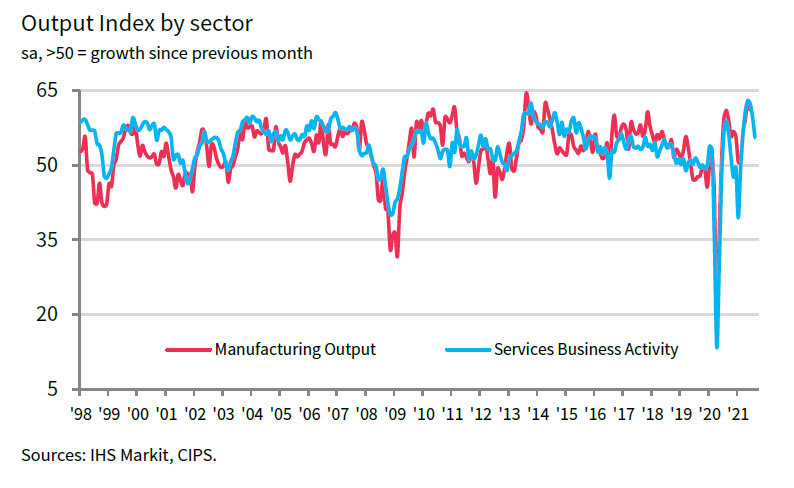
UK PMI Manufacturing dropped from 60.4 to 60.1 in August, above expectation of 59.5. PMI Services dropped notably from 59.6 to 55.5, below expectation of 59.0. PMI Composite dropped from 59.2 to 55.3.
Chris Williamson, Chief Business Economist at IHS Markit, said: "Although the PMI indicates that the economy continues to expand at a pace slightly above the pre-pandemic average, there are clear signs of the recovery losing momentum in the third quarter after a buoyant second quarter... rising virus case numbers are deterring many forms of spending... Supplier delays have risen to a degree exceeded only once before... Prices have risen sharply again, albeit with the rate of inflation moving below July's record high.
"More positively, business expectations for the year ahead perked up in August, encouraging a record jump in employment as furloughed workers were brought back to the workplace. However, demand and supply availability need to improve further for this rise in employment to be sustained in coming months"
Eurozone PMI composite ticked down to 59.5, recovery retained impressive momentum
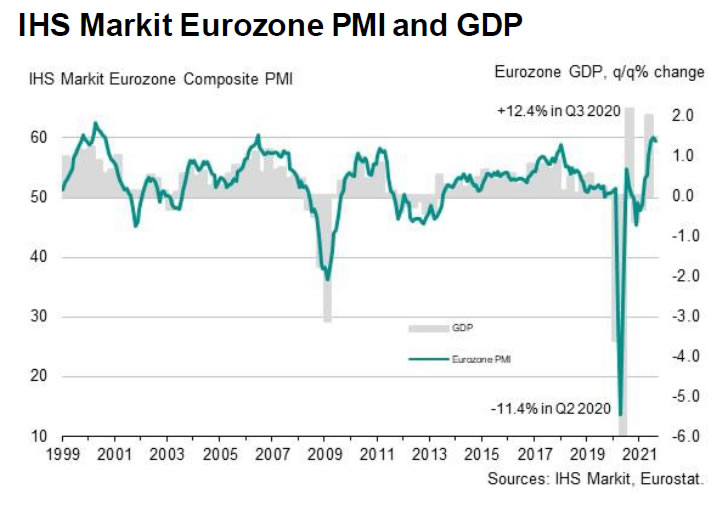
Eurozone PMI Manufacturing dropped from 62.8 to 61.5 in August, below expectation of 62.0. PMI Services dropped from 59.8 to 59.7, below expectation of 59.8. PMI Composite dropped from 60.2 to 59.5.
Chris Williamson, Chief Business Economist at IHS Markit said: "The eurozone's economic recovery retained impressive momentum in August, with the PMI dipping only slightly from July's recent high to put its average in the third quarter so far at the highest for 21 years... Firms benefited from virus containment measures easing to the lowest since the pandemic began...
"Supply chain delays continue to wreak havoc... combined with surging demand, led to another near-record increase in average selling prices for goods and services, though there are some welcome signs that these inflationary pressures may have peaked for now. Encouragement comes from a second month of job creation at the strongest for 21 years... some upward movement on wage growth... which could feed through to higher inflation".
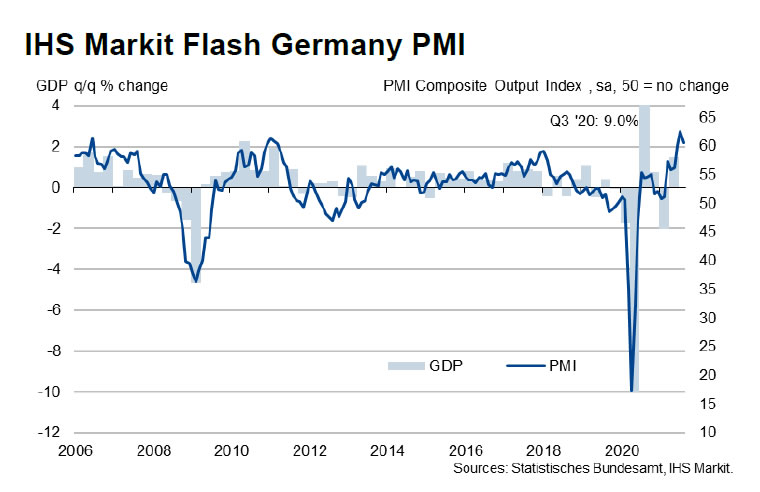
Germany PMI composite dropped to 60.0, still firmly inside growth territory
Germany PMI Manufacturing dropped from 65.9 to 52.7 in August, below expectation of 65.0. PMI Services dropped from 61.8 to 61.5, above expectation of 61.0. PMI Composite dropped from 62.4 to 60.6.
Phil Smith, Associate Director at IHS Markit said: "With August's flash PMI still firmly inside growth territory, the recovery of the German private sector looks to be continuing at a healthy pace. Although growth has slowed down since July, the data are still pointing to a stronger economic expansion in the third quarter than the provisional 1.5% increase in GDP seen in the three months to June."
France PMI composite dropped to 55.9, another strong month of growth
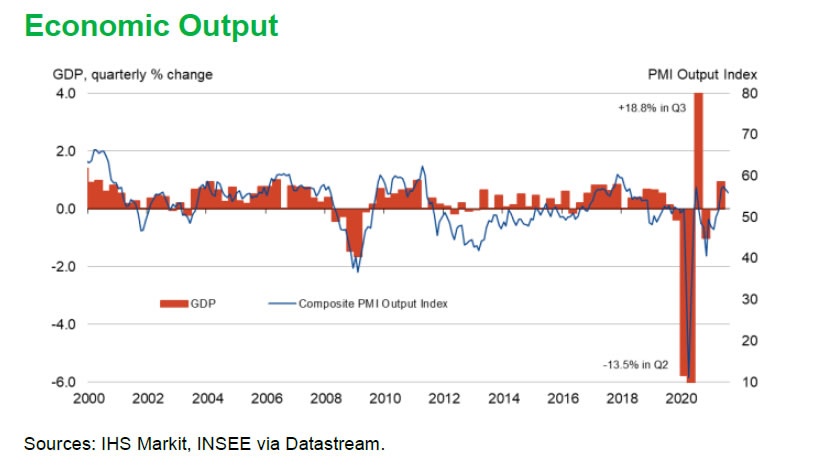
France PMI Manufacturing dropped from 58.0 to 57.3 in July, matched expectations. PMI Services dropped from 56.8 to 56.4, below expectation of 57.0. PMI Composite dropped from 56.6 to 55.9.
Joe Hayes, Senior Economist at IHS Markit said: "Another strong month of growth across France was signalled by the flash PMI figure for August. Despite some of the challenges businesses are facing on the supply side, it's encouraging to see PMI data consistently signalling robust expansion. Furthermore, given we're now midway through the third quarter, the survey data up to this point suggest we could see another decent out turn in the corresponding GDP figure."
EURUSD Set To Rebound But No Guarantees Yet
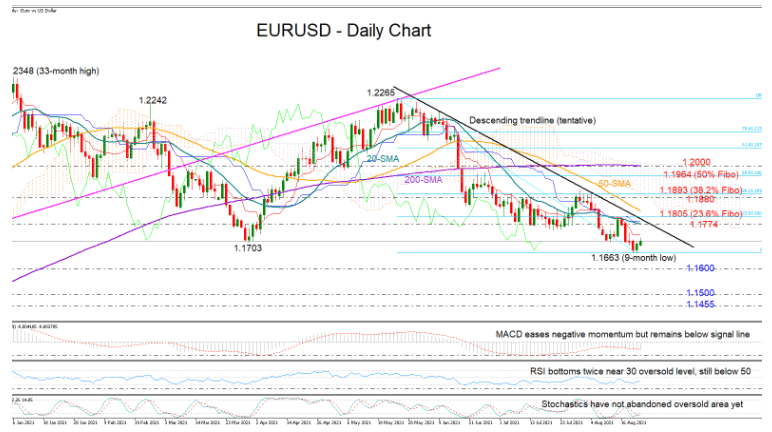
EURUSD is pushing for a rebound after its latest downfall snapped the March trough of 1.1703 to mark a new lower low at 1.1663, the lowest since November 2020.
Despite the bullish appetite in the price, the technical indicators cannot guarantee any sustainable recovery in the market yet. The RSI has bottomed twice near its 30 oversold mark, but it continues to fluctuate within the bearish area, while the Stochastics haven’t officially abandoned the oversold region yet. Likewise, the MACD, although somewhat stronger, remains below its red signal line, while the Ichimoku indicators show no effort in correcting their recent bearish intersection.
Hence, the 20-day simple moving average (SMA) and the tentative descending trendline drawn from the 1.2265 peak currently both around 1.1774 will remain a major challenge for the bulls in the short term. Slightly higher, the 23.6% Fibonacci retracement of the 1.2265 – 1.1663 downleg at 1.1800, where the 50-day SMA is converging, could cement this wall, blocking any move towards the 1.1880 resistance territory and the 38.2% Fibonacci of 1.1893.
In the case the price drifts southwards, breaking the 1.1663 low, all eyes will turn to the crucial 1.1600 support area, which prompted the sharp rally to the top of 1.2348 last Autumn. Failure to hold above this floor could trigger a more aggressive sell-off towards the 1.1500 – 1.1455 zone.
Summarizing, bearish risks persist in EURUSD despite the latest attempts for a rebound and they are expected to strengthen if the price closes clearly below 1.1663. In the event of an upside reversal, all eyes will turn to the 1.1780 – 1.1800 area.
Daily Tecnical Analysis
EUR/USD
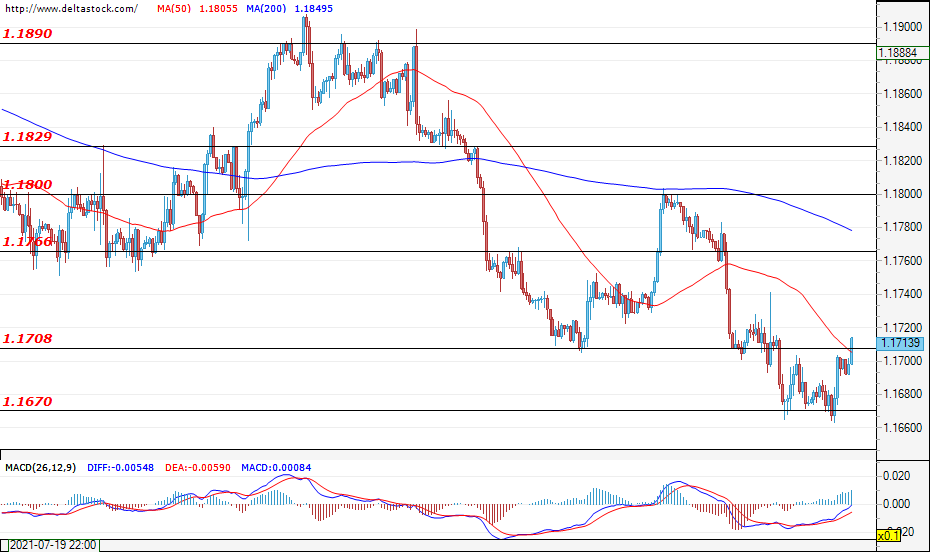
Current level - 1.1714
The support at 1.1670 managed once again to resist the bearish pressure and the expectations for today's trading session are for the pair to remain within the range between 1.1670 - 1.1766. Only a breach of the support at 1.1670 would lead to a sell-off, targeting the levels at around 1.1600. At the time of writing, a move towards the resistance at 1.1760 is a possible scenario before the downtrend is to continue. If the mentioned resistance is breached, the EUR/USD will most likely head towards the resistance at 1.1800.
| Resistance | Support | ||
| intraday | intraweek | intraday | intraweek |
| 1.1708 | 1.1800 | 1.1670 | 1.1600 |
| 1.1766 | 1.1830 | 1.1600 | 1.1530 |
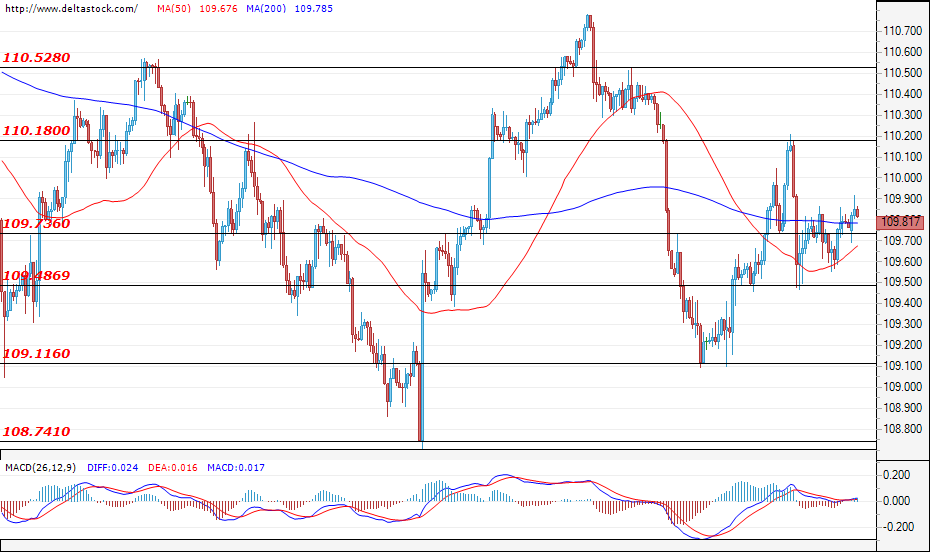
USD/JPY
Current level - 109.80
After the successful breach of the resistance at 109.73, the expectations for today's trading session are for a test of the resistance at 110.18. However, it is very likely that trading will remain locked in the range between 109.50-110.20. The stronger support, in case the pair starts to decline, is the level of 109.50 which, if breached, should lead to a move towards the support zone at 108.74.
| Resistance | Support | ||
| intraday | intraweek | intraday | intraweek |
| 110.18 | 110.52 | 109.73 | 109.11 |
| 110.52 | 111.00 | 109.48 | 108.74 |
GBP/USD
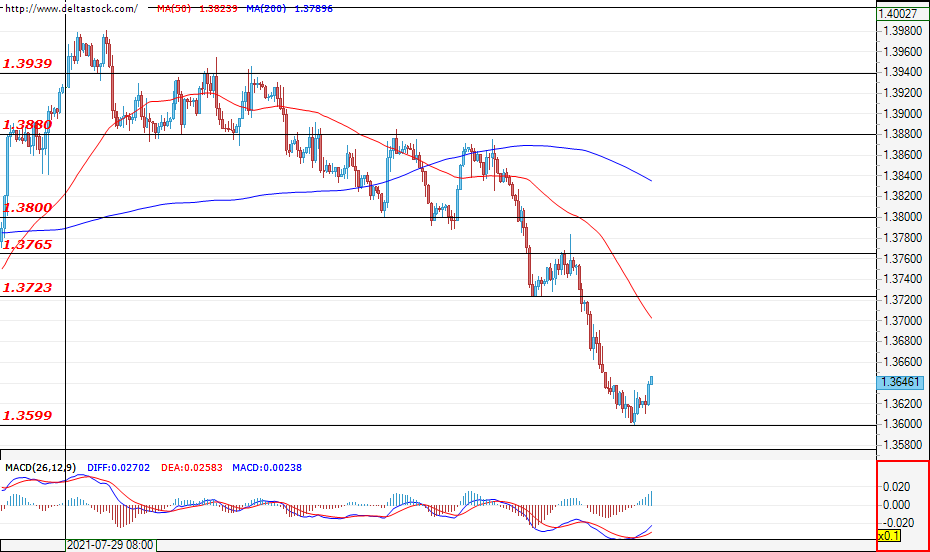
Current level - 1.3646
The currency pair is testing the psychological level at 1.3600 and, at the time of writing the analysis, there is a corrective movement which will most likely lead to a move towards the resistance at 1.3720. During today's trading session, the more important economic news that could lead to an increase in volatility is the preliminary manufacturing PMI and the preliminary services PMI at 08:30 GMT.
| Resistance | Support | ||
| intraday | intraweek | intraday | intraweek |
| 1.3723 | 1.3800 | 1.3600 | 1.3508 |
| 1.3765 | 1.3880 | 1.3567 | 1.3508 |