Sample Category Title
Euro Punches Past 1.17 On Solid PMIs
The euro has started the week on a positive note, extending the gains seen on Friday. EUR/USD has pushed into 1.17-territory and is trading at 1.1715, up 14% on the day.
PMIs point to solid growth
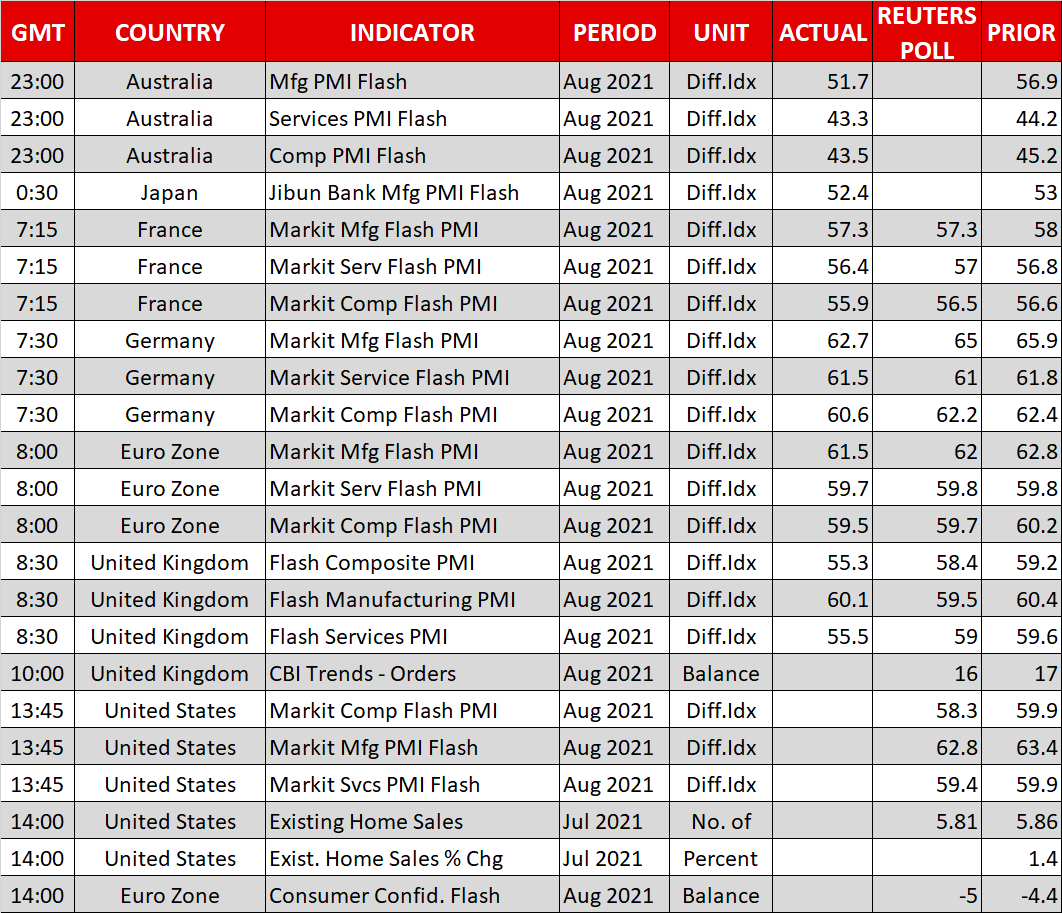
The German economy is the bellwether for the entire eurozone, so investors were keen to see the flash PMI reports for Germany’s manufacturing and services sectors for August. The readings continued to point to strong expansion, although the July figures showed an easing in the rate of expansion. Manufacturing PMI dipped to 62.7 (Jul. 65.9), while Services PMI ticked lower to 61.5 (Jul. 61.8).
The PMI Manufacturing release was the lowest in six months, as manufacturers reported material shortages, which has weighed on factory production output. Meanwhile, services was just shy of the July record, as employment levels rose and demand for goods increased.
The solid PMIs have helped the euro extend its gains, after a rough week against the dollar in which the euro slipped 0.8%. Can the euro continue to recover? We are seeing a risk-on mood in the Asian markets on Monday after last week’s fall in risk appetite saw the US dollar make strong gains against the majors. If investor risk appetite continues to improve, the euro could make a move towards the 1.18 line.
Inflation has jumped in the eurozone, with CPI rising 2.2% in July, its highest level in three years. Taking a page out of the Fed playbook, the ECB has reiterated the higher inflation is transitory, and as a result of this stance, the markets don’t expect any rate hikes for the next three years. In July, President Christine Lagarde said that the ECB would not hike rates until inflation remained ‘sustainable’ at 2%, and nobody is holding their breath for this target to be reached or breached anytime soon.
EUR/USD Technical
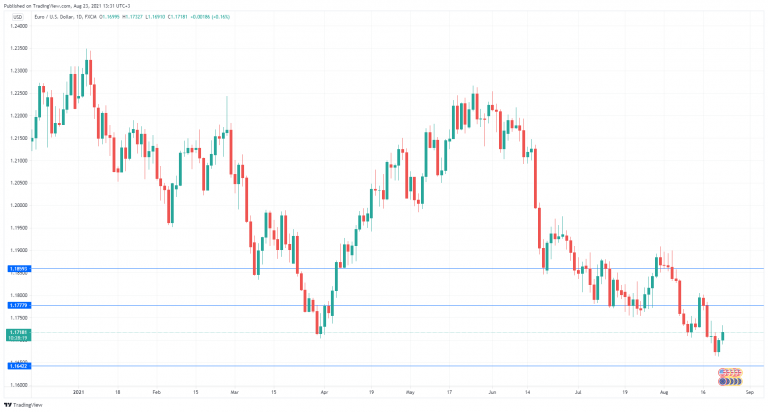
- There are resistance lines at 1.1779 and 1.1859
- On the downside, we find support lines at 1.1642 and 1.1585
USD Retreats As Attention Shifts To PMI Figures
The greenback weakened on Friday and during today's Asian session against a number of its counterparts yet tends to remain at rather high levels fueled by worries regarding the pandemic, while the market's attention turns to the Jackson Hole summit on Thursday and Friday. The Aussie recovered some ground against the USD during today's Asian session, yet fundamentals tend to weigh given that a large part of the population back home is under lockdown rules, while iron ore prices recovered very little if any after their drop at the beginning of the month. EUR traders turn their attention to today's release of the preliminary PMI figures for August and worries seem to concentrate on Germany's manufacturing sector as its expansion of economic activity is expected to slow down. Gold prices remained rather stable given that the USD still remains at rather high levels yet worries about a possible economic slowdown due to the pandemic tend to feed it. US stockmarkets tended to recover some of the lost ground on Friday, as worries for a possible monetary policy tightening by the Fed tended to ease.
The USD Index dropped on Friday and during today's Asian session, after testing the 93.65 (R1) resistance line, which held its ground. We tend to maintain a bias for a sideways motion for the index for the time being, given that the index's price action has broken the upward trendline guiding it from the 16th of the month until the 20th. Please note that the RSI indicator below our 4-hour chart remains near but above the reading of 50, which may imply a rather indecisive market. Should a selling interest be displayed we may see the index breaking the 93.20 (S1) support line and aim for the 92.75 (S2) level. Should the USD be in high demand, we may see the index breaking the 93.65 (R1) resistance line which capped the index's price action on Friday the 20th of August and aim for the 94.15 (R2) resistance level.
EUR/USD rose on Friday breaking the 1.1695 (S1) resistance line, now turned to support. Given that the pair's downward motion was interrupted, we switch our bearish outlook in favor of a sideways movement initially. Please note that the RSI indicator below our 4-hour chart is at the reading of 50 underscoring the market's indecisiveness. Should the bears take over, we may see EUR/USD breaking the 1.1695 (S1) support line and aim for the 1.1605 (S2) level. Should the buyers take over the initiative for the pair's direction, we may see EUR/USD aiming if not breaking the 1.1785 (R1) line which created substantial commotion from the 19th to the 26th of July and if broken it could open the way for the 1.1885 (R2) resistance level.
Other economic highlights today and the following Asian session:
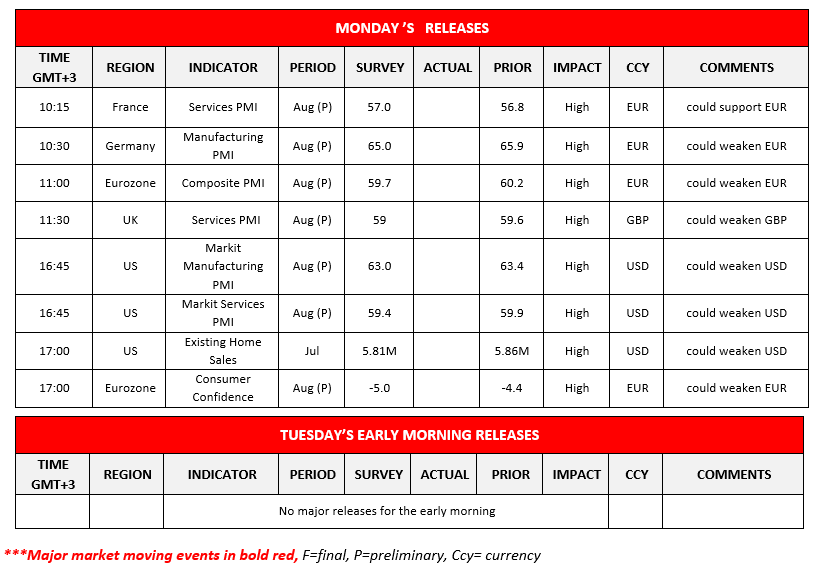
Today, we get France's, Germany's, the Eurozone's, UK's and the US preliminary Markit PMI readings for August, while we also note in the American session the release of the US existing home sales figure for July and Eurozone's preliminary consumer confidence for August.
As for the rest of the week
On Tuesday, we get Germany's GDP rate for Q2 and the US new home sales for July. On Wednesday, we get New Zealand's Trade Balance for July, Germany's Ifo indicators for August and the US durable goods orders for July. On Thursday, we get Australia‘s capital expenditure for Q2, Germany‘s GfK consumer sentiment for September, Frances‘ business climate for August the US GDP estimate for Q2, the US Core PCE prices for Q2, the weekly initial jobless claims figure while in Jackson Hole the Fed‘s three-day Summit begins. On Friday, we get from Japan Tokyo's CPI rates for August Australia's, Retail sales (final) for July and from the US the consumption rate for July, the core PCE price index for July and the final University of Michigan consumer sentiment for August.
USD Index H4 Chart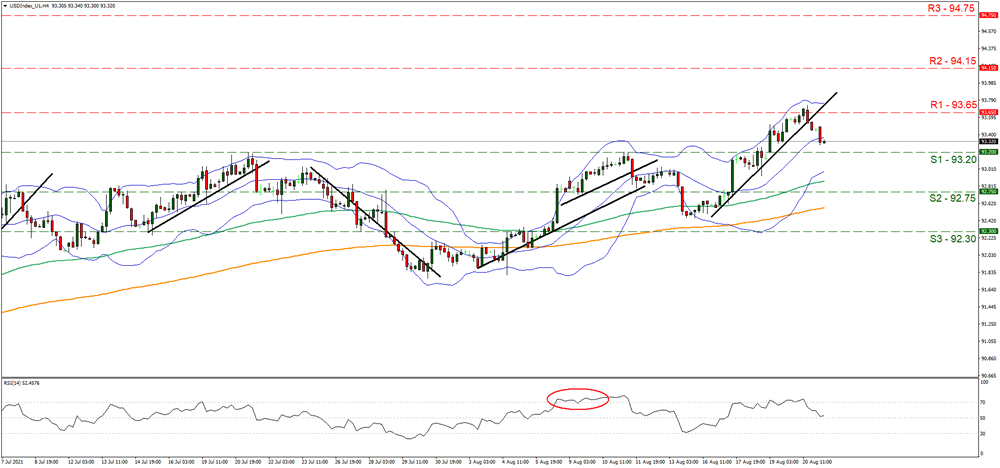
Support: 93.20 (S1), 92.75 (S2), 92.30 (S3)
Resistance: 93.65 (R1), 94.15 (R2), 94.75 (R3)
EUR/USD H4 Chart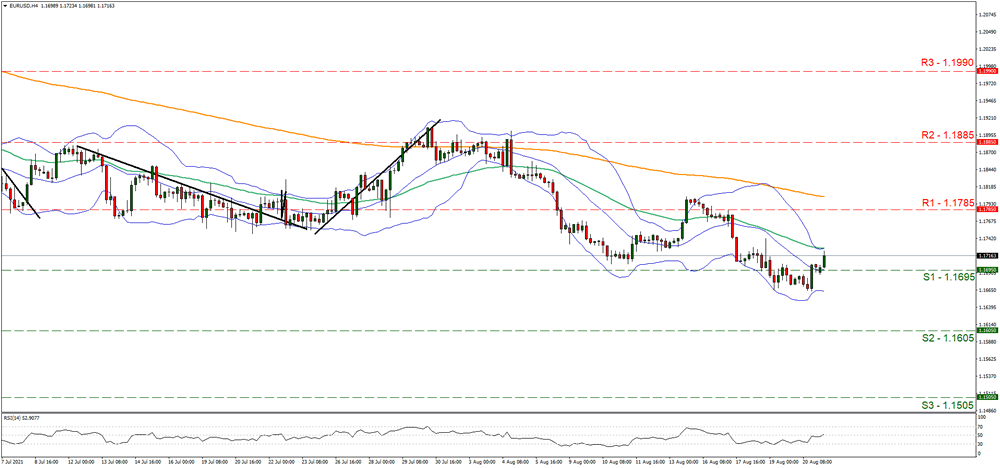
Support: 1.1695 (S1), 1.1605 (S2), 1.1505 (S3)
Resistance: 1.1785 (R1), 1.1885 (R2), 1.1990 (R3)
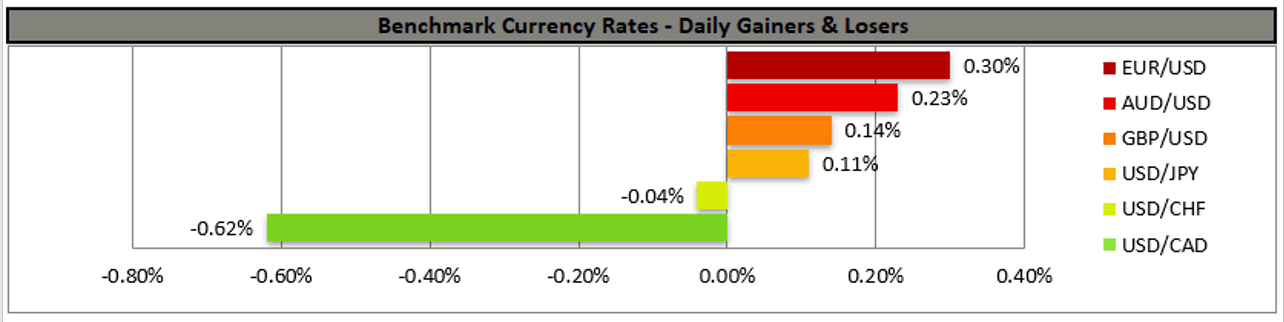
The Analytical Overview Of The Main Currency Pairs
The EUR/USD currency pair
Technical indicators of the currency pair:
Prev Open: 1.1674
Prev Close: 1.1700
% chg. over the last day: +0.22%
The decrease in the dollar index has led to a slight increase in the quotes of the EUR/USD currency pair. A lot will now depend on the performance of the dollar index and the decisions of the Federal Reserve. If the soft monetary policy remains unchanged until the end of the year, the Euro might get much stronger in the near future. A lot of macroeconomic statistics on European countries will be published today.
Trading recommendations
Support levels: 1.1704, 1.1620
Resistance levels: 1.1759, 1.1799, 1.1817, 1.1854, 1.1894, 1.1934, 1.1969
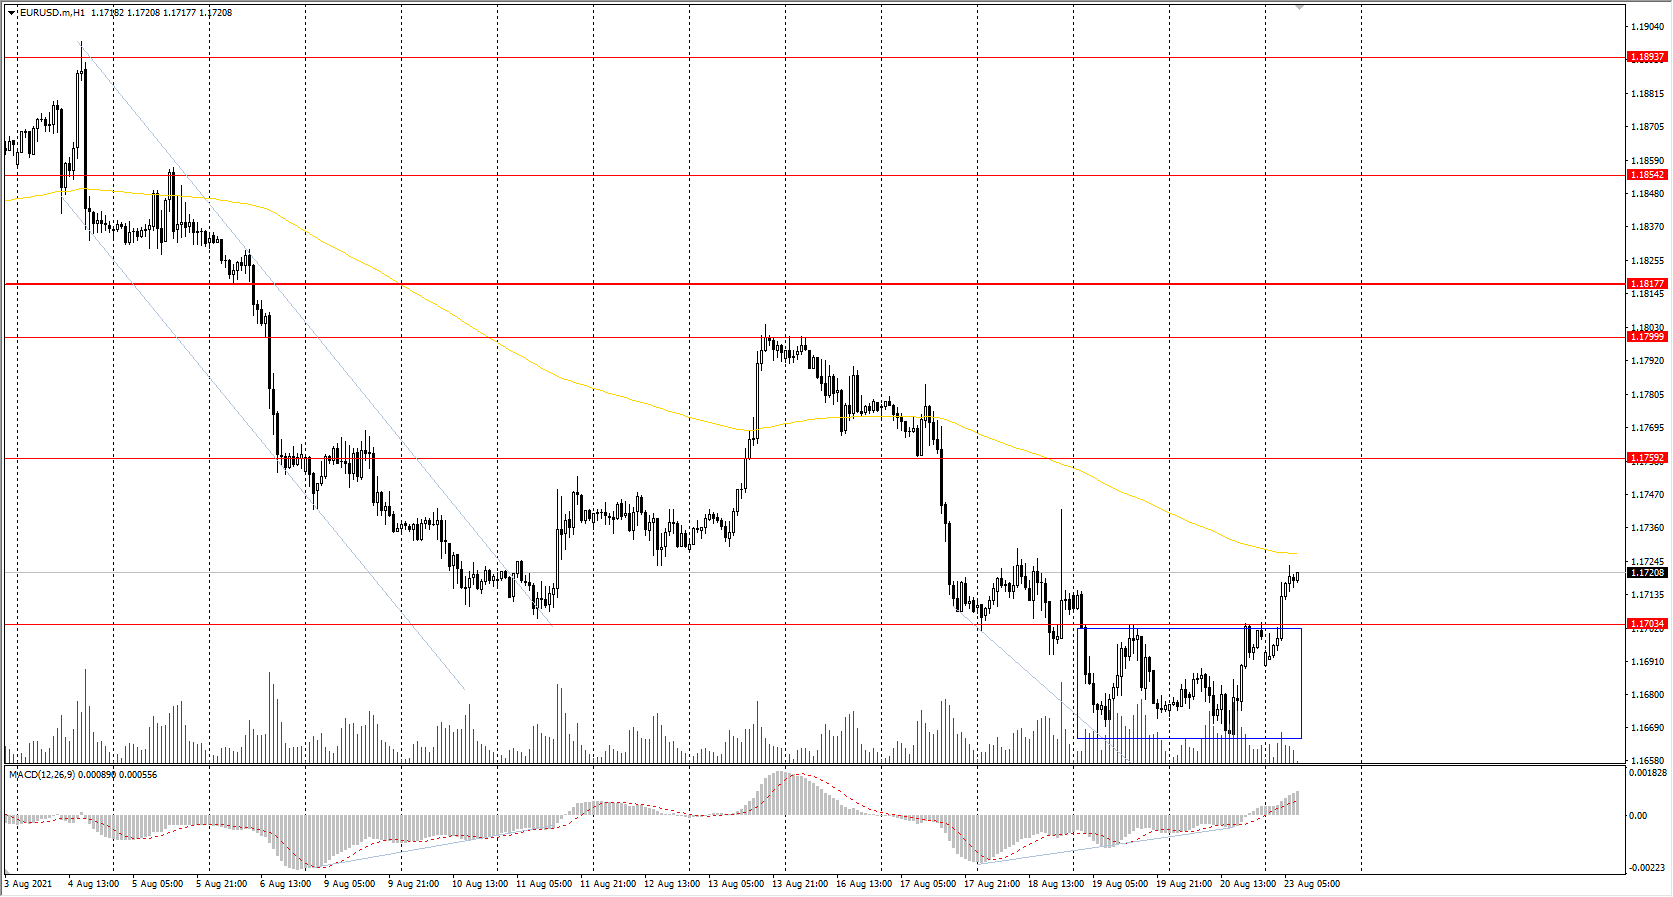
From a technical point of view, the general trend in the EUR/USD currency pair is bearish. The price has consolidated above the support level and formed a false breakdown zone below. Taking into account the divergence on the MACD indicator on the higher timeframes, the buyers' pressure is higher now. Under such market conditions, it is best to look for sell trades from the resistance levels, where sellers showed the initiative. Buy trades can only be considered intraday from the support levels where the buyers have shown the initiative.
Alternative scenario: if the price breaks through the 1.1817 resistance level and fixes above, the mid-term uptrend will likely resume.
News feed for 2021.08.23:
- France Manufacturing PMI (m/m) at 10:15 (GMT+3);
- Germany Manufacturing PMI (m/m) at 10:30 (GMT+3);
- Eurozone Manufacturing PMI (m/m) at 11:00 (GMT+3);
- Eurozone Services PMI (m/m) at 11:00 (GMT+3);
- US Manufacturing PMI (m/m) at 16:45 (GMT+3);
- US Services PMI (m/m) at 16:45 (GMT+3);
- US Existing Home Sales (m/m) at 17:00 (GMT+3).
The GBP/USD currency pair
Technical indicators of the currency pair:
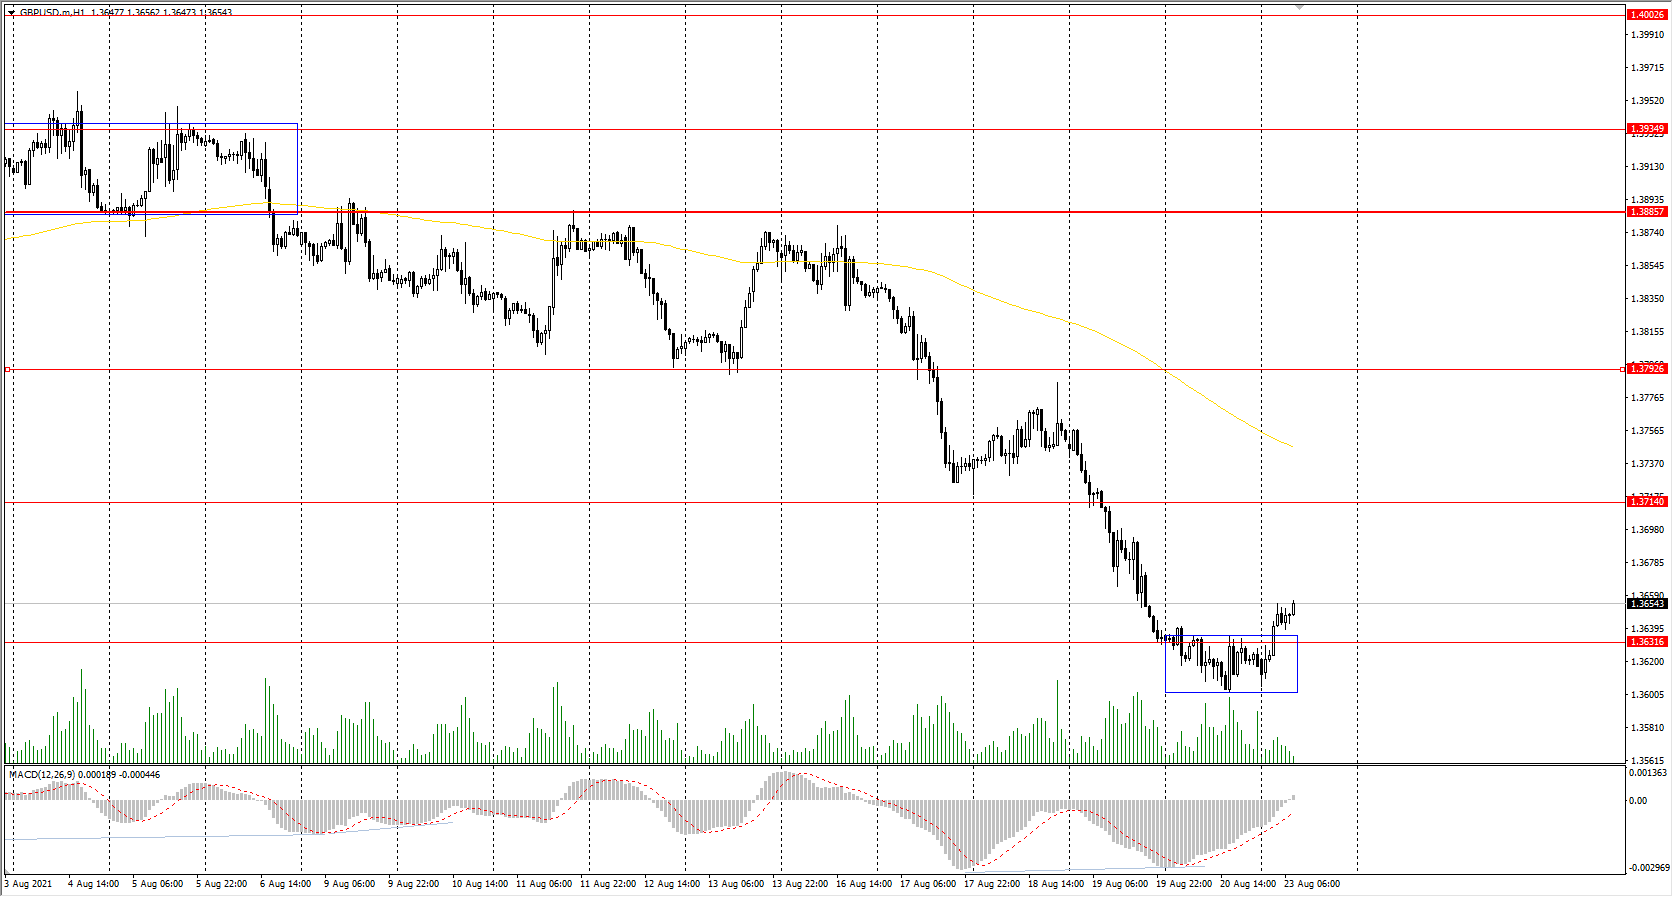
Prev Open: 1.3636
Prev Close: 1.3617
% chg. over the last day: -0.14%
UK retail sales fell by 2.5% in July compared to the previous month, which caused short-term sales in the GBP/USD currency pair. On the other hand, the UK government borrowing almost halved to 10.4 billion pounds in July compared to the same month a year ago. Given a temporary increase in oil prices and a decline in the dollar index, it boosted the British currency at the opening of trading on Monday.
Trading recommendations
Support levels: 1.3632, 1.3614, 1.3525
Resistance levels: 1.3714, 1.3793, 1.3772, 1.3886, 1.3935, 1.4002
On the hourly time frame, the GBP/USD trend is bearish. The price has consolidated above the support level and formed a false breakdown zone below. The MACD indicator shows a divergence. Under such market conditions, it is better to look for sell trades from the resistance levels. But the price is now strongly deviated from the moving average, and given the presence of support and the divergence, there is a high probability of a bounce upward.
Alternative scenario: if the price breaks out through the 1.3885 resistance level and consolidates above, the bullish scenario will likely resume.
News feed for 2021.08.23:
- UK Manufacturing PMI (m/m) at 11:30 (GMT+3);
- UK Services PMI (m/m) at 11:30 (GMT+3).
The USD/JPY currency pair
Technical indicators of the currency pair:
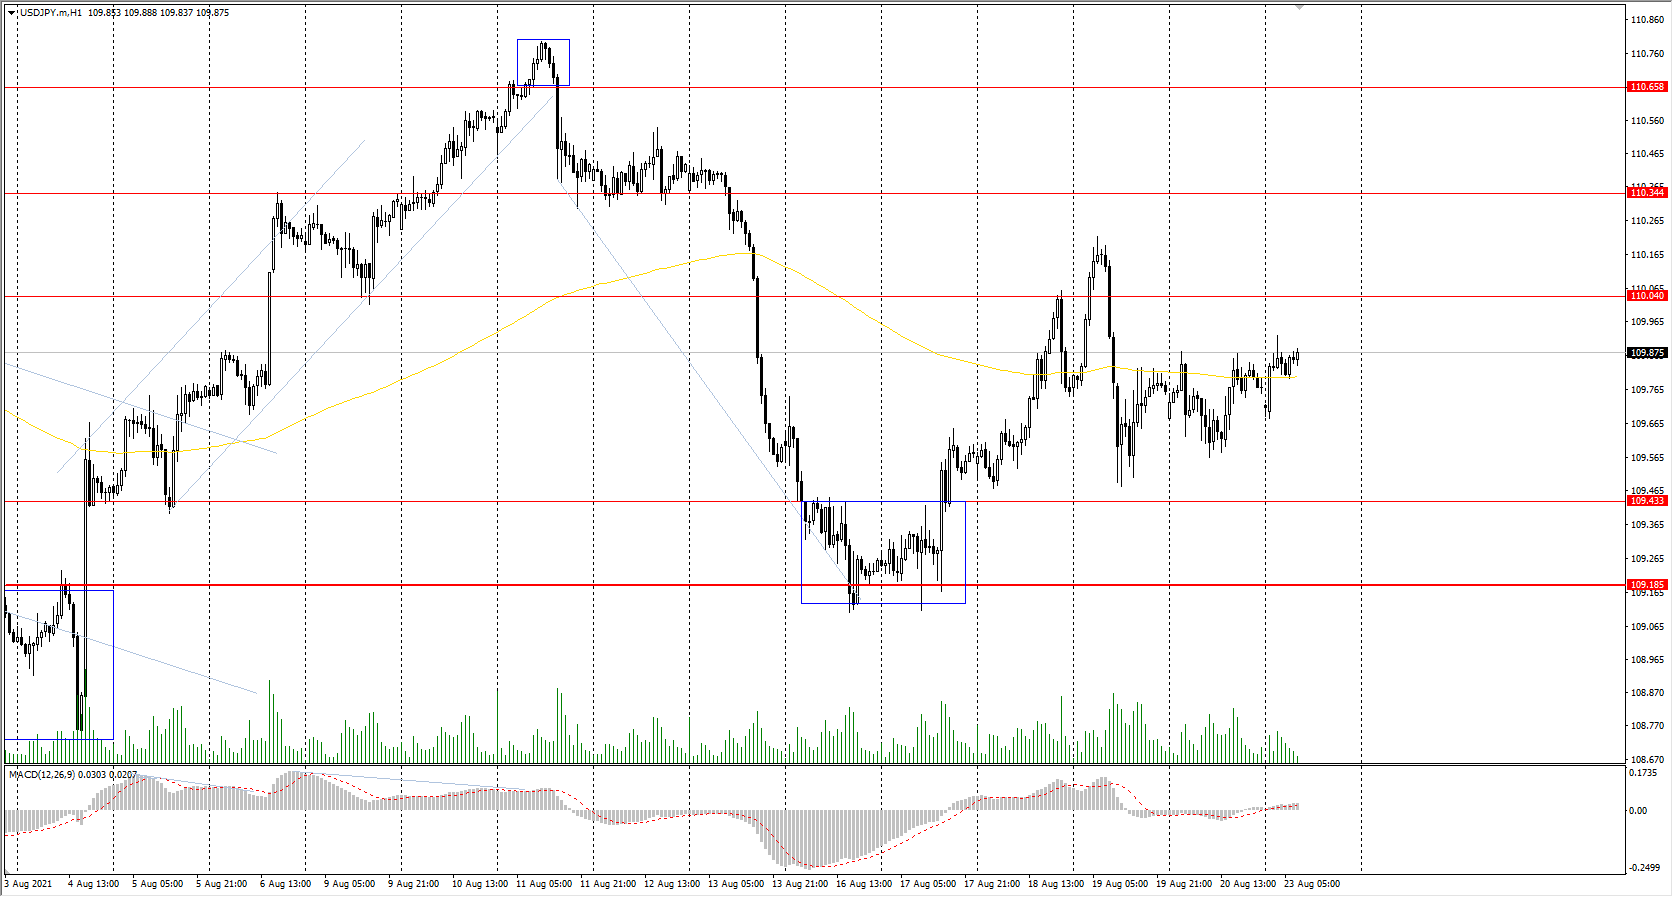
Prev Open: 109.68
Prev Close: 109.77
% chg. over the last day: +0.08%
Growth in manufacturing activity in Japan has slowed, while the services sector has seen its fastest contraction since last May. Such negative statistics are related to the consequences of introducing a state of emergency in the country's prefectures to suppress the Delta strain. Japan's economic indicators for the third quarter will be weak.
Trading recommendations
Support levels: 109.43, 109.19, 108.65
Resistance levels: 110.04, 110.34, 110.66, 110.95, 111.48
The main trend on the USD/JPY currency pair is bullish. The fall of the dollar index compensated for the negative impact of the news on the Japanese Yen. As a result, the USD/JPY currency pair is trading flat. The MACD indicator has become inactive. Under such market conditions, it is best for traders to look for buy trades from the support level, where the buyers have shown initiative. Sell positions should be considered only on lower timeframes from the resistance levels and only with short targets.
Alternative scenario: if the price falls below 109.18, the uptrend is likely to be broken.
News feed for 2021.08.23:
- Japan Manufacturing PMI (m/m) at 03:30 (GMT+3).
The USD/CAD currency pair
Technical indicators of the currency pair:
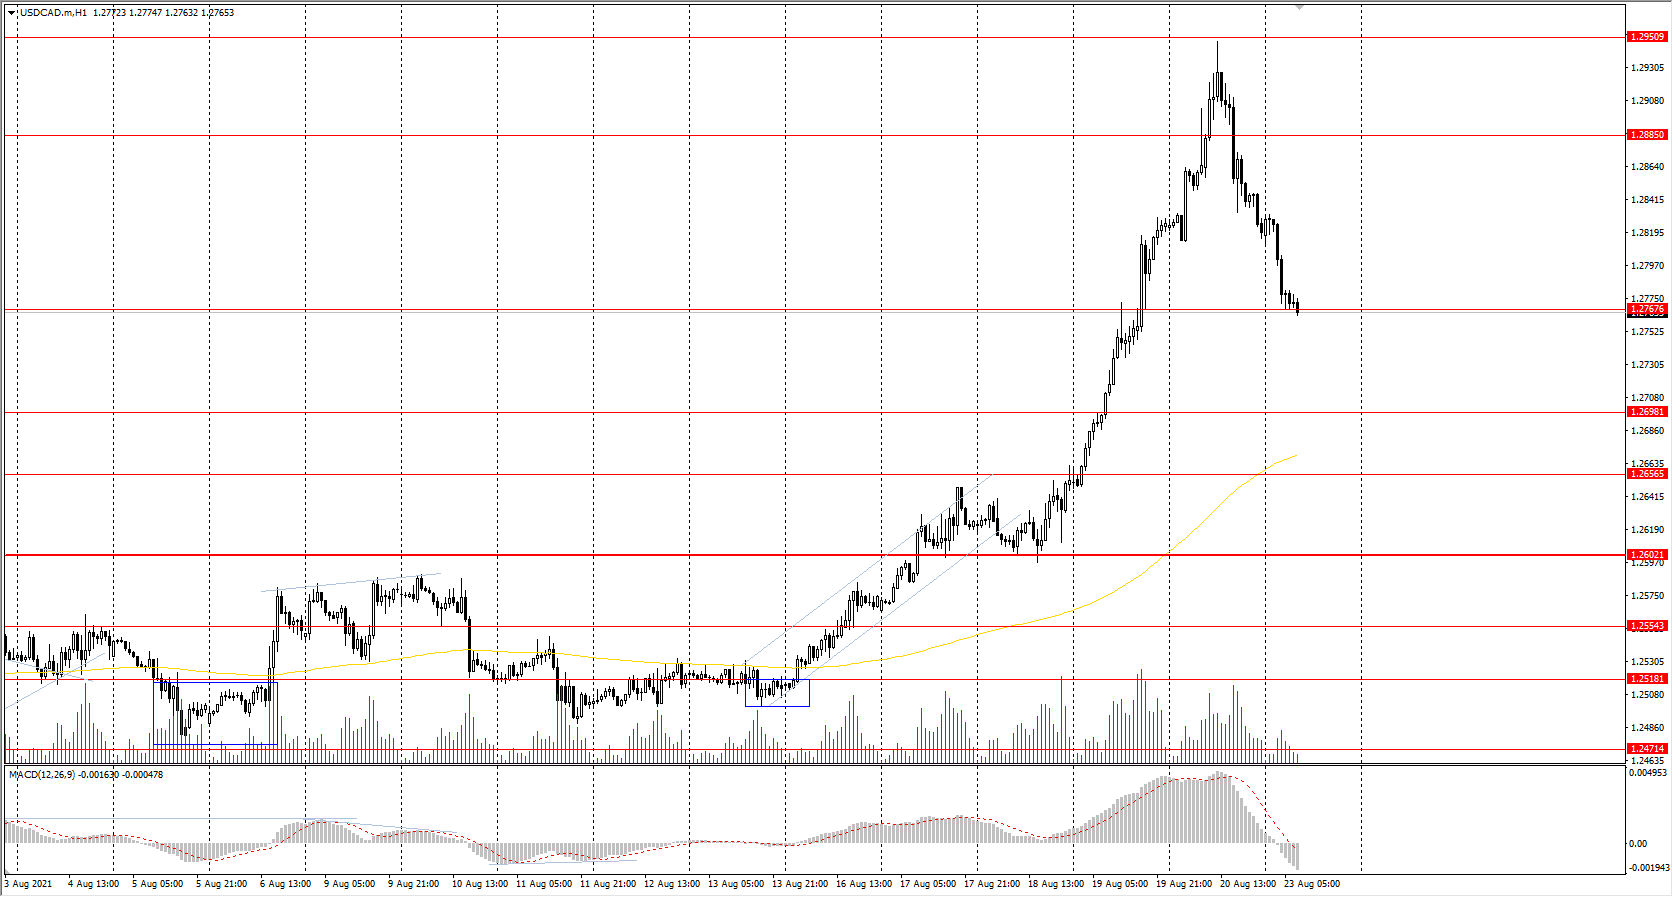
Prev Open: 1.2823
Prev Close: 1.2820
% chg. over the last day: -0.02%
The USD/CAD currency pair is highly dependent on the dynamics of the dollar index and oil prices. The dollar index started to correct while the oil prices slightly increased, which caused the strengthening of the Canadian dollar and a decrease in the USD/CAD quotes.
Trading recommendations
Support levels: 1.2767, 1.2698, 1.2656
Resistance levels: 1.2885, 1.2951
In terms of technical analysis, the USD/CAD trend is bullish. But now, the price has started a corrective movement. Buy positions should be considered from the support levels after the buyers’ initiative. Sell positions should be considered only from the resistance levels and only with short targets, as it will be trading against the main trend.
Alternative scenario: if the price breaks through down the 1.2602 support level and fixes below, the uptrend is likely to be broken.
Jackson Hole Symposium Shifts To An Online Format, Dollar Index Bounces From 9-Month High
Major US stock indices closed Friday in green territory. The S&P 500 index increased by 0.8%, the Dow Jones index increased by 0.65%, and the Nasdaq added 1.2%. NVIDIA, MSFT, and CSCO stock prices made new all-time highs. But that did little to make up for the week's losses. By the end of the week, the Dow and S&P 500 decreased by 1.1% and 0.6%, respectively, and the Nasdaq technology index fell by 0.7%. The main event of the coming week will be the annual symposium of the world’s central banks’ heads in Jackson Hole, where signals concerning the plans of the Federal Reserve's monetary policy are expected. On the one hand, last week, the FOMC minutes showed that the Fed was not planning to cut the QE program until September 22. On the other hand, hedge funds and well-known private investors are reducing the shares of companies in their portfolios, so the probability that Mr. Powell will announce the start of monetary policy tightening still exists. It also became known that the growing number of COVID-19 cases prompted the Federal Reserve to shift its annual symposium in Jackson Hole to an online format.
US Treasury Secretary Janet Yellen told senior White House advisers that she supports the reappointment of Jerome Powell as chairman of the US Federal Reserve, whose term expires in February. The White House has not yet commented on this issue, but the Biden administration is inclined to nominate another candidate according to preliminary information.
European stock indexes closed in the green zone on Friday. The British FTSE 100 increased by 0.4%, the French CAC 40 gained 0.3%, the German DAX added 0.3%, and the Spanish IBEX 35 added 0.15%. By the end of the week, the FTSE 100 fell by 1.8%, the DAX index decreased by 1.1%, the CAC 40 lost 3.9%, and the IBEX 35 lost 0.9%. Shares of European automakers fell after Volkswagen said it would cut production at its main plant due to a chip shortage. Analysts estimate that the global semiconductor shortage will lead to a 6.3-7.1 million reduction in car output this year, and supply chain disruptions caused by the COVID-19 pandemic will affect the auto industry next year as well.
WTI crude oil prices decreased by 2.55% on Friday, while Brent crude lost 2.15%. By the end of last week, WTI decreased by 8.9%, and Brent decreased by 7.7%. The oil market is still under the pressure of the global spread of Delta and, as a consequence, a decrease in demand for fuel.
The gold situation remains unchanged. As long as the Fed maintains a soft monetary policy, quotes of precious metals will rise. But any hints on the reduction of the QE program will cause a sharp fall in these instruments. A lot will depend on the economic symposium results in Jackson Hole later this week.
The shares of Chinese IT giants are going down as China has passed a new data privacy law that is considered one of the strictest in the world in terms of requirements for companies that collect user data. Another reason is the ongoing trade war between the US and China. Container prices between the US and China have skyrocketed, which will undoubtedly be reflected in higher prices for goods from China. At the same time, the Chinese authorities were able to contain the wave of the Delta strain: no new cases of infection were detected in the country on August 23. As a result, Asian stock indexes slightly increased at the opening on Monday. However, the situation with the epidemic in other Asian countries is only getting worse.
Main market quotes:
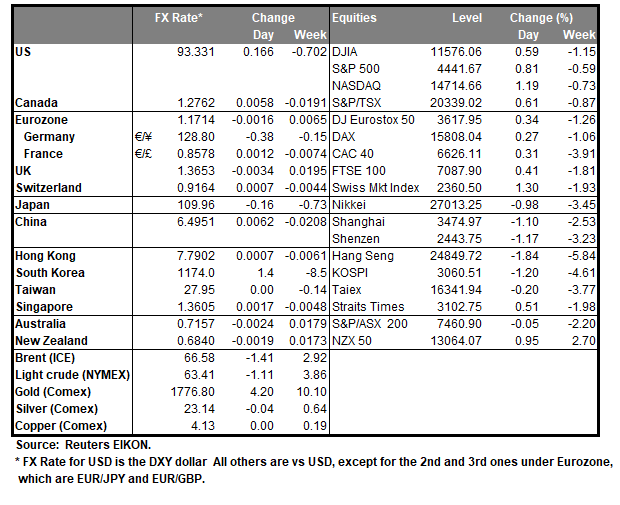
- S&P 500 (F) 4,441.67 +35.87 (+0.81%)
- Dow Jones 35,120.08 +225.96 (+0.65%)
- DAX 15,808.04 +42.23 (+0.27%)
- FTSE 100 7,087.90 +29.04 (+0.41%)
- USD Index 93.46 -0.11 (-0.12%)
Important events for today:
- Australia Manufacturing PMI (m/m) at 02:00 (GMT+3);
- Japan Manufacturing PMI (m/m) at 03:30 (GMT+3);
- Singapore Consumer Price Index (m/m) at 08:00 (GMT+3);
- France Manufacturing PMI (m/m) at 10:15 (GMT+3);
- Germany Manufacturing PMI (m/m) at 10:30 (GMT+3);
- Eurozone Manufacturing PMI (m/m) at 11:00 (GMT+3);
- Eurozone Services PMI (m/m) at 11:00 (GMT+3);
- UK Manufacturing PMI (m/m) at 11:30 (GMT+3);
- UK Services PMI (m/m) at 11:30 (GMT+3);
- US Manufacturing PMI (m/m) at 16:45 (GMT+3);
- US Services PMI (m/m) at 16:45 (GMT+3);
- US Existing Home Sales (m/m) at 17:00 (GMT+3).
XAUUSD Is Possibly Bullish
Technical analysis
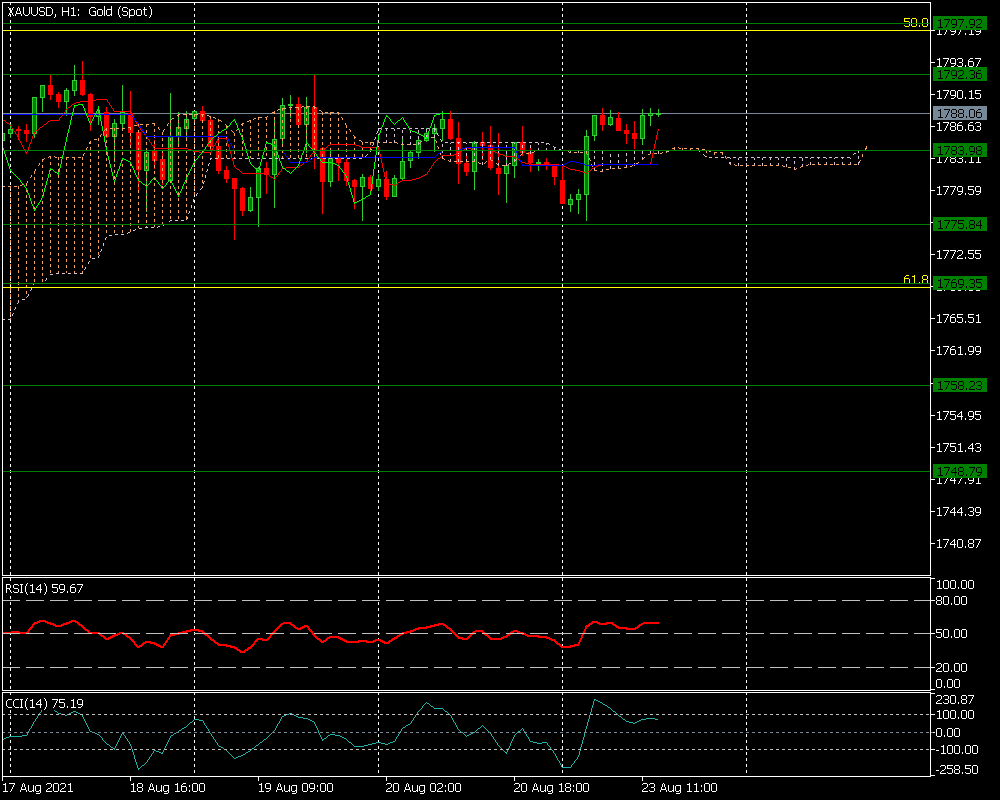
The Ichimoku indicator gives a possible bullish signal
The RSI is above the line 50, indicating that an uptrend may prevail
The CCI suggests a possible downwards correction.
What the possible outcomes are
On Monday, the safe-haven U.S. dollar retreated from more than nine-month highs against major peers as a bounce in Asian stocks lifted sentiment, despite the continued spread of the Delta coronavirus variant.
In our most likely scenario, XAUUSD may rise towards the first resistance level of 1,792.
If the price passes the initial resistance level, it could test the next higher at 1,797.
Contrarily, the pair may decline towards the first support level of 1,783.
If the pair falls below the first support level, we can expect a continued downtrend towards 1,775.
Key levels
Support 1,775 1,783
Resistance 1,792 1,797
Jackson Hole Symposium Preview: Affirming Likelihood of Taper Announcement in November while Striking Balance between Strong Data and Pandemic...
Following the FOMC minutes, the attention turns to the Jackson Hole symposium later this week. We expect that the Fed would make formal announcement of QE tapering at the November meeting. With a tapering size of US15B at each meeting, the entire QE program would be complete by September 2022. As the big picture of the tapering path has been depicted in the minutes, Chair Powell’s speech at the upcoming symposium will likely focus on the case for the tapering and the associated risks.
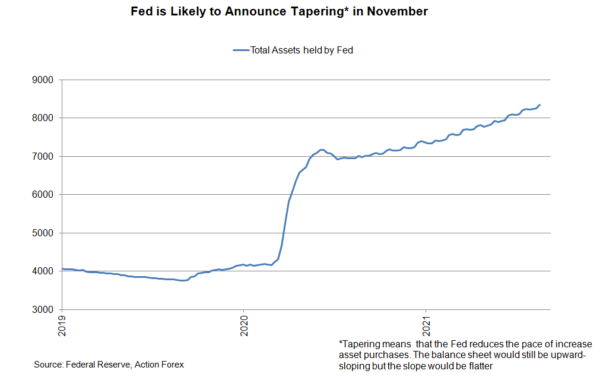
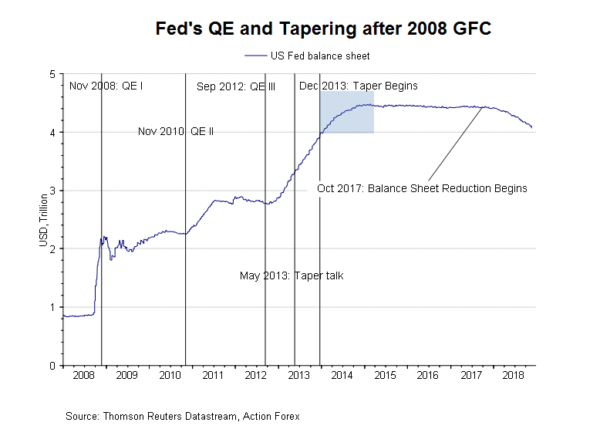 Released last week, the minutes for the July meeting revealed that “most” participants judged that it could be appropriate to start reducing the pace of asset purchases “this year” if the economy evolves in line with their expectations, while “several” noted that a greater-than-expected impact from new virus strains could cause them to rethink the asset purchase timeline. Meanwhile, “several” suggested that an earlier start to tapering could be accompanied by a slower pace of tapering. These comments have raised the odds for an announcement of tapering in November. Another uncertainty that appears to have been resolved was the pace of MBS tapering. Some officials previously expressed concerns about buying MBS securities when the housing market is strong. This had led to speculations that the central bank would accelerate the tapering of MBS (i.e.: the Fed to taper Treasury and MBS securities in equal amounts), allowing MBS purchases to end sooner than Treasury purchases. The minutes, however, suggest “most” participants prefer to taper Treasury and MBS purchases proportionally, so that purchases would end at the same time. Only “several” participants favored reducing MBS purchases more quickly. We now expect that Treasury and MBS purchases would be tapered by US$10B and US$5B, respectively, at each meeting, bringing the entire QE program to an end in September 2022.
Since the announcement to taper would likely be made in November, we do not expect Powell to send much hint about Fed’s move in the September FOMC meeting. This would be significantly different from the Jackson Hole symposium in 2013, at which the then-Chair Ben Bernanke strongly suggested that a September taper is more likely than not.
Powell’s focus of the symposium would be economic developments and the cases for tapering. The strong employment data was not due before the July meeting. As noted in the minutes, “most” participants judged that “substantial further progress” toward the maximum-employment goal had not yet been met, although “most” believed that this standard would be met by the end of the year. We expect Powell to shed more light on the progress of the employment goal.
Meanwhile, the minutes also revealed that “several participants indicated that they would adjust their views on the appropriate path of asset purchases if the economic effects of new strains of the virus turned out to be notably worse than currently anticipated". It would not be surprising if the Chair cautions over the recent resurgence of the pandemic.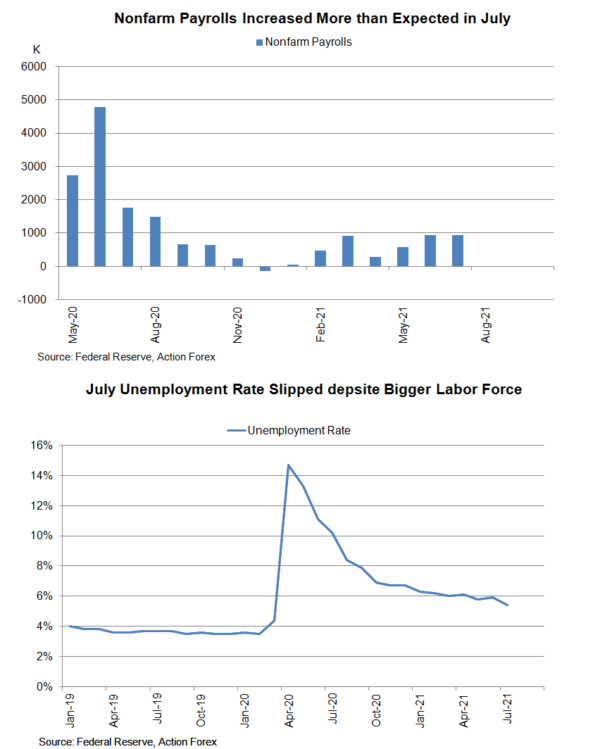
On inflation, Powell would reaffirm that the sharp rise in the general price level is transitory. He should also reiterate that the stance that the Fed would adjust the stance of policy if there are signs that “longer term inflation expectations were moving materially and persistently beyond levels” consistent with its goal.
Key US data this week include personal income and consumption report for July (due Friday). The report will include the latest core PCE inflation data, the Fed's preferred inflation gauge. These data would be released ahead of Powell's speech in Jackson Hole.
Equities Perk Up But Delta Casts Shadow Over Jackson Hole
- Trading gets off to a somewhat more positive start as stocks and commodities rise, dollar slips
- But Delta surge forces Jackson Hole to go virtual again, taper clues in doubt
- Flash PMIs in focus amid recovery fears as Delta variant rages on
 Panic subsides but could be the Fed’s turn to get jittery
After a tumultuous week, the market mood brightened somewhat on Monday after stocks on Wall Street extended their rebound on Friday. Bargain hunting appears to be reviving equity markets even though concerns about the economic damage from the Delta variant have not really gone away, proving that “buy the dip” mentality is far from being dead as markets remain awash with liquidity.
Dip buyers got some encouragement on Friday from hints of a dovish tilt by one of the Fed’s staunchest advocates of early tapering. Dallas Fed President Robert Kaplan on Friday told Fox Business Network that he may have to “adjust” his views on tapering if the Delta variant starts to have a more “material impact” on the US economy.
Kaplan is one of a growing number of Fed officials who in recent weeks have voiced support in favour of a taper move in September. But with some signs that Americans are becoming more anxious about the worsening Delta outbreak sweeping the country, some market participants think the Fed might have to tone down its hawkish rhetoric.
The hotly anticipated Jackson Hole symposium has already been forced to switch to a virtual event so it will be hard for the Fed to ignore the latest virus escalation. More importantly, the cancellation of an in-person gathering makes it less likely that policymakers will be able to reach a decision about the timing and pace of tapering as early as this week and this may be contributing to the uptick in risk sentiment.
Wall Street eyes more gains, Asia could be turning a corner
US stock futures were last trading around 0.2% higher following a second day of gains for the S&P 500 and Nasdaq Composite on Friday. European shares were all in positive territory in morning trade, boosted additionally by a solid session in Asia, led by a strong rebound in China and Japan.
The combination of tightening restrictions in the region due to the Delta wave and a crackdown by China on its tech giants had clobbered Asian stock markets in recent weeks, with the instability in Afghanistan adding to the downside risks. But there was some good news on Monday from China when authorities reported no new Covid-19 cases from local transmission for the first time since July, signalling the latest outbreak may be easing.
The encouraging development was in stark contrast to New Zealand where the prime minister just extended the country’s lockdown until Friday. However, investors appear to be focusing on the positives, such as less disruption to global supply chains from Chinese lockdowns and a potentially not-so-hawkish Fed at the Jackson Hole this week, even though there are plenty of dangers still lurking around.
Dollar on the retreat, loonie shines, pound lags
In typical fashion, the US dollar fell back on Monday as some of the risk aversion faded. The Japanese yen and Swiss franc were broadly weaker too. The dollar index is down almost 0.3% today, stepping back from Friday’s 9½-month peak. With the week only just starting, it’s too early to draw any conclusions about the latest dollar rally being over. But if the improvement in sentiment holds up, the only thing that will be able to put the dollar back on the front foot is if the Fed sends clear tapering signals at the Jackson Hole event.
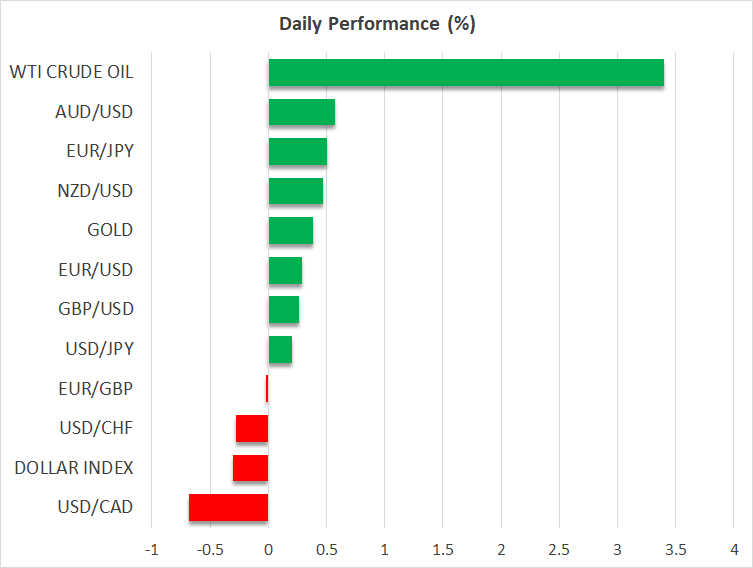
The dollar’s pullback lifted the commodity-linked currencies the most on Monday as the euro and pound lagged somewhat. The Canadian dollar was the biggest winner, jumping about 0.6% to around C$1.2740 to the greenback as oil prices surged by more than 3% along with metal prices such as copper, boosted by China reporting no new virus cases today, which bodes well for demand.
The aussie was the second biggest gainer (0.5%) followed by the kiwi (0.35%). The euro had a more sluggish start but gained some traction after Eurozone flash PMIs in August were more or less in line with expectations, which helped it reclaim the $1.17 level. But the pound looked nowhere near being able to significantly recoup its heavy losses from last week and struggled as it edged up to $1.3650, weighed by an unexpected big drop in services activity in August according to the IHS Markit PMI survey.
The focus will next turn to the US PMIs.
Gold In Confusion Within Tight Range
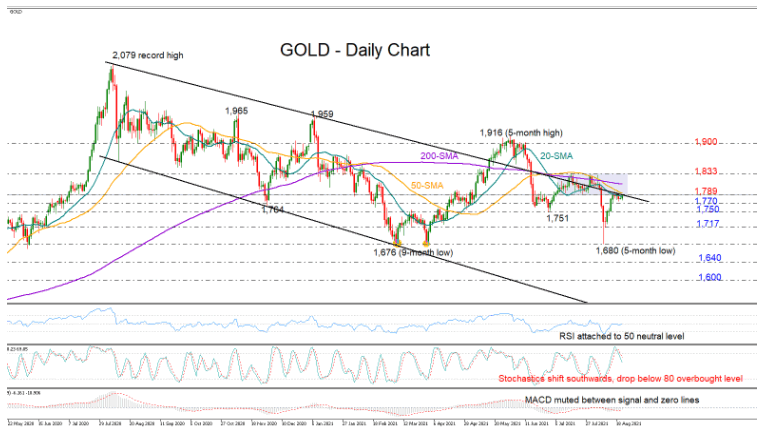
Gold is in a tight range with the 1,780 – 1,770 zone as the quick bounce from the five-month low of 1,680 was not enough to pierce a former support region and the 20- and 50-day simple moving averages (SMAs). Notably, the surface of the descending channel, which lost some credence following May’s breakout, seems to be back into focus, acting as resistance again within the same region.
From a technical perspective, the signals are still confusing, providing little direction about the next move in the price. The RSI remains stuck below its 50 neutral mark, despite its recent fast upside reversal, while the MACD is also muted between its signal and zero lines. Meanwhile, the Stochastics are currently siding with the bears as the indicator is exiting the overbought area.
Should the bulls claim the 1,789 barrier, it would be interesting to see if the price can snap the 200-day SMA and close above the tough 1,833 resistance area. If that’s the case, the yellow metal could pick up steam to rechallenge the 1,900 – 1,916 wall.
Alternatively, if the bears win, driving the price below 1,770, the focus will immediately turn to 1,750, which has been acting both as support and resistance since March. Softly lower, some consolidation could take place around 1,722 before the door opens again for the 1,680 low. A decisive close below the latter stretch towards the 1,640 handle, while the 1,600 psychological level will also be closely watched in the event of an aggressive downfall.
In brief, gold is currently in neutral mode. A break above 1,780 or below 1,770 could navigate the market accordingly.
EUR/USD Analysis: Breaks Pattern
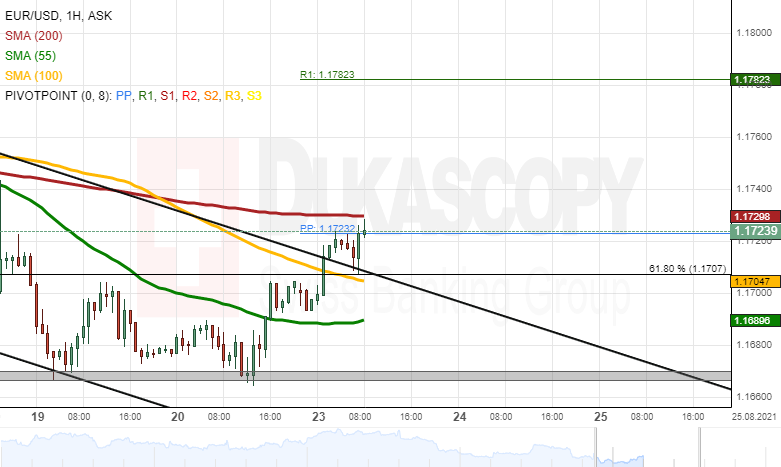
At the start of this week's trading, the EUR/USD currency exchange rate passed the resistance of a channel down pattern. The pattern had guided the rate down since August 13.
During the early hours of Monday's trading, the pair reached and bounced off the resistance of the weekly simple pivot point at 1.1723 and reached the support of a 61.80% Fibonacci retracement level at 1.1707.
In the near term future, the pair could pass the support of the 61.80% Fibonacci retracement level at 1.1707, the 100-hour simple moving average at 1.1705 and the 1.1700 mark. In this case scenario, the EUR/USD could look for support in the 55-hour simple moving average near 1.1690.
On the other hand, a potential recovery would find resistance in the weekly simple pivot point at 1.1723 and the 200-hour simple moving average at 1.1730.
GBP/USD Analysis: Finds Support At 1.3600
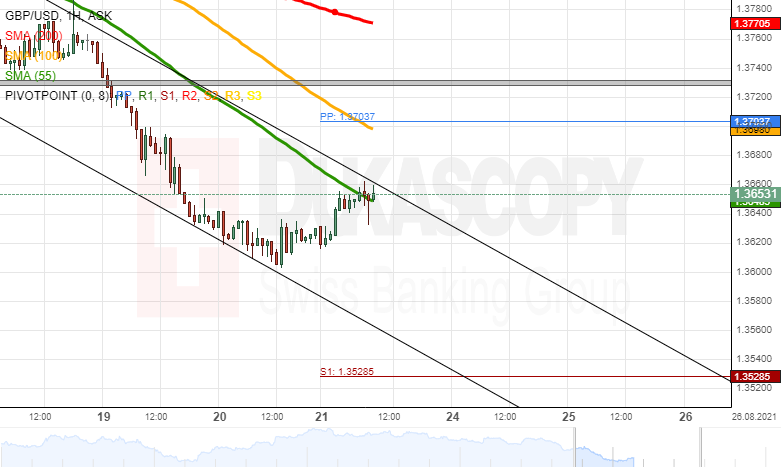
The decline of the GBP/USD recovered after reaching the 1.3600 level. By the middle of Monday's European trading hours, the currency exchange rate had recovered to the 1.3660 level. In addition, analysts have spotted a new channel down pattern on the pair's hourly candle chart.
If the rate passes the resistance of the channel down pattern, the GBP/USD could aim at the resistance of the weekly simple pivot point at 1.3704 and the 100-hour simple moving average near 1.3700.
Meanwhile, a resumed decline in the borders of the descending channel pattern could once again look for support in the 1.3600 mark before reaching for the weekly S1 simple pivot point at 1.3529