Sample Category Title
Fed Kashkari: Ready to start tapering after a few more strong job reports
Minneapolis Fed President Neel Kashkari said in a Bloomberg interview, "if we see a few more jobs reports like the one we just got, then I would feel comfortable saying yeah, we are -- maybe haven't completely filled the hole that we've been in -- but we've made a lot of progress, and now, then will be the time to start tapering our asset purchases."
"I'm not convinced we were actually at maximum employment before the Covid shock hit us. So, that's exactly why I want us to be really humble about declaring, 'This is as good as it can get'," he said.
He added that labor force participation and employment rates have to be "at least back to where they were before" and that's a "reasonable thing for us to try to achieve."
China industrial production, retail sales, investment missed expectations
Industrial production rose 6.4% yoy in July, below expectation of 7.8% yoy. Retail sales rose 8.5% yoy, below expectation of 11.5% yoy. Fixed asset investment grew 10.3% ytd yoy, below expectation of 11.3% ytd yoy.
"Given the combined impact of sporadic local outbreaks of Covid-19 and natural disasters on the economy of some regions, the economic recovery is still unstable and uneven," said NBS. "We should not only look at the growth to analyze the economic situation, but also need to look at the overall picture of employment, prices and residential incomes."
Japan GDP grew 0.3% qoq, 1.3% annualized in Q2
Japan GDP grew 0.3% qoq in Q2, above expectation of 0.2% qoq. The economy was back in growth after -1.0% qoq contraction in Q1. In annualized term, GDP grew 1.3%, above expectation of 0.7%.
Looking at some details, external demand contracted -0.3% qoq, versus expectation of -0.1% qoq. Capital expenditure rose 1.7% qoq, matched expectations. Private consumption grew 0.8% qoq, much better than expectation of -1.0% qoq. Price index dropped -0.7% yoy, worse than expectation of -0.4% yoy.
Eco Data 8/16/21
[php_everywhere instance="1"]
Forex and Cryptocurrencies Forecast
EUR/USD: Focus on Inflation
The forecast given last week has come true 100%. Recall that 70% of experts suggested that EUR/USD will test the late March low at 1.1700 once again. And it did drop to the level of 1.1705 as early as Wednesday. However, the drivers for further strengthening the US currency were not enough, and the pair was moving in reverse, north, for the second half of the week.
It reached weekly highs on Friday, August 13, climbing to the 1.1800 horizon, and completed the five-day period at 1.1795, the best gain in recent months. This happened during the American session due to a sharp drop in the University of Michigan Consumer Confidence Index, the value of which dropped to the December 2011 low: from 80.2 to 70.2 points. This indicator is based on a survey of consumers and measures their confidence in US economic growth. Simply put, it evaluates their willingness to spend money. Other indicators presented by the university also fell short of expectations.
The Federal Reserve has repeatedly stressed that the timing of curtailing the monetary stimulus (QE) program and raising interest rates directly depends on the acceleration of inflation and a full recovery of the US labor market. But it turns out that Americans' desire to shop is on the wane, which does nothing to boost inflation and meet the Fed's goals.
On the back of disappointing data from the University of Michigan, the DXY dollar index dipped to 92.50, and the Dow Jones and S&P500 have once again renewed their highs, reaching 35612.25 and 4467.13, respectively.
Interestingly, US stock indices have been growing recently both when economic releases delight investors and when they upset them. This is apparently due to the pumping of the market with a huge amount of dollars under the QE program. Investors simply have nowhere to put it, especially since the Fed's interest rates are extremely low now. So you have to invest it in stocks.
But the voices of the "hawks" that it is time to end with QE can be heard more and more clearly inside the US Central Bank itself. According to 28 out of 43 Reuters experts, the Fed will announce the start of the program's curtailment in September. More than a third of respondents believe that this will happen in November-December. The decline in asset purchases, according to 60% of the experts surveyed, will start in Q1 2022, almost everyone else believes it will happen even earlier, in Q4 this year.
Starting to wind down fiscal stimulus is extremely likely to lead to outflows from the stock market and strengthen the dollar. But so far, there is no clarity on the timing, and there is no certainty in the opinions of experts. Assessing the prospects of the EUR/USD pair for the near future, 30% vote for its growth and 35% for the fall and for the sideways trend along the horizon of 1.1800.
There is no unity among indicators either. It is clear that after the jump on Friday the 13th, most of them, including graphical analysis, are colored green. Although here, too, 25% of oscillators are already giving signals that the pair is overbought. As for D1, it is simply impossible to give preference to any of the colors: one third of the oscillators are colored green, one third - red, and one third - neutral gray. As for the trend indicators on D1, the majority (65%) indicate the continuation of the medium-term downtrend, and the pair's desire to test the support of 1.1705 once again. If it succeeds, it will encounter a strong support in the 1.1600-1.1610 zone. If the bulls win, then the resistances are located at levels 1.1840, 1.1910 and 1.1975.
Of the events of the coming week, which may affect trends, it is worth noting the release of Eurozone GDP data for Q2, as well as US retail sales and inflation data. These releases will be out on Tuesday August 17. And the next day, August 18, the minutes of the FOMC meeting of the US Fed will be published, from which experts will try to understand whose side, pigeons or hawks, is advantageous now relative to the timing of the QE folding.
GBP/USD: Fog over London
As expected, data released on Thursday August 12 showed strong UK GDP growth in Q2 2021, from minus 1.6% to plus 4.8%. However, this coincided with the forecast completely and therefore did not make a special impression on the market. But the University of Michigan data caused GBP/USD to soar 85 points, from 1.3790 to 1.3875, and end the trading session almost where it started, in 1.3868.
Prior to the release of this data, many experts expected the pair's downtrend which started in late July to continue. Commerzbank specialists called the June 21 low of 1.3786 as initial support, after breaking which the pair will consistently drop to the lows on July 02 (1.3735) and April 12 (1.3669). The target is the July 20 low at 1.3571.
A similar scenario was suggested by the analysts of the Singapore-based OCBC Bank, who named the levels 1.3779 and 1.3732. The economists of the French Societe Generale agreed with this, believing that the combination of a strong dollar and a weak pound would lead the GBP/USD pair to fall below 1.3750.
However, none of that has happened yet. And it is appropriate to cite here the opinion of Credit Suisse experts, according to which the pair has completed the formation of a bullish reversal pattern. But to continue its growth, it needs to rise above 1.3895. Then the next targets will be closing above 55-DMA at 1.3920, and then zone 1.3978-1.4010.
As for the readings of the indicators, they are similar to the readings of their "colleagues" for the previous pair, EUR/USD. Although there is some advantage of greens on H4, it is not possible to be guided by their signals now.
Among the important macro statistics for the pound next week is the release of UK labour market data on Tuesday August 17 and on the consumer market on Wednesday August 18. However, even if both turn out to be positive, it is still not worth waiting for clear signals from the Bank of England about the timing of its QE curtailment.
USD/JPY: South Following Treasury Yields
Last week we named our forecast for this pair "North Following Treasury Yields". In the current one, only one word has been replaced, "North" for "South".
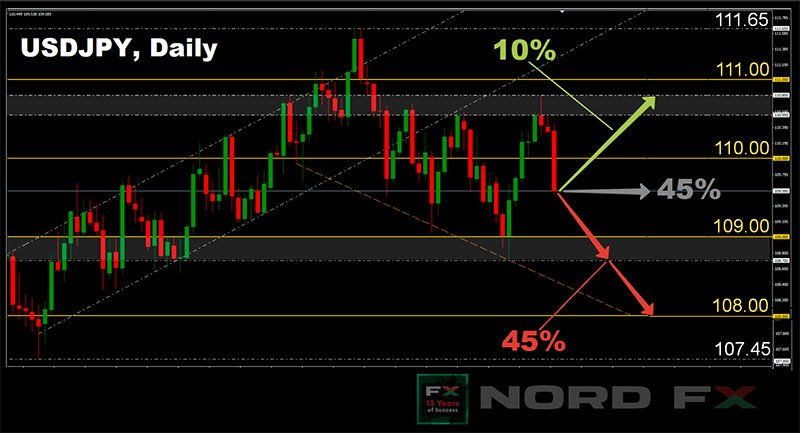
The previous title has fully justified itself. As anticipated, USD/JPY grew in the first half of the week, reaching the height of 110.80 on August 11. However, then "something went wrong", the pair turned around and flew down, putting the last chord at 109.55. The first reason is repeated many times above. An additional advantage to the Japanese safe-haven currency was given by the yield on 10-year US Treasury bonds. This indicator dropped sharply by 4.5%, reaching a weekly low of 1.3%.
The USD/JPY pair finished five days substantially below the key 110.00 horizon, and experts say this does not bode well for the dollar. (Of course it's about the near term). Thus, 45% of analysts vote for the continuation of the downtrend, another 45% prefer a sideways trend, and only 10% believe that the bulls will be able to turn the pair northward again.
As for the trend indicators, there is also a clear advantage on the side of the reds: 100% side with them on H4, 75% on D1. There is not a single one among the oscillators on H4 that would point to the north. True, 25% have taken a neutral position, and out of 75% of those looking down, almost half are in the oversold zone. On D1, 65% point south, 20% point west, and 15% point north.
Support levels are 109.35, 109.05 and 108.70, the target of the bears is to retest the April low of 107.45. The nearest resistance levels are the zone 110.00, 110.55, 110.80, 111.00 and 111.65. The ultimate goal of the bulls is still the same: to get to the cherished height of 112.00.
Among the week's events would be the release of preliminary Japanese GDP figures for Q2 2021 (forecast: growth from minus 1.0% to plus 0.2%). However, as the practice shows, this will have little effect on the pair's behavior. The main focus should be on US macro statistics. And it could quite break the current trend and re-send the pair north.
CRYPTOCURRENCIES: Crypto Spring in Full Swing
"Investors hope that the crypto freeze has passed, and instead of the crypto winter, the crypto spring came straight away," - this is how we described the situation in this market in the previous review. The past week did not spoil the spring mood. Bitcoin has heaped by about 12% in seven days and is approaching $47,800 at the time of writing. The total capitalization of the crypto market increased over the same period from $1.67 trillion to $1.957 trillion, and the day it will once again cross the bar of $2.0 tn seems not far off. As for the Crypto Fear & Greed Index, it finally moved from the central zone to the green part of the scale, rising from 52 points to 70. At the same time, it is still far away to a state of severe overbought, which foreshadow a strong correction. And it gives investors hope that the day will come when the BTC/USD pair updates its historic high.
In addition to optimists, of course there are enough pessimists in the market. Including those among recognized professionals. For example, Bridgewater Associates billionaire founder Ray Dalio does not rule out bitcoin growth, but still prefers gold. Dalio has stated that he holds a "very small volume" of bitcoin. "If you put a gun to my head and let me choose only one of the two, I'll choose gold," he said.
Reputable bankers like Goldman Sachs CEO David Solomon and fellow JPMorgan Chase Jamie Dimon continue to criticize cryptocurrency. But at the same time, they and many other banks continue to actively implement services related to digital assets. And analysts at JPMorgan predicted BTC's rise to $146,000 earlier in the year.
Disputes about where it is better to invest money, in precious metal or in cryptocurrencies, do not subside. At the same time, simple calculations show the obvious superiority of bitcoin. The price of gold has fallen by about 5.5% over the past 10 years. As for the core cryptocurrency, it grew 571,000% during the same time. That is, having invested only two dollars in bitcoin then, you would be a millionaire by now. In the last five years alone, gold has fallen in price against bitcoin by 25 times.
The numbers speak for themselves. But the reliability of investments cannot be forgotten. Between 2010 and 2015, the price of gold experienced a maximum drop, losing approximately 40% in five years. But if you look at the April-May chart this year, you'll see that bitcoin lost the same 40% in just four weeks!
Investing in cryptocurrencies requires significantly stronger nerves and a safety margin. During the rapid collapse of the crypto market, some get rid of their coins, succumbing to panic. Others, on the other hand, see such corrections as an excellent buying opportunity.
According to Tom Lee, head of research firm Fundstrat, the "golden rule" for crypto investors is to buy bitcoin every time the quotes cross the 200-day moving average (MA 200) from the bottom up. Starting in 2017, in three out of five cases, the closing of the daily candle above this line was the beginning of a gradual increase in trading volumes and the development of long-term upward trends that lasted from 4 months to a year. Two failures, according to Tom Lee, do not in any way cancel his "golden rule", since in these cases the BTC rate managed to rise enough for traders to protect their positions from any loss.
Tom Lee also reiterated his prediction that he sees bitcoin in the region of $100,000-120,000 in 2022. Bloomberg Intelligence senior strategist Mike McGlone pointed to the same level of $100,000 in his latest report. "Bitcoin seems to have found support around the $30,000 mark, just as it did at $4,000 in early 2019. We see parallels with those events and, apparently, bitcoin may well reach $100,000," he wrote.
More modest predictions were given by three other crypto experts. Well-known cryptocurrency analyst Willie Wu believes that, based on fundamentals, the fair price for bitcoin is $53,200. However, he warned that fundamental factors do not allow forecasting for a short period, but with sufficient time, they will fully justify themselves.
Another analyst, Will Clemente, agreed with Wu's opinion and noted that, based on the bitcoin liquidity data from the Glassnode analytical platform, he predicted its growth to about $53,000 back on July 31. The well-known crypto strategist with the nickname Crypto Dog confirmed these predictions. In his opinion, "bitcoin will get to $50,000 very soon."
CFTC Commitments of Traders – Traders Bet Aussie to Go Lower as Resurgence of Pandemic Triggers Lockdown Extension
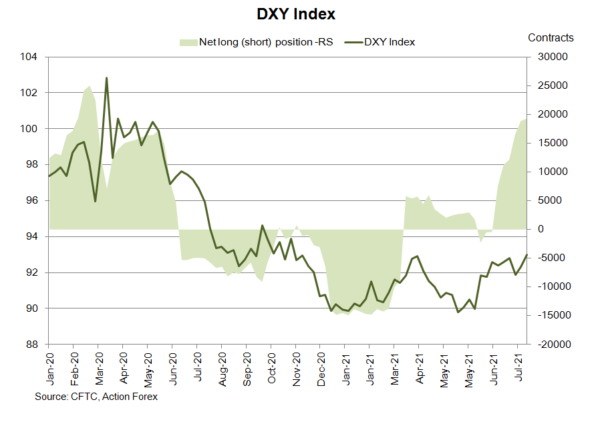
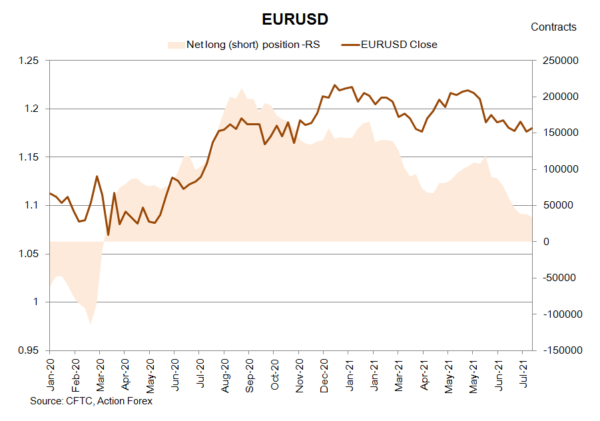
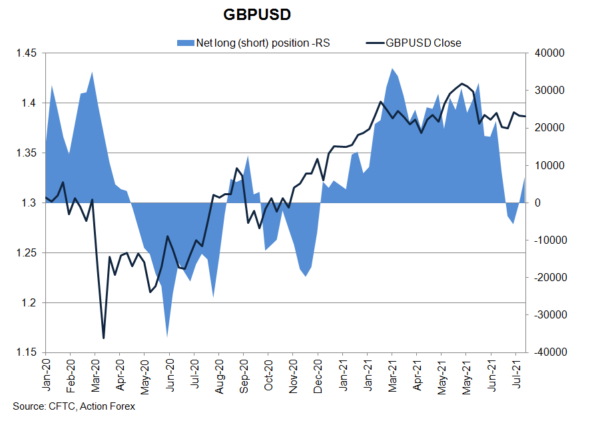
As suggested in the CFTC Commitments of Traders report in the week ended August 10, NET SHORT of USD index futures added +445 contracts to 19 326. Speculative long positions rose +2 514 contracts while shorts increased +2 069 contracts. Concerning European currencies, NET LENGTH in EUR futures fell -4 150 contracts to 33 857. GBP futures returned to NET LENGTH of 7 070 contracts.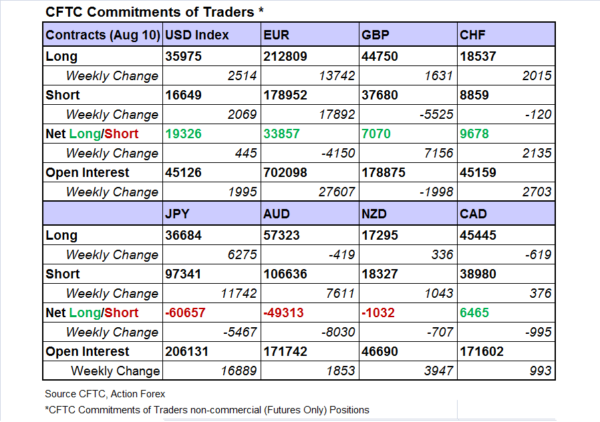
 On safe-haven currencies, NET LENGTH of CHF futures gained +2 135 contracts to 9 678 while NET SHORT of JPY futures rose +5 467 contracts to 60 657. Concerning commodity currencies, NET SHORT of AUD futures soared +8 030 contracts to 49 313 while that of NZD futures added +707 contracts to 1 032 during the week. NET LENGTH of CAD futures shrank -995 contracts to 6 465 during the week.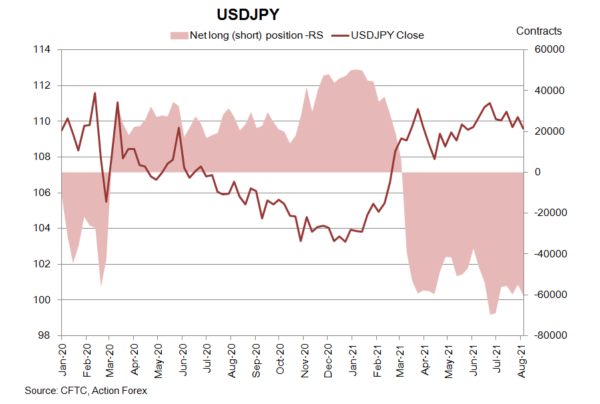
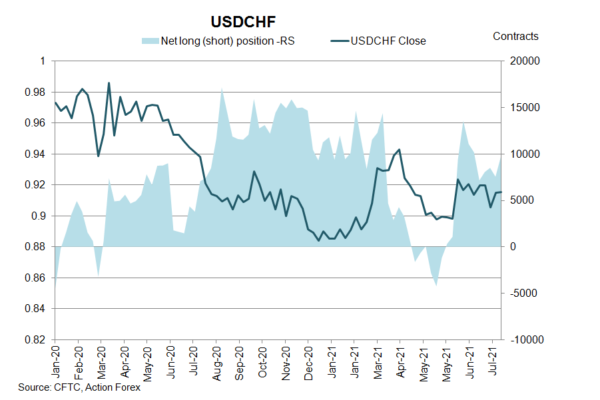
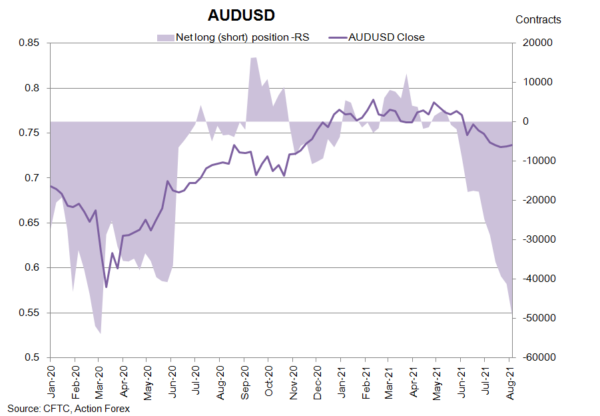
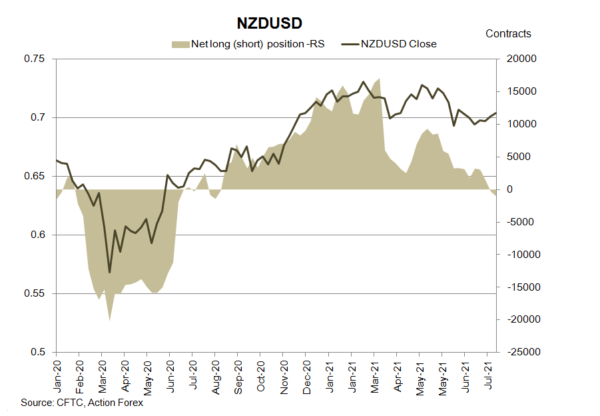
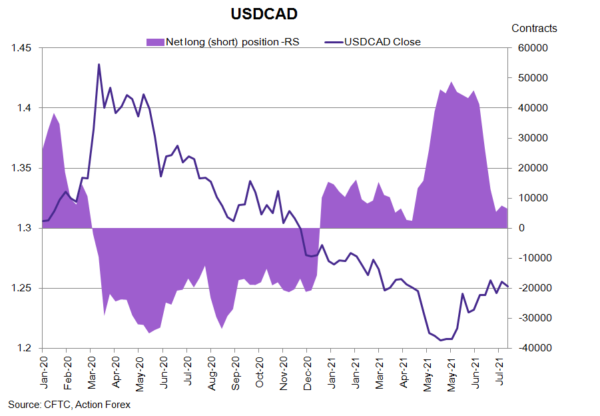
CFTC Commitments of Traders – Bets on Higher Crude Oil Price Shrank as Widespread Coronavirus could Again Hurt Chinese...
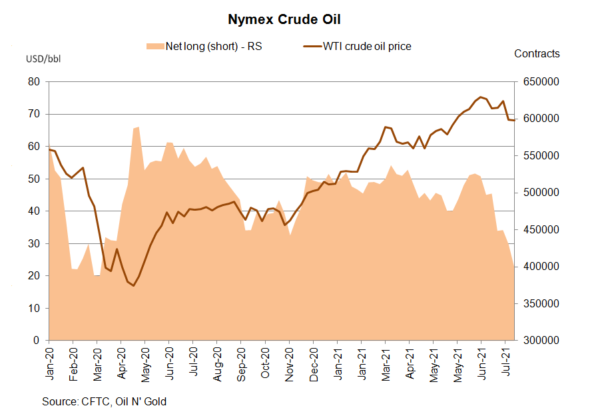
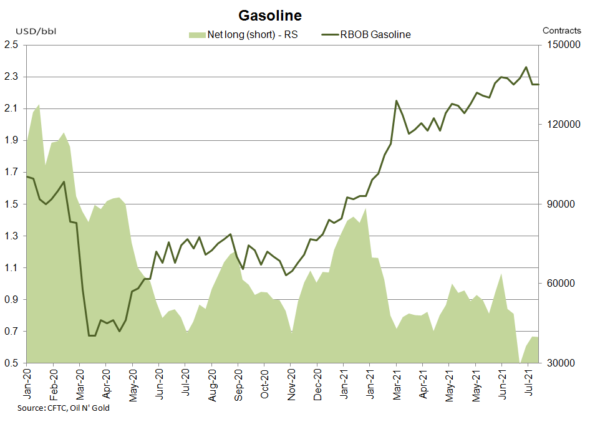
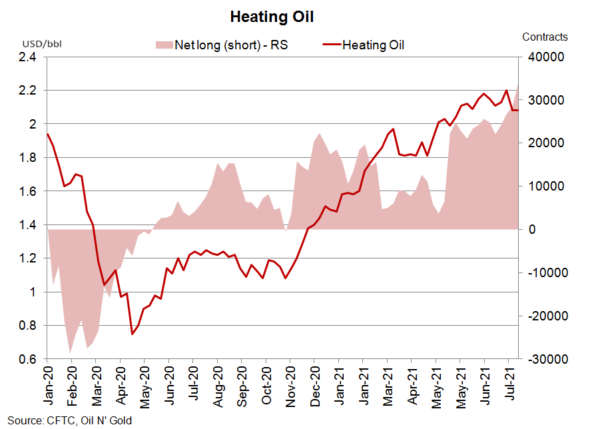
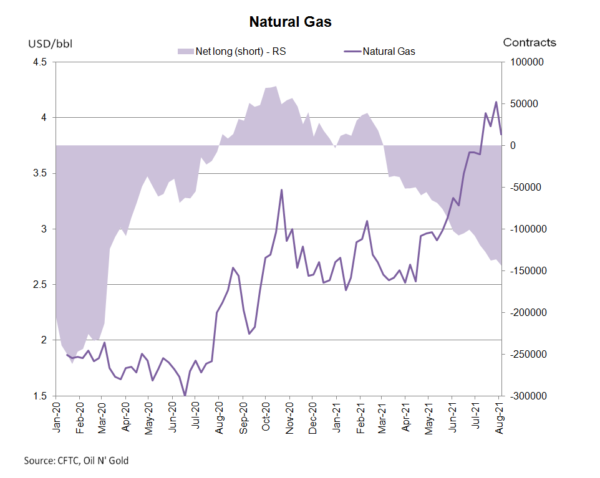
According to the CFTC Commitments of Traders report for the week ended August 10. NET LENGTH for crude oil futures slumped -30 114 contracts to 400 413 for the week. Speculative long position sank -27 408 contracts, while shorts increased +2 706 contracts. As we had anticipated, the sharp decline in net length was driven by concerns over China's demand outlook. The resurgence of the pandemic has spread to many parts of the world's largest oil consumer. For refined oil products, NET LENGTH for heating oil rose +5 375 contracts to 33 915, while that for gasoline dropped -167 contracts to 39 838. NET SHORT of natural gas futures soared +7 675 contracts to 143 920 during the week.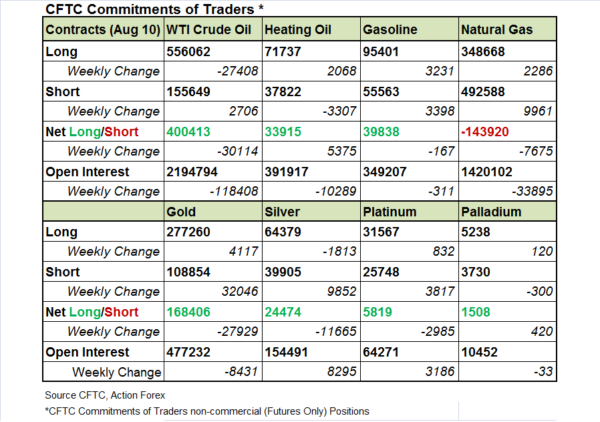
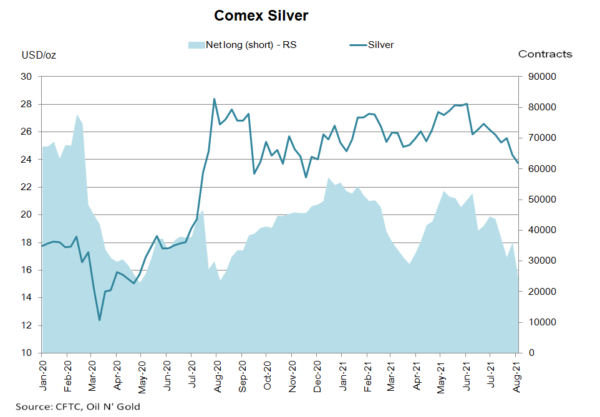
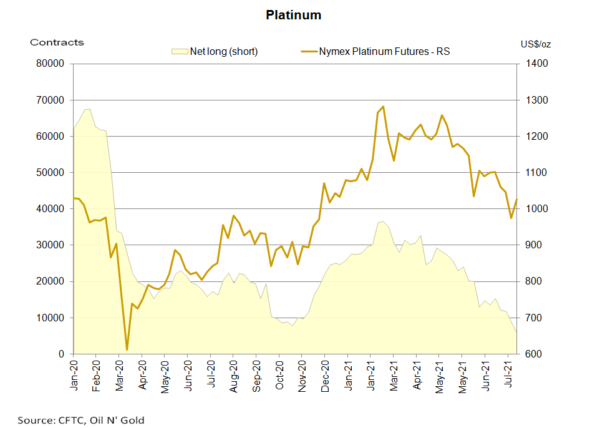
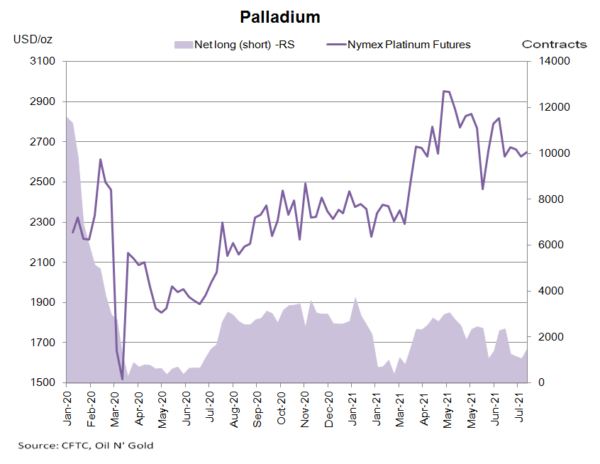
 Gold futures’ NET LENGTH plunged -27 929 contracts to 168 406 while silver futures’ NET LENGTH fell -11 665 contracts to 24 474. Net lengths in both metals should likely rebound amidst price recovery. For PGMs, NET LENGTH of Nymex platinum futures dropped -2 985 contracts to 5 819 while that for palladium added +420 contracts to 1 508.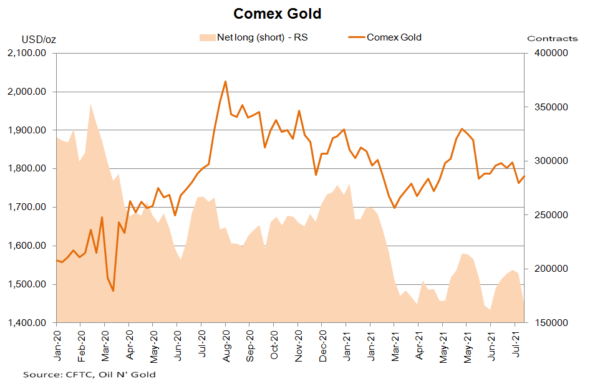
EUR/USD Weekly Outlook
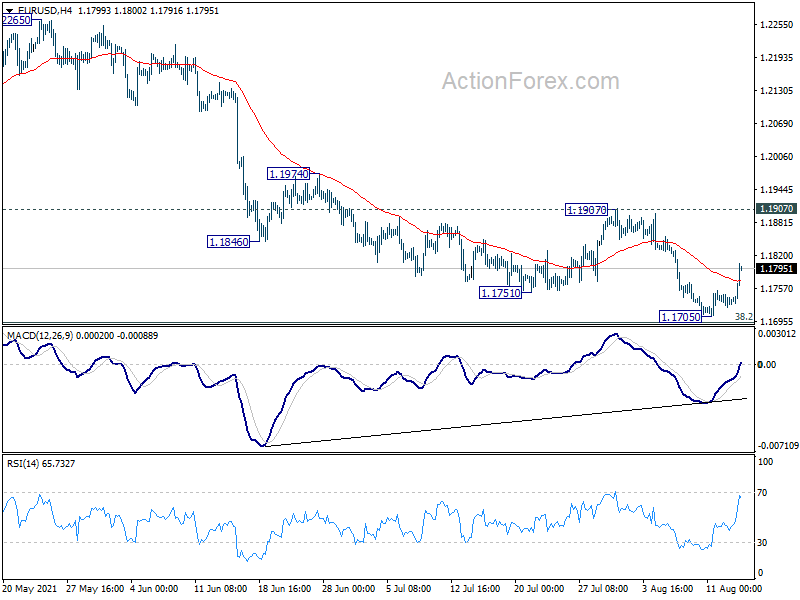
EUR/USD's late rebound last week suggests short term bottoming at 1.1705, on bullish convergence condition in 4 hour MACD. That also came just ahead of 1.1602/1703 key support zone. Initial bias is now on the upside this week for 1.1907 resistance first. Decisive break there will suggest that fall from 1.2265, as well as consolidation pattern from 1.2348, have completed. Near term outlook will be turned bullish for retesting 1.2265/2348 resistance zone. However, below 1.1705 will turn focus back to 1.1602/1703 key support zone again.
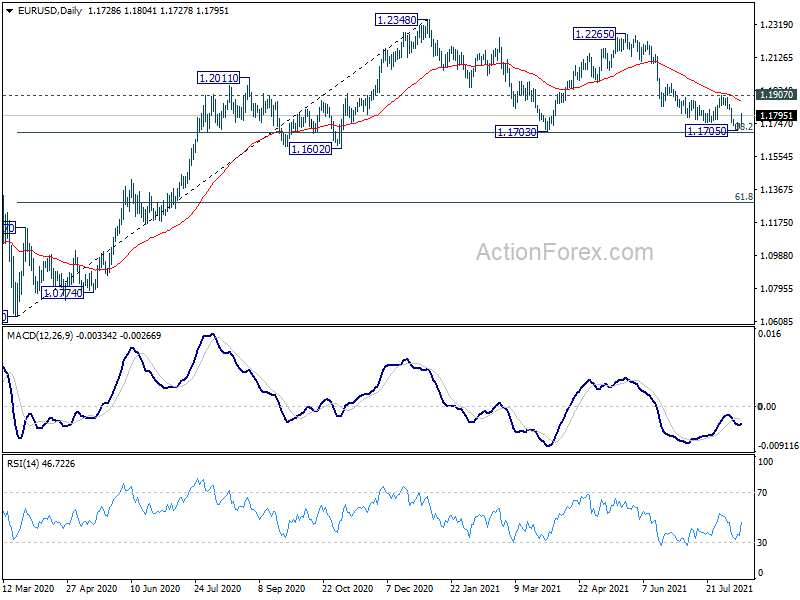
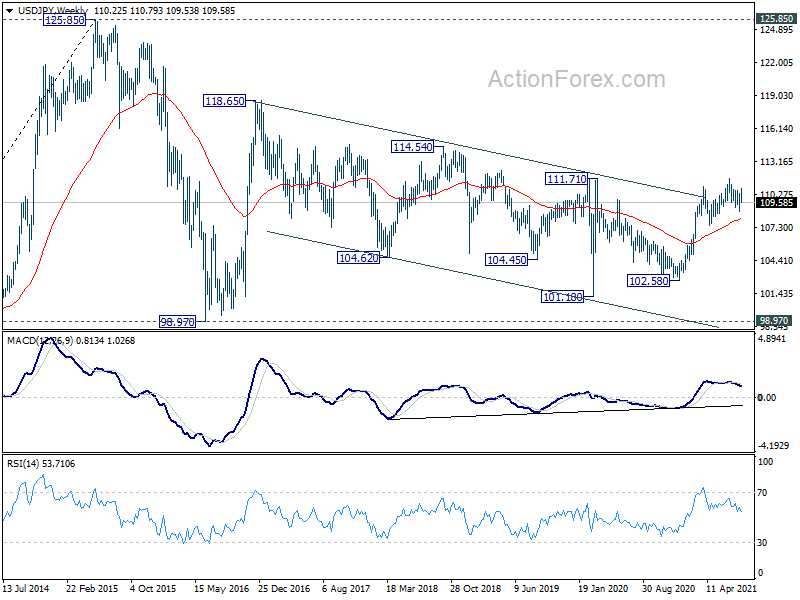
In the bigger picture, rise from 1.0635 is seen as the third leg of the pattern from 1.0339 (2017 low). Further rally remains in favors long as 1.1602 support holds, to cluster resistance at 1.2555 next, (38.2% retracement of 1.6039 to 1.0339 at 1.2516). Reaction from 1.2555 should reveal underlying long term momentum in the pair. However sustained break of 1.1602 will argue that the rise from 1.0635 is over, and turn medium term outlook bearish again.
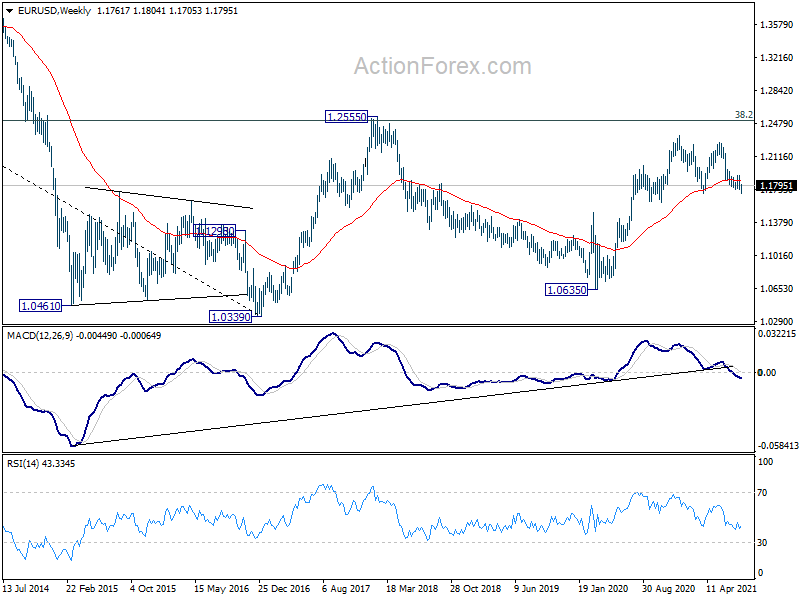
In the long term picture, focus remains on 1.2555 cluster resistance (38.2% retracement of 1.6039 to 1.0339 at 1.2516). Sustained break there should confirm long term bullish reversal and target 61.8% retracement at 1.3862 and above. However, rejection by 1.2555 will keep long term outlook neutral first, and raise the prospect of down trend resumption at a later stage.
USD/JPY Weekly Outlook
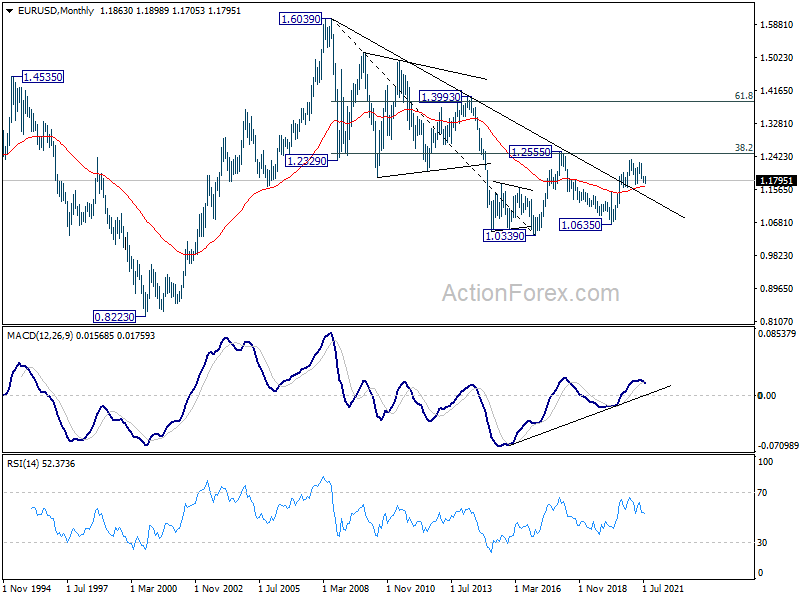
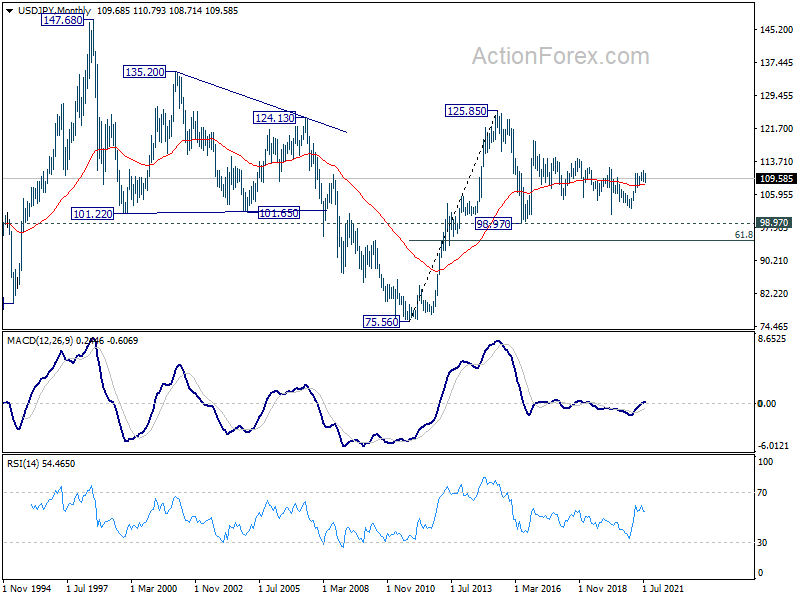
USD/JPY edged higher to 110.79 last week, but reversed and fell sharply from there. The development argues that corrective pattern from 111.65 is still extending. Initial bias is now mildly on the downside this week for 108.71 support first. Break there will target 38.2% retracement of 102.58 to 111.65 at 108.18 next.
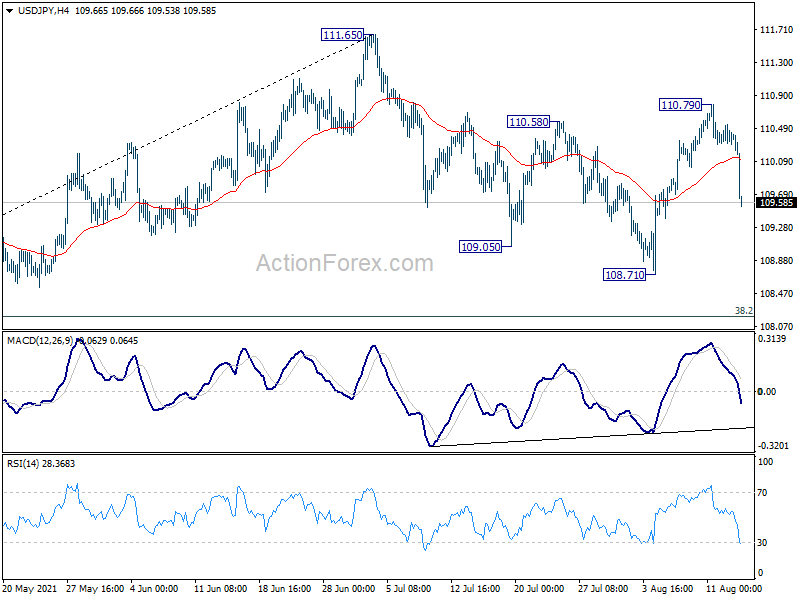
In the bigger picture, medium term outlook is staying neutral with 111.71 resistance intact. The pattern from 101.18 could still extend with another falling leg. Sustained trading below 55 day EMA will bring deeper fall to 107.47 support and below. Nevertheless, strong break of 111.71 resistance will confirm completion of the corrective decline from 118.65 (2016 high). Further rise should then be seen to 114.54 and then 118.65 resistance.
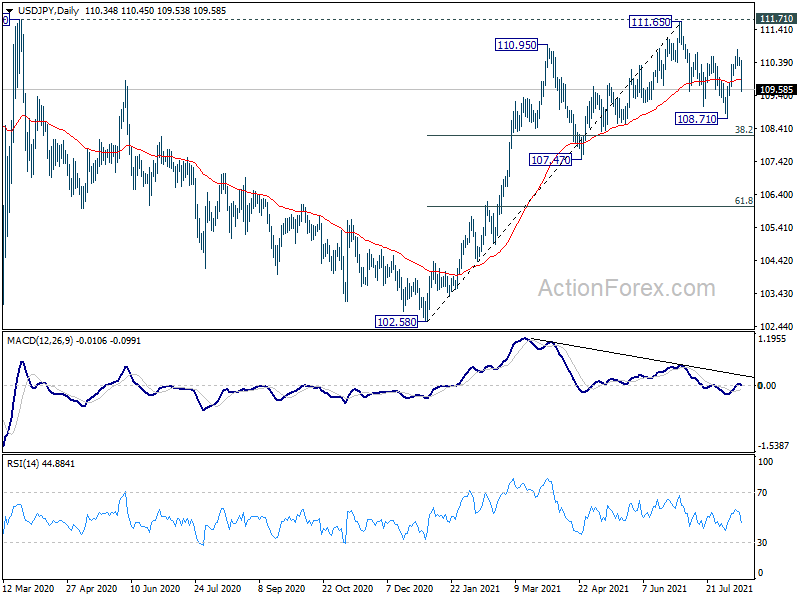
In the long term picture, the rise from 75.56 (2011 low) long term bottom to 125.85 (2015 high) is viewed as an impulsive move, no change in this view. Price actions from 125.85 are seen as a corrective pattern which could still extend. In case of deeper fall, downside should be contained by 61.8% retracement of 75.56 to 125.85 at 94.77. Up trend from 75.56 is expected to resume at a later stage for above 135.20/147.68 resistance zone.
GBP/USD Weekly Outlook
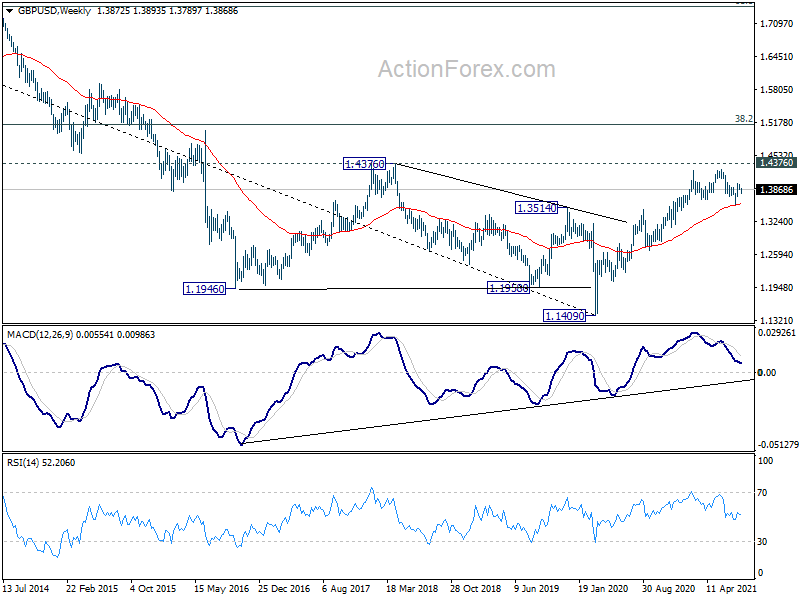
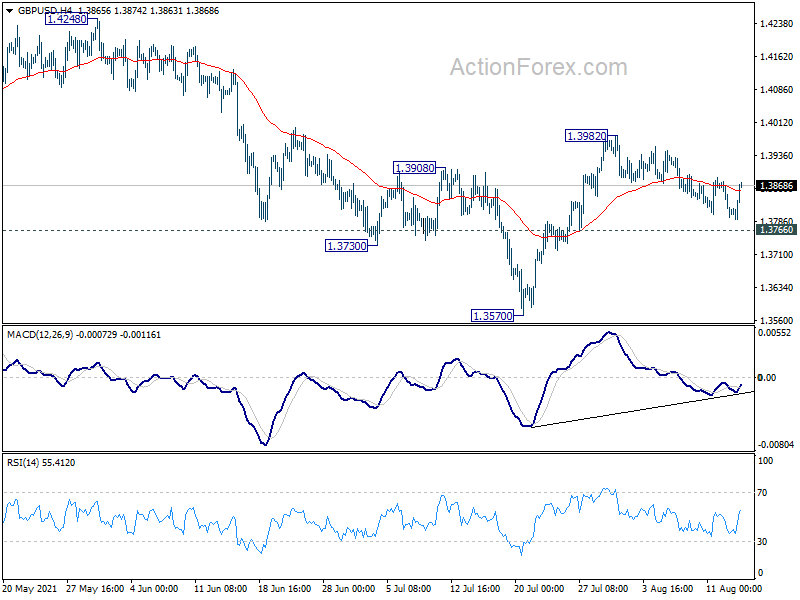
GBP/USD gyrated lower last week as consolidation from 1.3982 extended. Initial bias stays neutral this week first, and further rise is expected with 1.3766 support intact. As noted before, corrective pattern from 1.4240 could have completed with three waves down to 1.3570. Break of 1.3982 will resume the rise from 1.3570 to retest 1.4248 high. However, break of 1.3766 support will dampen this bullish view and bring retest of 1.3570.
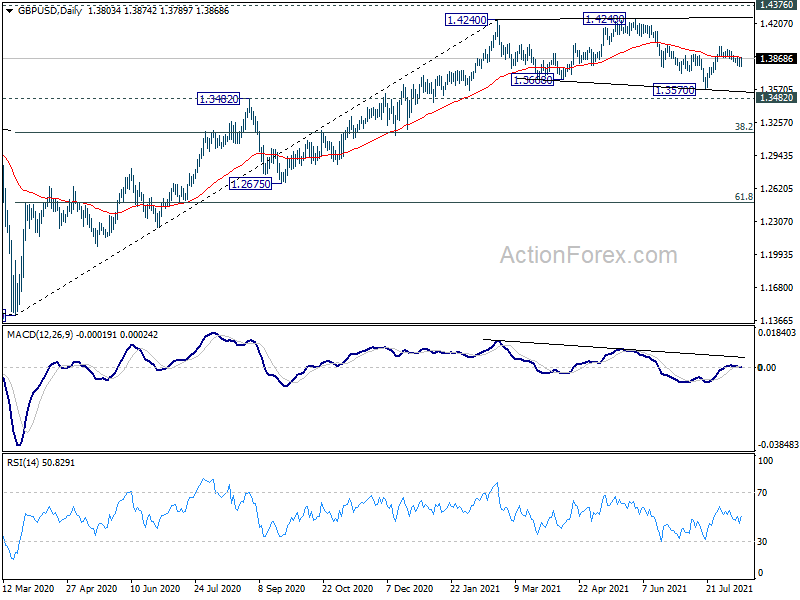
In the bigger picture, as long as 1.3482 resistance turned support holds, up trend from 1.1409 should still continue. Decisive break of 1.4376 resistance will carry larger bullish implications. However, firm break of 1.3482 support will argue that the rise from 1.1409 has completed. GBP/USD would then be seen in another leg of long term range pattern between 1.1409 and 1.4376. Deeper fall could then be seen to 61.8% retracement of 1.1409 to 1.4248 at 1.2493, and even below.
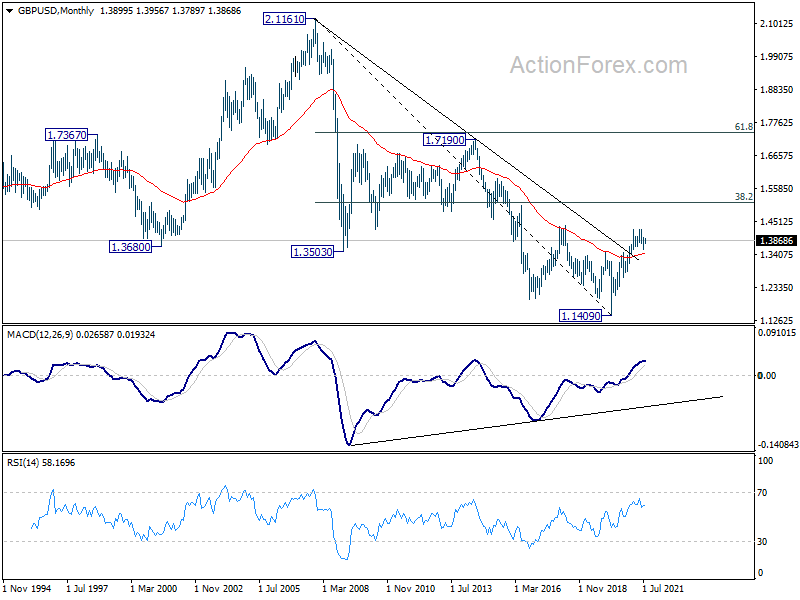
In the longer term picture, a long term bottom should be in place at 1.1409, on bullish convergence condition in monthly MACD. Rise from there would target 38.2% retracement of 2.1161 to 1.1409 at 1.5134. Reaction from there would reveal whether rise from 1.1409 is just a correction, or developing into a long term up trend.