Sample Category Title
Gold Outlook: Price Declined Heavily From Well Above The $1,800 Level Against The US Dollar
Gold price declined heavily from well above the $1,800 level against the US Dollar. The price traded as low as $1,679 before it started an upside correction.
The price is slowly rising and it broke the $1,750 resistance. There was also a close above the $1,765 level and the 50 hourly simple moving average. It is now testing the $1,780 resistance zone.
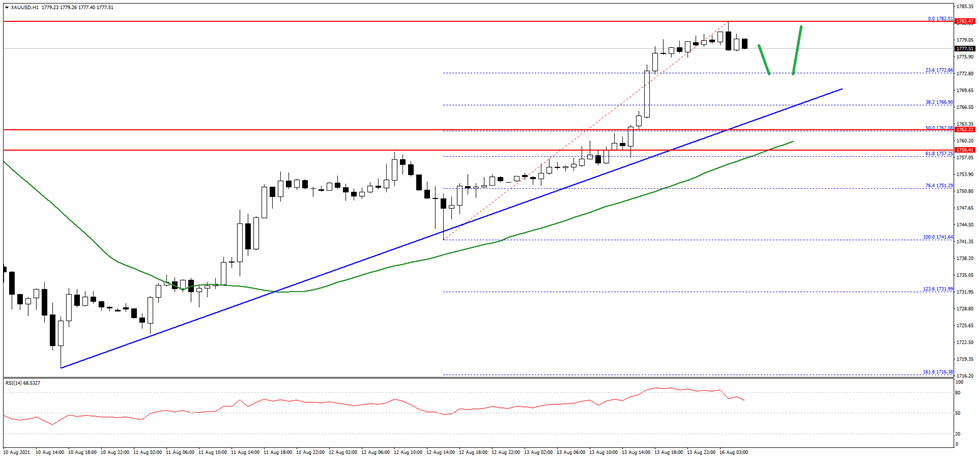
A clear break above the $1,780 resistance could push the price further higher. The next main resistance is now forming near the $1,800 level, above which the price is likely to accelerate higher in the near term.
On the downside, there is a decent support on FXOpen forming near the $1,765 level. There is also a key bullish trend line forming with support near $1,765 on the hourly chart, below which the price could revisit $1,750.
XAG/USD Bounces Above Resistance
Silver claws back losses as US Treasury yields remain flat on mixed US data.
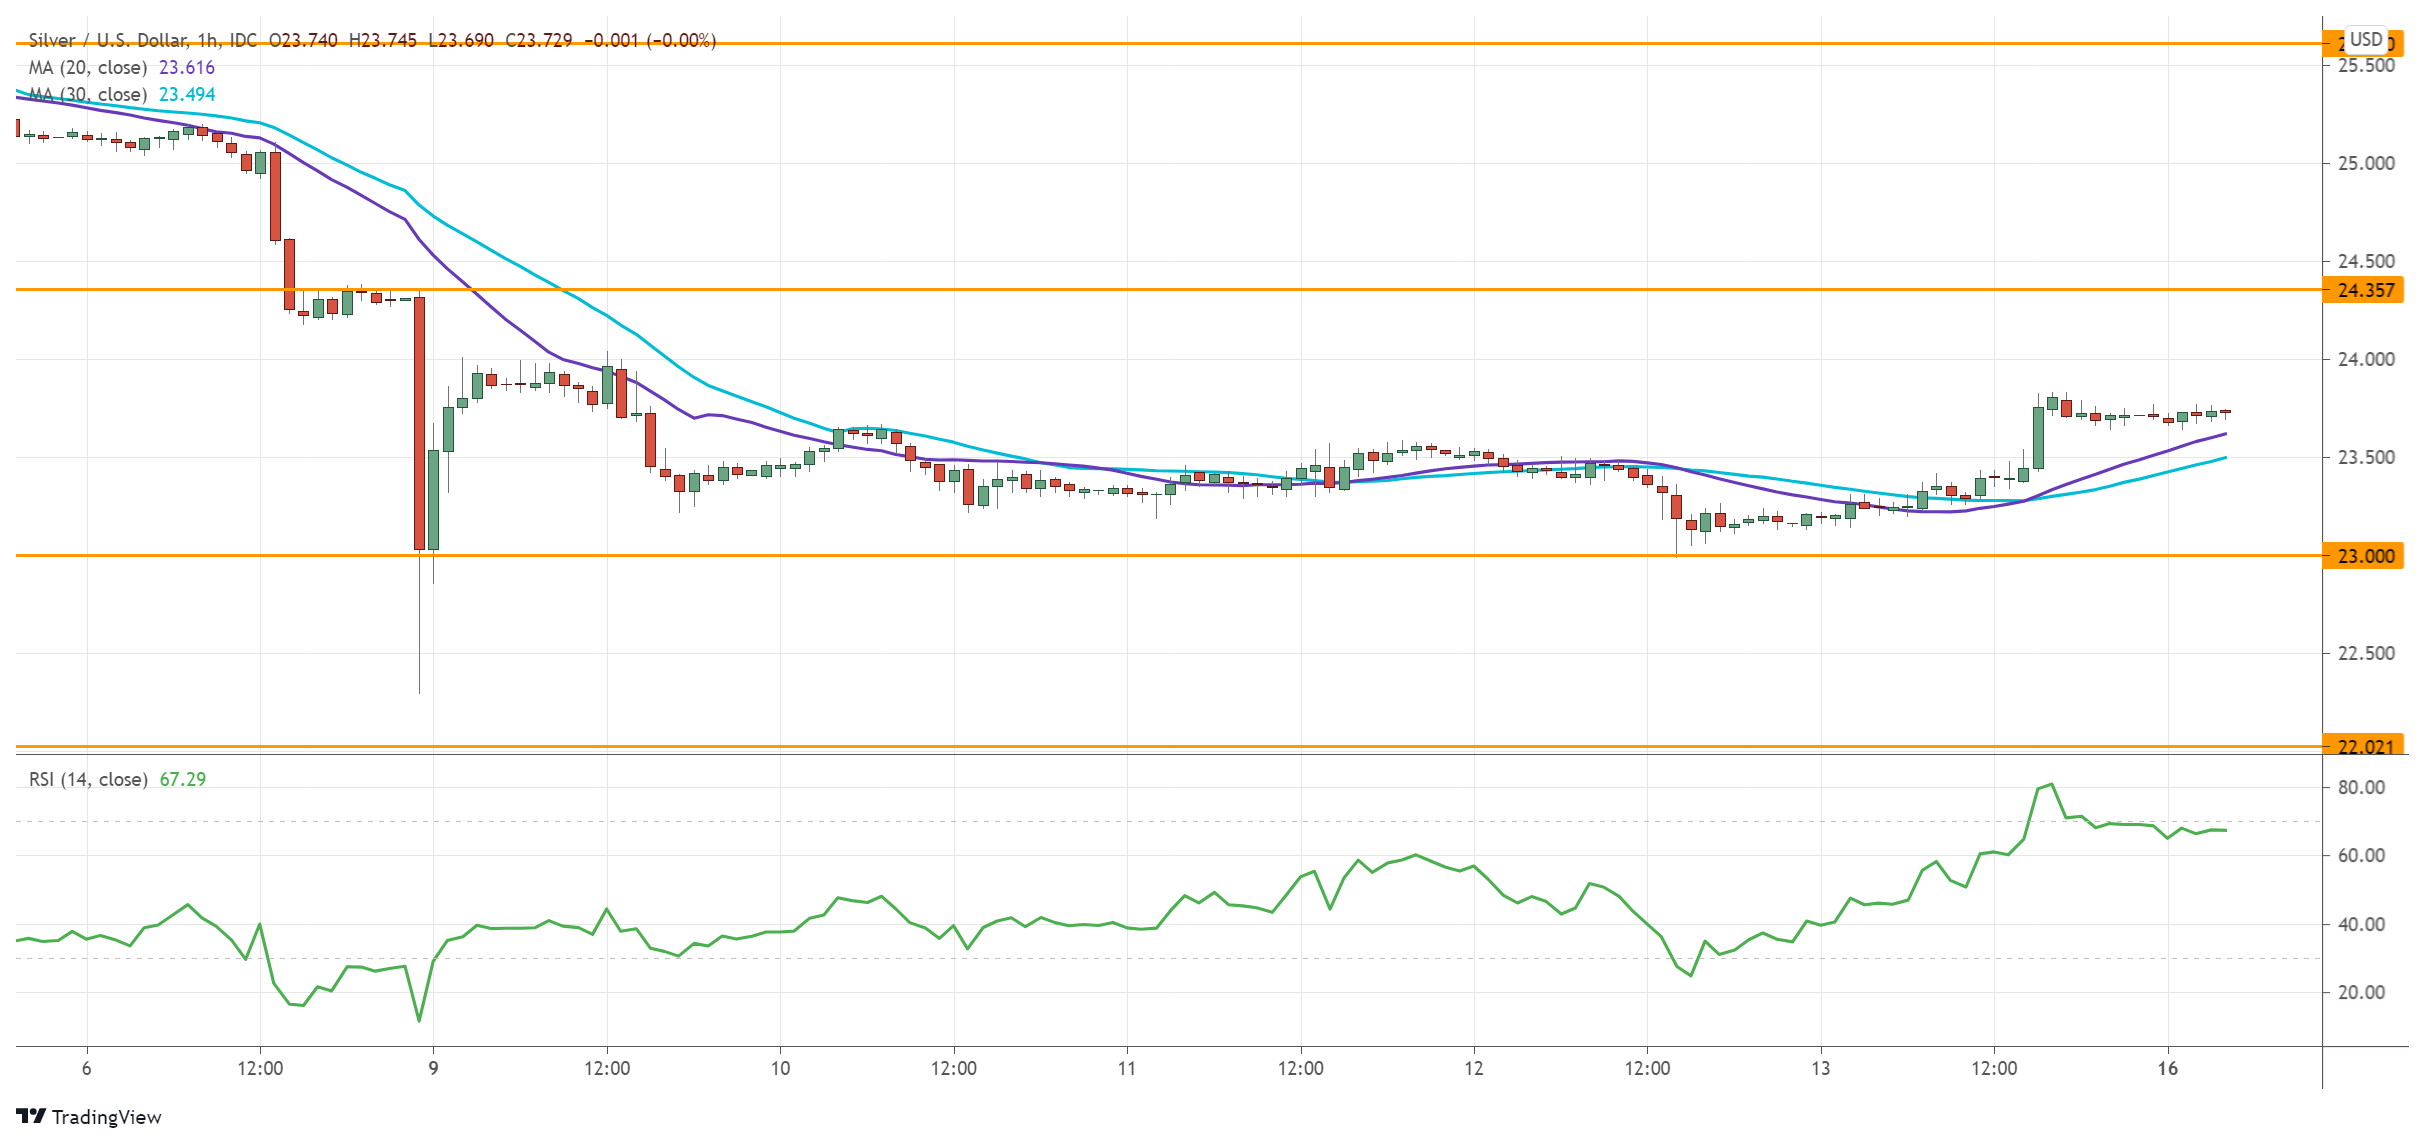
Price action has so far found support above the psychological level of 23.00.
The RSI has risen back to the neutral area as traders bought the dip in an attempt to reverse course. However, the bearish mood would prevail as long as the metal stays under 24.35, the last leg of sell-off.
A rebound may meet strong selling interest from trend followers. A fall below the said support would send the price to November’s low at 22.00.
USD/JPY Seeks Support
The Japanese yen strengthens on upbeat GDP growth in Q2.
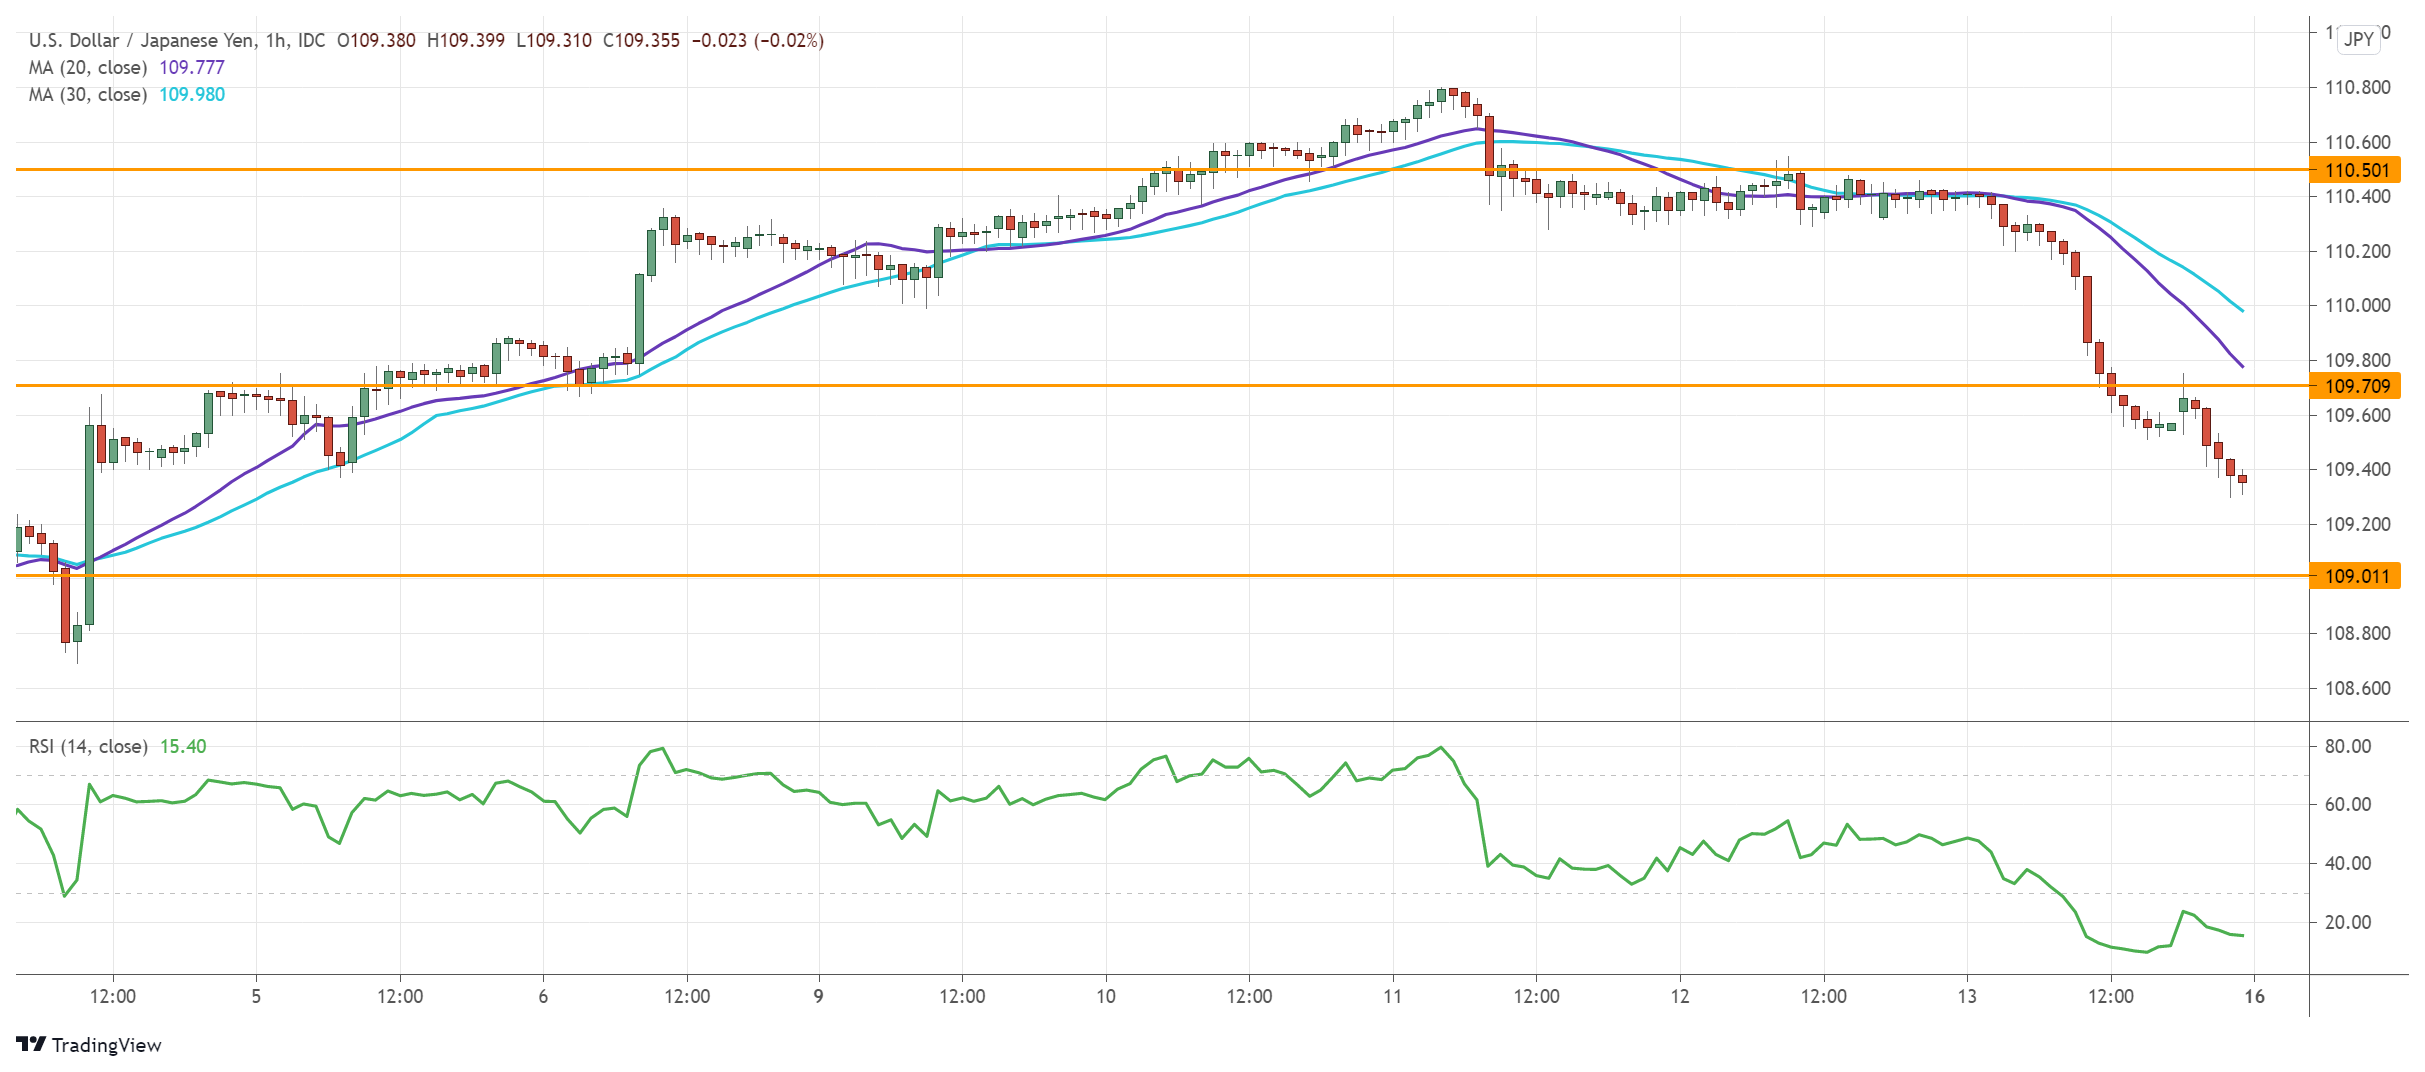
The pair is looking for support after a close above the daily resistance at 110.60. This is an indication that the medium-term rally may resume.
A pullback is necessary however after the RSI showed exhaustion. Analysts can expect buying interest at the psychological level of 109.00. An oversold RSI would make this a congestion area and prompt the bulls to buy the dip.
109.70 is a fresh resistance ahead. A bullish breakout would lead to 110.50.
GER 30 Rises Along Trendline
The Dax 30 soared to a new all-time high backed by a strong earnings season.
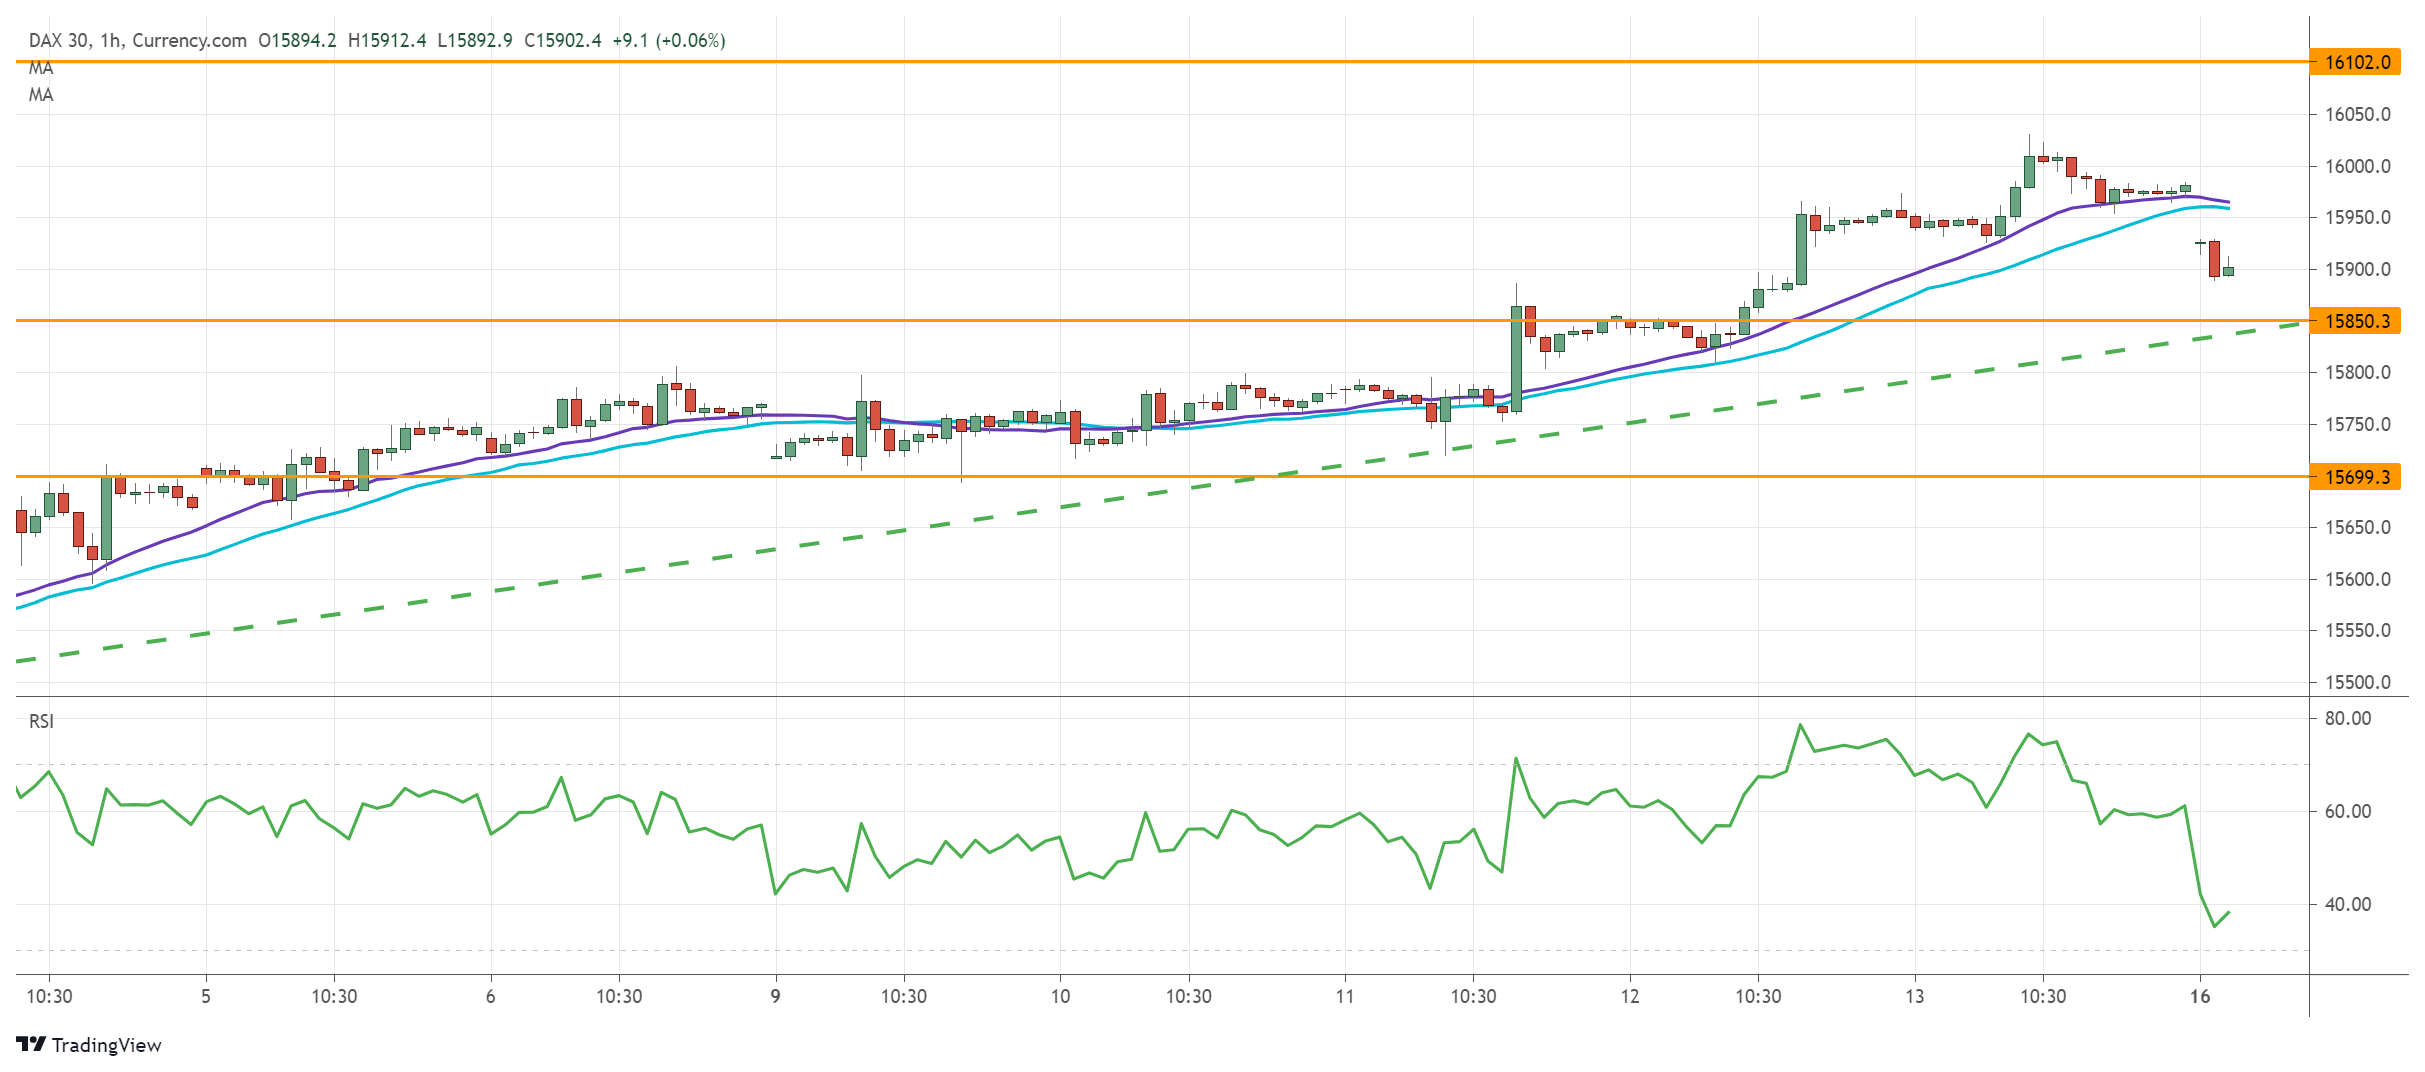
The rally is in full swing after a break above the previous peak at 15810. The index is climbing along a rising trendline since late July. The price has gone vertical and suggests an acceleration in the bullish momentum.
A repeatedly overbought RSI indicates an overextension. A limited pullback would help the bulls catch their breath.
15850 on the trendline is a key support should this happen. Then a rebound would lift the index to 16100.
Market’s Sentiment Deteriorated By Caution In The US And China Data
The US dollar turned sharply lower on Friday night after a shocking release of US consumer sentiment. The University of Michigan's regular survey showed consumer sentiment falling to 70.2 from 81.2 a month earlier, the lowest level since December 2011. This unpleasant data took the index by surprise, triggering a revaluation of assets and sentiment.
The index lost 13.5% over the month, the seventh-largest loss of confidence in the indicator's history. On all occasions of this magnitude, reduction had occurred against a background of a sharp deterioration in the economy, with the last commensurate collapses in October 2008 and April 2020, when the economy posted the sharpest declines.
Due to the new wave of coronavirus, both components of current conditions (-7.8% to 77.9) and consumer expectations (-17.5% to 65.2) fell simultaneously.
The US markets reacted differently to the news. Demand for long-term bonds has increased in debt markets as smart money has raised doubts about the sustainability and speed of the economic recovery. This means that interest rates in the economy will remain low for longer.
After a brief fluctuation, the Nasdaq index increased as lower market yields sparked interest for growth stocks. This is nothing more than a reflex developed by the market, as lately, any downturn is seen as a reason to increase stimulus. But remember, it is not a hypothesis, and sometimes central banks or governments have their hands tied.
On Monday morning, market caution elevated to an even higher level following Chinese reports, highlighting a sharper economic slowdown. In July, industrial production growth slowed to 6.4% from 8.3% a month earlier and the expected 7.9%. Retail sales growth slowed to 8.5% from 12.1% a month earlier and was expected to be 10.9%.
US consumption and Chinese production are the two biggest drivers and indicators for financial markets. A sharp dip in these indicators would impact the markets, lasting for several days. At the same time, investors' attention to other indicators will intensify.
We can expect a higher than usual market reaction to the publication of the Empire State manufacturing index and tomorrow's retail sales data.
USDJPY Slides After The Strong Japan GDP Data
The USDCAD pair rose slightly after the Canadian president called for Snap elections that will be held on September 20th. The country was originally set to go to election in the next two years. In a statement, Justin Trudeau said that the election will be a referendum on the government’s response to the Covid pandemic. He also said that the election will allow the government to continue its fight on key issues like climate, healthcare, and welfare. His government currently holds a minority power with 155 seats in parliament, which was less than the 170 threshold. The currency will react to the latest Canadian manufacturing sales numbers.
The USDJPY pair declined in early trading after relatively strong Japan GDP numbers. The data showed that the country’s economy expanded by 0.3% in the second quarter after slumping by 1% in the first quarter. The economy expanded by 1.3% on a year-on-year basis. This increase was better than the median estimate of 0.7%. Private consumption increased by 0.8% while capital expenditure increased by 1.7%. The main laggard was external demand, which slumped by 0.3%. The pair also retreated after data showed that US consumer confidence declined to the lowest level since 2011 as the Covid situation worsened.
The financial markets largely ignored ongoings in Afghanistan, where the Taliban managed to conquer Kabul. The democratically-elected president and his government fled the country while Western governments evacuated their staff. The mild reaction was mostly because the weekend’s events were easy to predict. Meanwhile, the economic and earnings calendar will be relatively muted today. The only major event will be the German central bank monthly report and the Empire States manufacturing index.
USDJPY
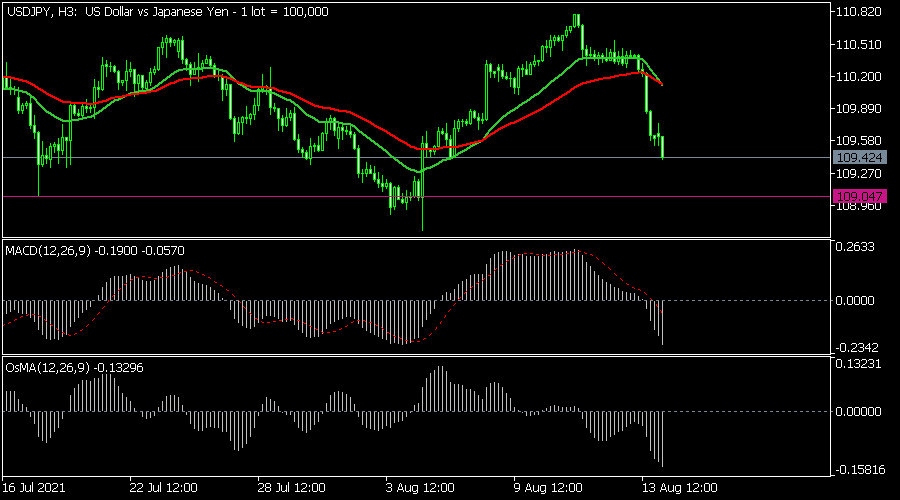
The USDJPY extended Friday’s decline after strong Japan GDP data. The pair fell to a low of 109.42, which was the lowest level since August 6. Along the way, the pair moved below the 25-day moving average while oscillators slumped. The moving average of oscillator declined to the lowest level in months while the histogram of the MACD fell to the lowest point this month. It will likely maintain the bearish momentum as bears target the next key support at 109.00.
EURUSD
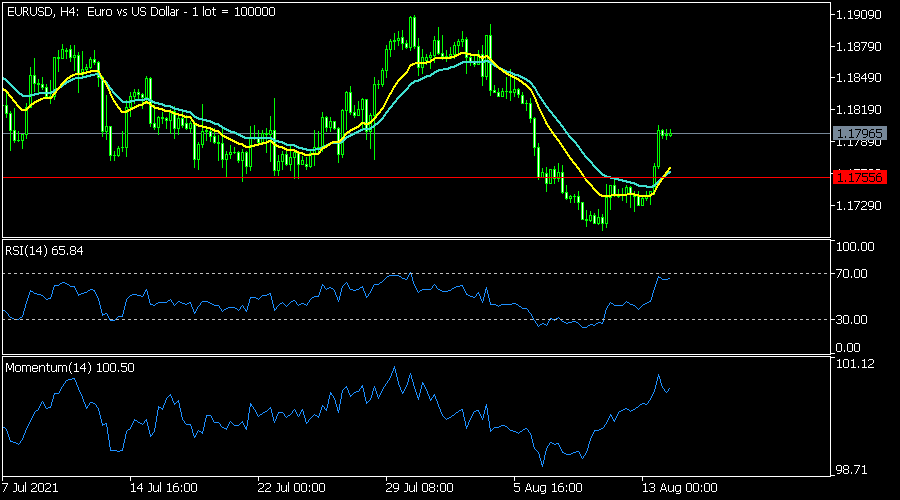
The EURUSD was little changed during the Asian session after it jumped on Friday. The pair rose above the key resistance level at 1.1750. It also moved above the 25-day and 15-day moving averages while the Relative Strength Index (RSI) has moved close to the overbought level of 70. The momentum indicator has also been in a bullish trend. Therefore, the pair will likely keep rising as bulls target the key resistance at 1.1800.
USDCAD
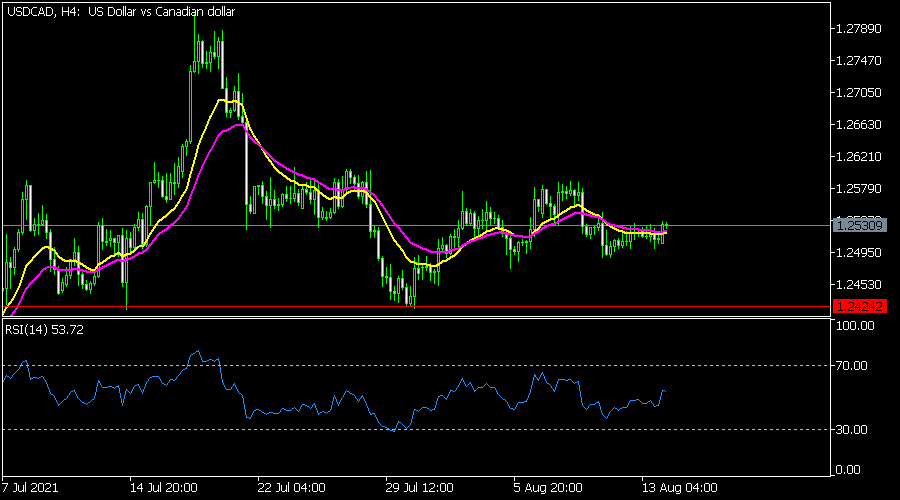
The USDCAD pair was little changed after the Canadian president called a snap election. On the four-hour chart, the pair has formed what looks like a head and shoulders pattern whose neckline is at 1.2425. It has also moved along the 25-day and 15-day moving averages. The RSI has also moved above 50. The pair will likely break out lower in the near term.
EURUSD Flirts With 1.1800, Neutral Outlook
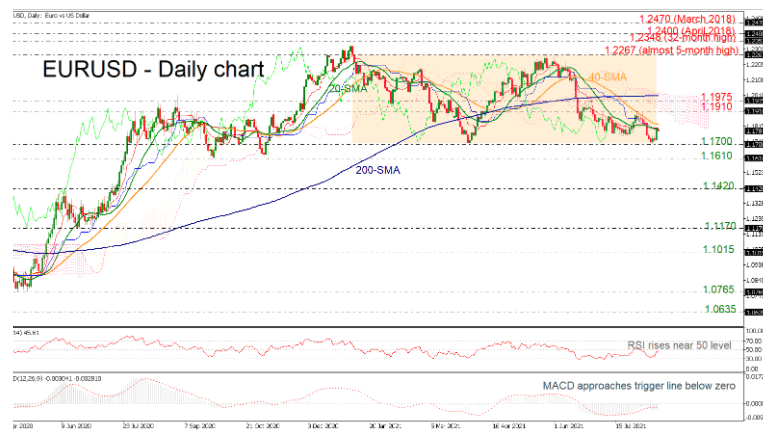
EURUSD is flirting with the 20-day simple moving average (SMA) near 1.1800 after the rebound off the 1.1700 critical level, which is also the lower boundary of the seven-month consolidation area.
According to the technical indicators, the RSI is rising towards the neutral threshold of 50 and the MACD oscillator is ready to cross to the upside of its trigger line in the negative region. In terms of trend indicators, the Ichimoku cloud is moving lower. However, the 20- and 40-day SMAs are turning up as well as the Ichimoku lines.
If the pair overcomes the short-term SMAs, the next target would be the 1.1910 and 1.1975 resistance levels. Marginally above these lines, the flat 200-day SMA at 1.2005 could come into the spotlight ahead of the almost-five-month high of 1.2265 and the 32-month peak of 1.2348.
On the other side, a successful drop below 1.1700 could drive the bears lower to 1.1610 and 1.1420, shifting the neutral bias to bearish. Even lower, the next support would be the 1.1170 barrier, registered in June 2020.
In brief, EURUSD has been in a trading range since January and any closing candles above 1.2267 or below 1.1700 could identify the broader outlook.
Daily Tecnical Analysis
EUR/USD
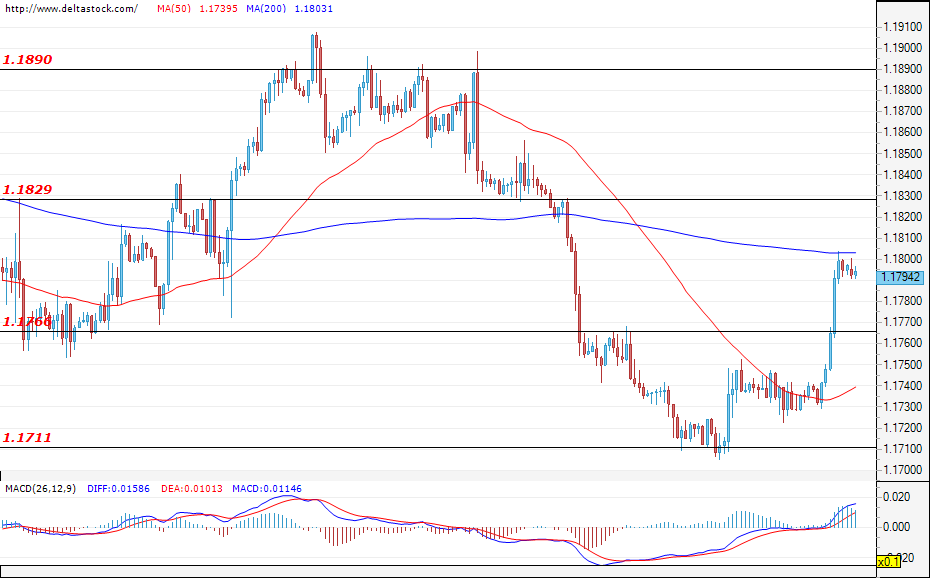
Current level - 1.1794
During the last trading session for the previous week, the corrective phase continued developing for the EUR/USD and the pair breached the resistance level of 1.1766. The next resistance lies at 1.1829. The forecast is for the pair to retest the support zone at 1.1711 once the corrective phase is complete. This week, investors' attention will be focused on the data on the consumer price index for the euro area (Wednesday; 09:00 GMT) and the initial jobless claims for the U.S. (Thursday; 12:30 GMT).
| Resistance | Support | ||
| intraday | intraweek | intraday | intraweek |
| 1.1829 | 1.1890 | 1.1760 | 1.1650 |
| 1.1890 | 1.1944 | 1.1711 | 1.1600 |
USD/JPY
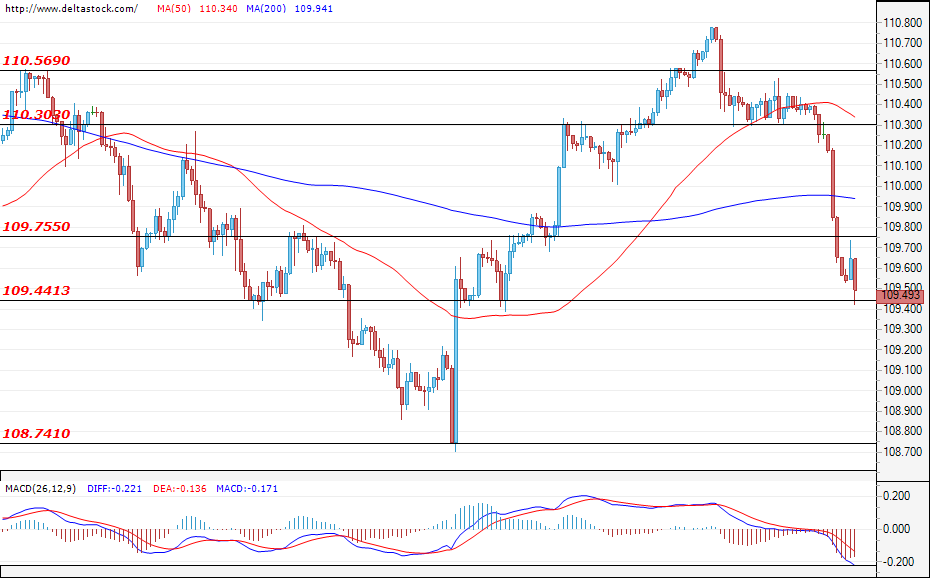
Current level - 109.49
The corrective phase continues for the pair as it violated the support level of 110.30 at the end of last week and, at the time of writing, is headed towards a test of the next support level at 109.44. The expectations are for the dollar to regain positions against the yen once the corrective phase is complete and for the resistance level of 110.56 to be re-tested. In the negative direction, the main support is found at 108.74.
| Resistance | Support | ||
| intraday | intraweek | intraday | intraweek |
| 109.75 | 111.00 | 109.44 | 109.44 |
| 110.56 | 111.50 | 108.74 | 108.74 |
GBP/USD
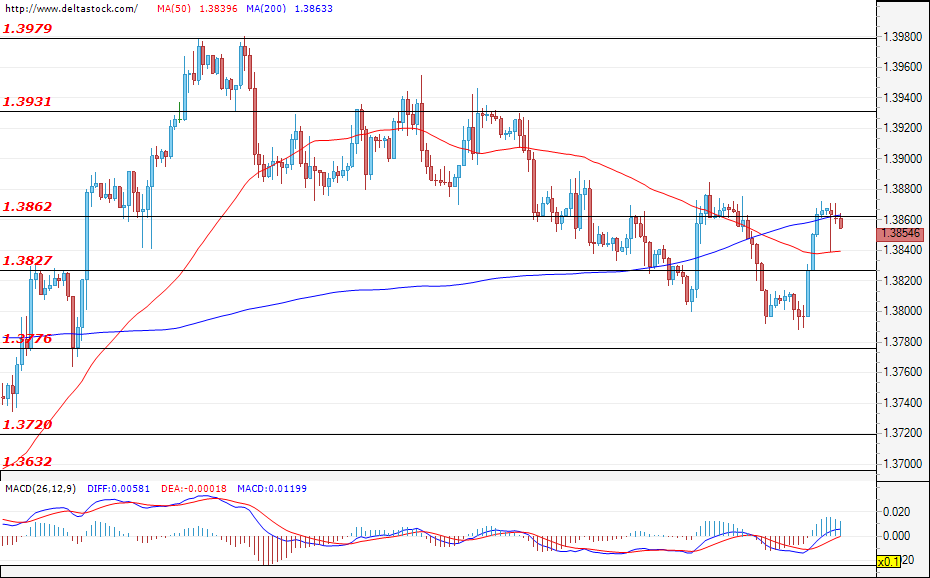
Current level - 1.3854
Like most of the other major currencies, the dollar depreciated against the sterling at the end of the previous week. At the time of writing, the Cable is headed towards a test of the resistance level at 1.3862 which, if successful, would deepen the correction and we might witness prices rise above 1.3900. In the negative direction, the first support lies at 1.3827. This week, investors' attention will be focused on the data on the consumer price index (Wednesday; 06:00 GMT) and the retail sales for the UK (Friday; 06:00 GMT).
| Resistance | Support | ||
| intraday | intraweek | intraday | intraweek |
| 1.3827 | 1.3931 | 1.3827 | 1.3632 |
| 1.3862 | 1.3979 | 1.3776 | 1.3570 |
The Canadian Dollar Is Trading Slightly Lower In The USD/CAD 1.254 Area
Markets
Failure to take out support levels in both EUR/USD and EUR/GBP triggered return action higher in thin Summer trading conditions. EUR/USD 1.1704/1.1695 support is the current stop to the August dollar rally after last Wednesday’s CPI print -" high, but in line with expectations -" couldn’t give the extra push in the back. Sterling at EUR/GBP 0.8470 no longer benefited from the Bank of England’s momentum early August when it delivered a fresh and more hawkish forward guidance. The currency pairs respectively closed at EUR/USD 1.1797 and at EUR/GBP 0.8504. Similar dynamics as in USD were at play in US yields. The August leap higher stranded on Wednesday followed by a rather steep drop on Friday as investors digested last week’s supply operation well. An unexpectedly weak University of Michigan consumer confidence (lowest since December 2011) added to the mood and moves in USD and US yields. Details showed that consumers are becoming more reluctant to spend as higher prices bite. US yields declined by 1.5 bps (2-yr) to 8.2 bps (10-yr) in a daily perspective. The German yield curve flattened slightly with daily changes ranging from +0.8 bps (2-yr) to -1.5 bps (30-yr).
Asian risk sentiment suffers a setback this morning with Japan (-1.5%) underperforming despite a better-than-expected Q2 GDP release. Local Covid-issues are the main concern (see below). A stronger yen also weighs with USD’s correction lower on Friday and this morning being most outspoken in USD/JPY. The pair opened at 110.41 on Friday to currently change hands one big figure lower. Geopolitics (Taliban taking control of the Afghan capital Kabul) and slowing Chinese growth momentum at the start of Q3 dampen the general risk mood. Retail sales (8.5% Y/Y from 12.1% Y/Y vs 10.9% Y/Y forecast), industrial production (6.4% Y/Y from 8.3% Y/Y vs 7.9% Y/Y forecast), and investments (10.3% YTD Y/Y from 12.6% YTD YoY vs 11.3% YTD YoY forecast) all disappointed in July. The Delta variant outbreak is the main culprit, especially for the hit on consumption. Chinese stocks this morning outperform as the weaker data strengthen the case for additional PBOC policy easing. Global core bonds extend Friday’s gains this morning with European equity futures pointing at losses at the open. The dollar stabilizes following Friday’s decline and even seems to be getting the upper hand over sterling and the euro in a risk-off market climate. Today’s eco calendar is empty apart from the August Empire Manufacturing Survey which will probably play second fiddle next to risk sentiment. Other highlights this week include US retail sales (tomorrow), EMU Q2 GDP numbers (Tuesday), and minutes of the July FOCM meeting. The Reserve Bank of New Zealand (Wednesday; first rate hike?) and Norges Bank (Thursday; preparing September hike?) hold policy meetings.
News headlines
The Japanese government is expected to extend and broaden the (non-enforceable) state of emergency in regions including Tokyo to the middle of September, a Japanese newspaper reported. The current state is due to expire end of August. The country struggles to contain the spread of the virus as pandemic fatigue hits and summer vacations are seen contributing to the latest Covid surge. The report weighs on sentiment, overshadowing better-than-expected Japanese growth figures. Q2 GDP rose with 0.3% q/q vs 0.1% expected with both private consumption (0.8% q/q) and business spending (1.7% q/q) delivering a larger than expected contribution.
Canadian prime minister Trudeau on Sunday called an early election for September 20. Trudeau said he needs a new mandate to have the public behind the government’s Liberal plan to recover from the pandemic, adding that the measures in it will have an impact lasting for decades. Polls suggest the Liberals will win this third consecutive election but that it might be difficult to regain a majority in the House of Commons. Another minority administration would leave Trudeau’s party relying once more on the New Democrats for passing legislation. The Canadian dollar is trading slightly lower in the USD/CAD 1.254 area.
EUR/USD Breakout Occurs
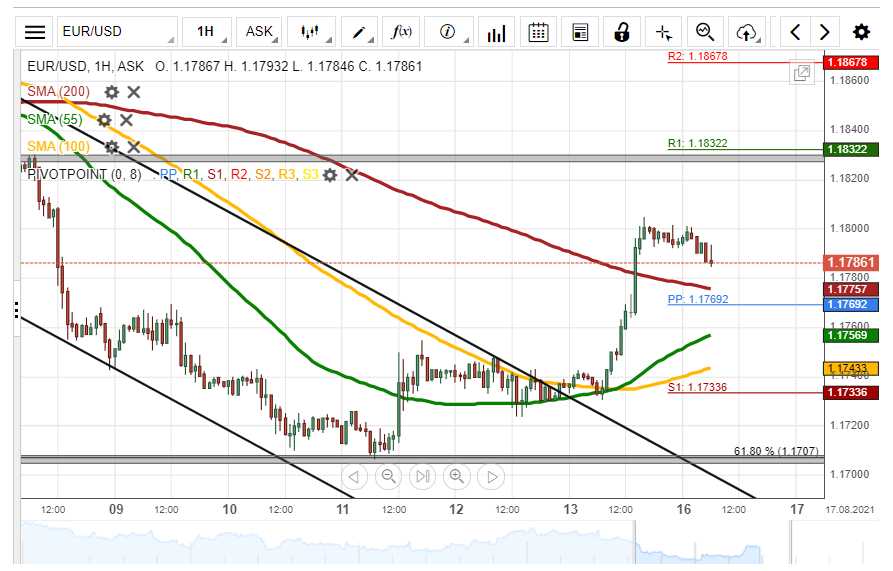
On Friday, the Eurozone single currency edged higher by 71 pips or 0.61% against the US Dollar. A breakout occurred through the upper boundary of a descending channel pattern during Friday's trading session.
Given that a breakout has occurred, the exchange rate could continue to surge during the following trading session. The potential target for buyers will be near the weekly resistance level at 1.1832.
On the other hand, the EUR/USD currency exchange rate could reverse from the current price level at 1.1799 and target the 55– hour simple moving average at 1.1753 within this session.