Sample Category Title
The US Dollar Retreats On Weak Consumer Confidence
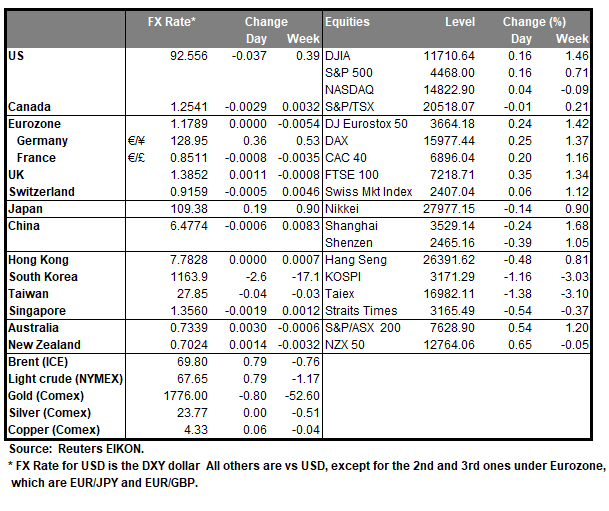
On Friday, weak US consumer confidence data flowed through bond markets, sending long-dated yields lower and pulling the rug from under the US Dollar’s feet. The dollar index plunged by 0.51% to 92.52, climbing just a few points to 92.55 in Asia. With the edge being taken off the recent taper talk post-data, investors rushed to cut long US Dollar positions into the weekend.
If nothing else, it emphasises just how vital the trajectory of US rates is to the US dollar’s direction at the moment. How much legs the greenback’s sell-off will have is hard to determine right now, and we may get more answers from the FOMC Minutes later this week, notably the discussion amongst members over the timing, or not, of QE tapering. In the shorter term, the US Dollar looks vulnerable to further losses with no real chart support until 91.80. Short of a rapid escalation in global risk aversion, rallies towards 93.00 are likely to meet firm resistance.
G-10 currencies
EUR/USD leapt by 0.56% to 1.1795 on Friday, where it remains in Asia. Initial resistance is at 1.1805, followed by 1.1850 with support at 1.1730. GBP/USD rose 0.44% to 1.3870 before fading to 1.3848 in Asia. Sterling has resistance at 1.3900, 1.3950 and then 1.4000, with support near 1.3800 and 1.3780, the 200-day moving average. (DMA) USD/JPY, as a pure US/Japan yield play, flopped 0.75% to 109.60 as US yields tracked lower. It has retreated another 20 points to 109.40 in Asia as risk sentiment rises after China data and nerves about Japan’s virus situation. USD/JPY closed below the 100 DMA at 109.70 on Friday, which becomes resistance. If US yields stay soft, USD/JPY could potentially retest 109.00, stopping out much of the speculative long-positioning of the previous week. The Yen may also receive some haven flows this week, like the Swiss Franc.
AUD/USD and NZD/USD both rallied on Friday but have given back much of those gains today, as risk sentiment in Asia sharply deteriorates after the softer China data releases. AUD/USD has fallen by 0.45% to 0.7338, as Australia’s virus lockdowns increase as well. AUD/USD has failed at last week’s breakout of the rising wedge at 0.7375, which is now resistance. The double bottom at 0.7315 is initial support, and failure could trigger another 100 points of losses to around 0.7200 to meet the wedge breakout target. NZD/USD should find more support on dips as the RBNZ is expected to hike rates this week. In the present climate, though, it will struggle to make consistent gains either. NZD/USD should trade in a 0.7000 to 0.7075 range to start the week. However, failure 0f 0.6990 could trigger a sell-off targeting 0.6900.
Asian currencies
Asian regional currencies fell versus the US Dollar on Friday, with investors preferring to express US weakness via G-10 currencies. Asia’s ongoing virus concerns will dampen any positive response to better Q2 data, and until it resolves, Asian currencies will remain a sell on rallies. The Malaysian Ringgit looks particularly vulnerable as Malaysia’s political crisis also deepens and oil prices remain soft. Conversely, the Indian Rupee could outperform later today after PM Modi’s weekend infrastructure package announcement.
Oil Prices Tumble On US/China Data
Oil prices tumbled on Friday after weaker consumer confidence data, tracing another leg lower in Asia after China’s data rose by far less than expected, triggering fears that its recovery is slowing. Virus fears also appear to be weighing on Asian sentiment in general, with markets casting a wary eye towards the evolution of the situation in China, particularly partial port closures.
On Friday, Brent crude fell by 1.30% to $70.20 a barrel, losing another 0.65% to $69.75 today in Asia. WTI sell by 1.40% to $67.95 a barrel on Friday, losing another 0.50% to $67.60 in Asia. Both contracts, in an ominous technical development, closed below their respective 100-DMAs on Friday.
Brent crude has resistance at $70.40 and then $72.00 a barrel, with support at $69.00 and then $67.50 a barrel. WTI has resistance at $68.25, $69.25, and then $70.00 a barrel. Support lies at $66.50 and then $65.00 a barrel. With financial markets now clearly more concerned about global growth and the global recovery this week than last week, oil’s downside remains the more vulnerable.
Gold Rises On A Weaker US Dollar
Weak US consumer confidence on Friday sent US yields sharply lower, feeding through to a bout of concerted US Dollar weakness. That was enough to lift gold sharply higher, rallying by 1.55% to $1780.00 an ounce. I must admit that the power of the gold rally caught me by surprise, but the price action itself contains warnings. Gold continues to trade inversely to the US Dollar, and readers should be under no illusion that a gold position is merely a US Dollar position right now.
Forget all the inflation hedging, haven nonsense. The fact that gold rallied nearly $40 as US yields FELL should dispel that nonsense. The speed of the rally over the past few sessions has more than a few hinting of tail-chasing FOMO investors who got stopped out, either on the 6th or 9th of August, desperately piling back in. That trading style works on equities but is usually a path to heartbreak in other asset classes. (Except perhaps cryptos, if you consider them an “asset”)
Gold’s direction will depend entirely on the US dollar direction this week, which admittedly looks weaker. That should support gold, although it has fallen slightly to $1774.50 an ounce in Asian trading, no post-Afghanistan haven buying there then, please re-read the above paragraph. Gold has initial support at $1750.00 an ounce, some distance away. However, if the US Dollar stays a week, gold should find plenty of FOMO sheep on any dip to $1760.00 an ounce. Resistance is at $1782.50 an ounce, followed by $1800.00, and then the 100-DMA at $1805.50 an ounce.
USD Down As Consumer Sentiment Retreats
The greenback was on the back foot on Friday after a rather disappointing Preliminary Un. Mich Consumer sentiment reading that displayed a drop to 70.2 from previous 81.2. According to the Dollar Index, this may have been the largest daily drop for the greenback so far in August confirming traders considered the news as rather important at this stage. The reading maybe raising hopes among traders that the Fed could postpone its QE program tapering.
Gold prices on the contrary gained substantially on Friday after the pre mentioned release as some traders may prefer the fast-moving metal over indications of weak economic data. Gold has rebounded most of the ground lost in the previous weeks and seems to be undertaken by a different interest in August. Today traders await the NY Fed Manufacturing reading while the week ahead seems to offer a plethora of events and opportunities for traders.
On Friday USD/JPY broke beneath the (R1) 109.80 level turning it into our first resistance. If the downward trend continues then the currency pair could find support at our (S1) 109.05. Lower than that the (S2) 108.65 support can also be attended in a stronger selling scenario. Yet in case of a breakdown, the (S3) 108.25 line is also imminent even though it has not been tested since May making it a monthly low. On the contrary, if the currency pair is favored by an upward momentum then a return to the (R1) 109.80 could signal more bullish appetite maybe on the way. In this case the (R2) 110.35 level which has been various time in the previous week is the most possible point for traders to consider opening or closing more trades. At the top the (R3) 110.80 is our highest resistance in this case representing also the highest price reached so far in August. With the latest selloff the RSI indicator below our chart has dropped below the 30 level possibly indicating the bearish momentum could be peaking.
Oil displays bearish tendencies
CAD traders have an interesting day ahead with the release of Manufacturing Sales figure in the US session. The Loonie is marginally higher in August and the challenge for CAD bulls to reverse the trend is on in the days ahead also. WTI prices continued to drop on Friday after the International Energy Agency stated the spread of coronavirus variants is an additional downside to oil prices and demand. Another reason maybe also that from August onward the OPEC+ group will be easing production cuts thus some bearish tendencies may exist through the month. Even though WTI prices have lost considerable ground in August so far, the commodity continues to trade at $67 per barrel not far away from its yearly high price reached in July.
From a technical perspective and considering the latest sessions bearish tendencies the commodity seems eager to test the (S1) 66.60 support that was tested briefly on the 11th of August. If the (S1) is breached then the road can be set for the (S2) 64.95 to come into play. Lower the (S3) 63.50 seems the most considerable stop if the selling is extended even further. In the opposite direction the (R1) 68.60 which was a constant target for the bulls in the previous week remains the most relevant level for a recapture. Higher than that the (R2) 70.10 could confirm the bulls are back in the picture as this is the highest level reached so far in August. Yet our (R3) 71.40 can be the highest target for the bulls also representing a considerable challenge. The RSI indicator below our chart seems to be leaning towards 30 implying further selling could persist among traders.
Monday’s Asian session provides volatility
With the release of several economic readings during Monday’s Asian session, traders were motivated to take notable action that deserves to be mentioned. First, Japanese GDP data outperformed expectations with figures moving in positive territory supporting the JPY. Considering the Japanese Quarterly GDP Annualized data which jumped from previous -3.9% to +1.3% the JPY gained further ground against the USD making it the instrument with the largest movement among major pairs. On the other hand, AUD weakened against the USD as Chinese Industrial Output and Retail sales came out lower than both previous and expected figures. The effect may persist into the European session and even in the US thus caution is advised when trading the pre mentioned FX pairs.
Other economic highlights today and the following Asian session:
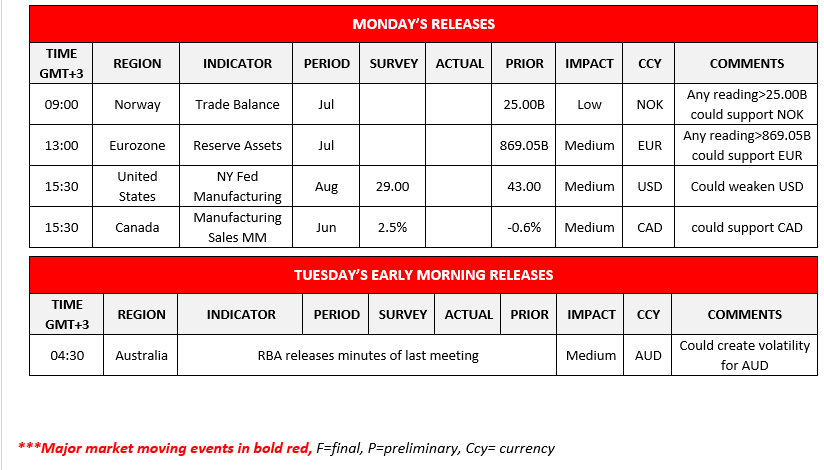
Today during the European session we get Eurozone’s Reserve Assets for July and the Norwegian Trade Balance for July. In the American session we note the release of the preliminary NY Fed Manufacturing figure for August and the Canadian Manufacturing Sales for June. During Tuesday’s Asian session we get RBA releases minutes of last meeting.
USD/JPY H4 Chart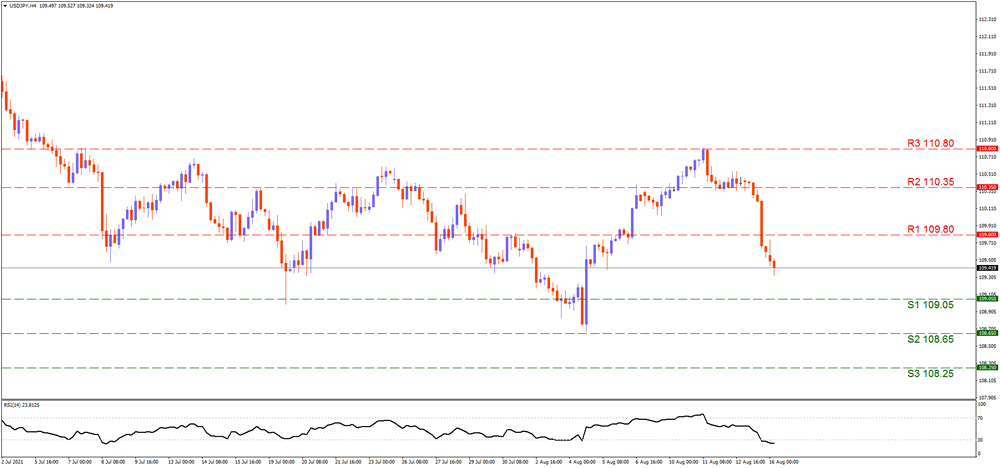
Support: 109.05 (S1), 108.65 (S2), 108.25 (S3)
Resistance: 109.80 (R1), 110.35 (R2), 110.80 (R3)
WTICash H4 Chart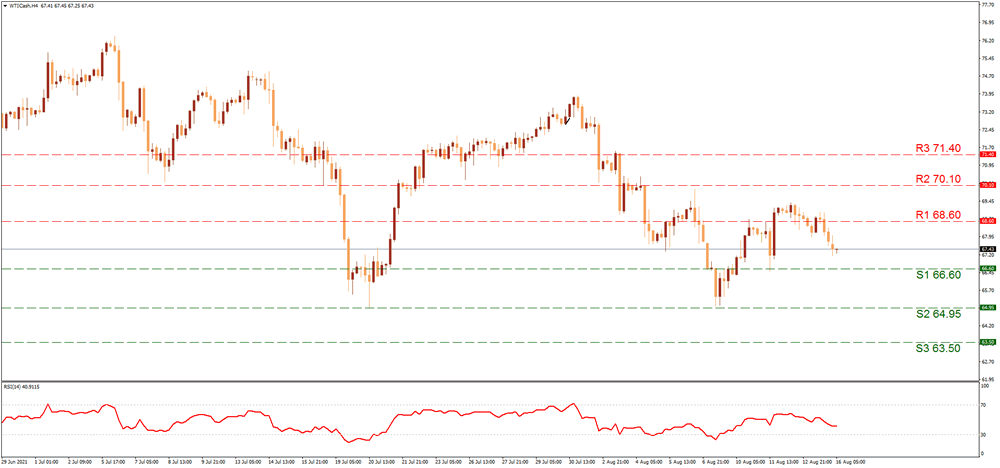
Support: 66.60 (S1), 64.95 (S2), 63.50 (S3)
Resistance: 68.60 (R1), 70.10 (R2), 71.40 (R3)
XAUUSD Is Possibly Bullish
Technical analysis
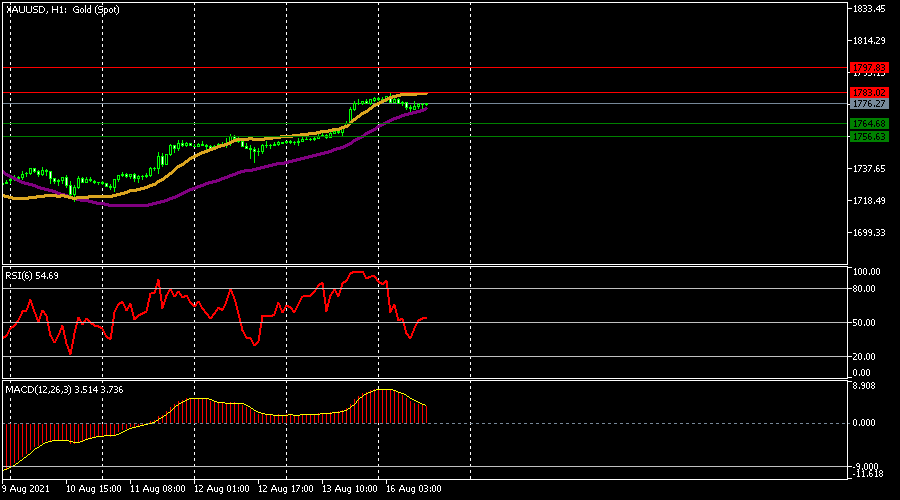
The price lies in between the EMA(50) and the EMA (100), closer to the latter
The MACD indicator line is above 0, pointing down
The RSI is above 50.
What the possible outcomes are
The U.S. dollar edged lower by early Monday. In the absence of any significant news, the technical indicators may push XAUUSD higher today.
If the price passes the initial resistance level of 1,783.02, it could test the next higher at 1,797.83.
Alternatively, if the price reverses, then it could reach the first support level of 1,764.68.
A pass below the first level can move the price up lower toward 1,756.63.
Key levels
Support 1,764.68 1,756.63
Resistance 1,783.02 1,797.83
Poor Chinese Data And COVID-19 Concerns Weigh On Risk Appetite
Notes/Observations
- China registered disappointing economic figures in July have raised the chance of more fiscal and monetary policy support to help cushion the recovery (Note: both production and retail sales data missed consensus).
Asia
- China July Retail Sales missed expectations (YoY: 8.5% v 10.9%e.
- China July Industrial Production missed expectations and registered its slowest growth since Aug 2020 (6.4% v 7.9%e).
- China PBOC offered more medium-term loans (MLFs) than expected to cushion economic slowdown.
- China’s Ningbo-Zhoushan remained partially closed.
- Japan Q2 Preliminary GDP beat expectations and avoids a technical recession (Q0Q: 0.3% v 0.1%e; GDP Annualized QoQ: 1.3% v 0.5%e).
- Japan govt said to consider expanding and extending State of Emergency for Tokyo and surrounding regions, as well as Osaka and Okinawafor about another two weeks (Note: Emergency was set to set to expire at the end of August).
Europe
- UK PM Johnson said to be looking to delay his Cabinet reshuffle until the COP26 climate change summit in November.
- UK Aug Rightmove House Prices registered its first decline of 2021 (M/M: -0.3% v +0.7% prior).
- Moody's affirmed Ireland sovereign rating at A2; Outlook revised to Positive from Stable.
Mid-East
- UN Security Council to meet on Monday, Aug 16th on Afghanistan; Kabul falls to Taliban as president flees country.
Americas
- Fed's Kashkari (dove, non-voter): Want a few more strong jobs reports before taper starts; gal is to let labor market back to at least pre-COVID levels.
- 9 Democrats in the House of Representatives have said no to Speaker Pelosi's procedural compromise.
- Canada Governor General dissolves parliament, triggering an election for Sept 20th (as speculated).
Speakers/Fixed income/FX/Commodities/Erratum
Equities
- Indices [Stoxx600 -0.50% at 473.42, FTSE -0.90% at 7,153.85, DAX -0.49% at 15,900.25, CAC-40 -0.75% at 6,844.57, IBEX-35 -0.54% at 8,951.00, FTSE MIB -0.40% at 26,545.50, SMI -0.52% at 12,399.37, S&P 500 Futures -0.19%].
- Market Focal Points/Key Themes: European indices open lower across the board but moderated some of the losses as the session progressed; geopolitical concerns blamed for loss of risk appetite; better performing sectors include real estate; while sectors leading to the downside include consumer discretionary and energy; Bechtle share split became effective; Ultra Electronics confirms takeover offer from Cobham; Faurecia launches bid for Hella; reportedly German government to sell up to 5% stake in Lufthansa; no major US earnings scheduled for later in the session.
Equities
- Consumer discretionary: Lufthansa [LHA.DE] -4% (govt stake sale).
- Energy: TGS [TGS.NO] -2% (CFO resigns).
- Industrials: Faurecia [EO.FR] +6%, Hella [HLE.DE] -3% (Faurecia to acquire Hella).
- Technology: Ultra Electronics [ULE.UK] +5% (agrees conditions of offer), Future plc [FUTR.UK] +5% (acquisition).
Speakers
- Thailand Central Bank Gov Sethaput stated that the country’s economic recovery to take a long time and be slower compared to peers. Household income affected from virus; outbreak situation is more serious than thought.
- China Foreign Ministry Spokesperson Hua Chunying stated that China to play a constructive role in rebuilding Afghanistan.
Currencies/Fixed Income
- USD was steady near.
- 1-week lows after Friday’s selloff. After key Chinese data came in weaker than expected. Continued concerns over the COVID-19 outbreak also weighed upon risk sentiment further aid USD and JPY-denominated pairs on safe-haven flows. Focus will be on the Feb Aug minutes when released mid-week. Markets will continue to look toward the Fed's central banking conference in Jackson Hole, Wyoming later in Aug for clues to the Fed's next move.
- EUR/USD steady at 1.1790 area during a quiet session.
- GBP/USD at 1.3865 with focus on key data during the week (claimant and wage data Tuesday and inflation data on Wed).
Economic data
- (DK) Denmark Q2 GDP Indicator Q/Q: +2.2 v -1.5% prior.
- (DK) Denmark July PPI M/M: 1.6% v 3.6% prior; Y/Y: 11.8% v 10.1% prior.
- (NO) Norway July Trade Balance (NOK): 42.2B v 24.3B prior.
- (IN) India July Wholesale Prices (WPI) Y/Y: 11.2% v 11.3%e.
- (CZ) Czech July PPI Industrial M/M: 1.6% v 0.7%e; Y/Y: 7.8% v 6.7%e.
- (CH) Swiss weekly Total Sight Deposits (CHF): 714.6B v 713.2B prior; Domestic Sight Deposits: 639.3B v 635.9B prior.
- (TR) Turkey July Central Gov't Budget Balance (HUF): -45.8B v -25.0B prior.
- (IT) Italy Jun General Government Debt: €2.696T v €2.687T prior.
- (IS) Iceland July International Reserves (ISK): 859B v 856B prior.
Fixed income issuance
- None seen.
Looking ahead
- (NG) Nigeria July CPI Y/Y: 17.5%e v 17.8% prior.
- (PE) Peru Jun Economic Activity Index (Monthly GDP) Y/Y: No est v 47.8% prior.
- 05:25 (EU) Daily ECB Liquidity Stats.
- 05:30 ((DE) Germany to sell combined €6.0B in 6-month and 12-month BuBills.
- 05:30 (NL) Netherlands Debt Agency (DSTA) to sell €3.0-5.0B in 3-month and 6-month bills.
- 05:30 (ZA) South Africa announces details of upcoming I/L bond sale (held on Fridays).
- 06:00 (IE) Ireland Jun Trade Balance: No est v €5.0B prior.
- 06:00 (IL) Israel Q2 Advance GDP Annualized: +12.6%e v -5.8% prior.
- 06:00 (RO) Romania to sell RON300M in 5% 2029 Bonds.
- 06:00 (TR) Turkey to sell 2023 and 2026 bonds.
- 06:00 (IL) Israel to sell bonds.
- 06:45 (US) Daily Libor Fixing.
- 07:25 (BR) Brazil Central Bank Weekly Economists Survey.
- 08:00 (PL) Poland July CPI Core M/M: 0.3%e v 0.0% prior; Y/Y: 3.6%e v 3.5% prior.
- 08:00 (UK) Daily Baltic Dry Bulk Index.
- 08:00 (IN) India announces details of upcoming bond sale (held on Fridays).
- 08:00 (ES) Spain Debt Agency (Tesoro) announcement on size of upcoming issuance.
- 08:30 (US) Aug Empire Manufacturing: 28.5e v 43.0 prior.
- 08:30 (CA) Canada Jun Manufacturing Sales M/M: No est v -0.6% prior; Wholesale Trade Sales MM: No est v 0.5% prior.
- 08:30 (UR) Ukraine Q2 Preliminary GDP Q/Q: No est v -1.2% prior; Y/Y: +7.3%e v -2.2% prior.
- 09:00 (FR) France Debt Agency (AFT) to sell €3.8-5.0B in 3-month, 6-month and 12-month bills.
- 09:00 (CA) Canada July Existing Home Sales M/M: No est v -8.4% prior.
- 09:45 (EU) ECB weekly QE bond buying update.
- 09:45 (UK) BOE to buy £1.147B in APF Gilt purchase operation (3-7 years).
- 11:30 (US) Treasury to sell 13-Week and 26-Week Bills.
- 11:00 (PE) Peru July Unemployment Rate: No est v 10.3% prior.
- 16:00 (US) Jun Total Net TIC Flows: No est v $105.3B prior; Net Long-term TIC Flows: No est v -$30.2B prior.
- 16:00 (US) Weekly Crop Progress Report.
- 19:30 (AU) Australia ANZ Roy Morgan Weekly Consumer Confidence Index: No est v 98.6 prior.
- 20:30 (SG) Singapore July Non-oil Domestic Exports M/M: -1.1%e v +6.0% prior; Y/Y: 11.9%e v 15.9% prior; Electronic Exports Y/Y: No est v 25.5% prior.
- 21:30 (AU) RBA Aug Minutes.
- 21:30 (KR) Bank of Korea (BOK) to sell KRW300B in 6-month bills.
- 22:30 (KR) South Korea to sell KRW2.6T in 10-Year Bonds.
- 23:00 (NZ) New Zealand July Non Resident Bond Holdings: No est v 51.1% prior.
- 23:00 (TH) Thailand Central Bank to sell THB60B in bills.
- 23:30 (HK) Hong Kong to sell 3-month, 6-month and 12-month Bills.
The Analytical Overview Of The Main Currency Pairs
The EUR/USD currency pair
Technical indicators of the currency pair:
Prev Open: 1.1729
Prev Close: 1.1795
% chg. over the last day: +0.56%
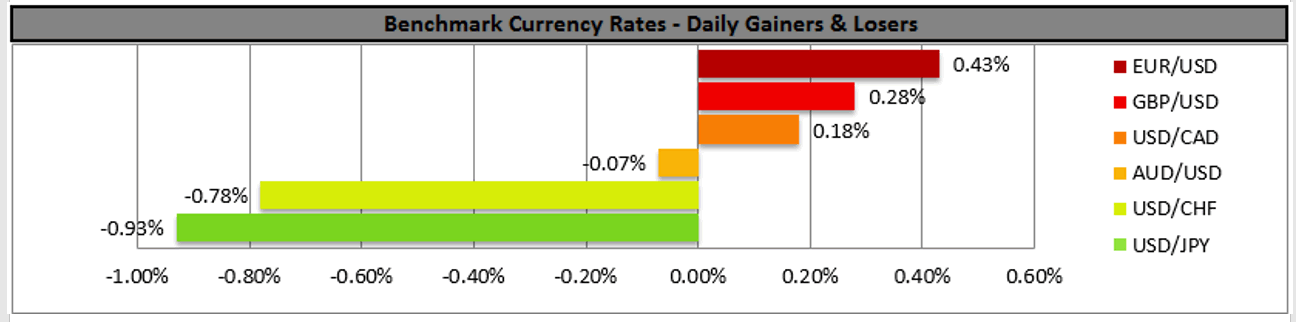
The EUR/USD currency pair increased by 0.56% amid a decline in the dollar index. This week the Eurozone will report on inflation, which data will help forecast the future of the ECB policy. At the moment, the ECB is not going to change its monetary policy.
Trading recommendations
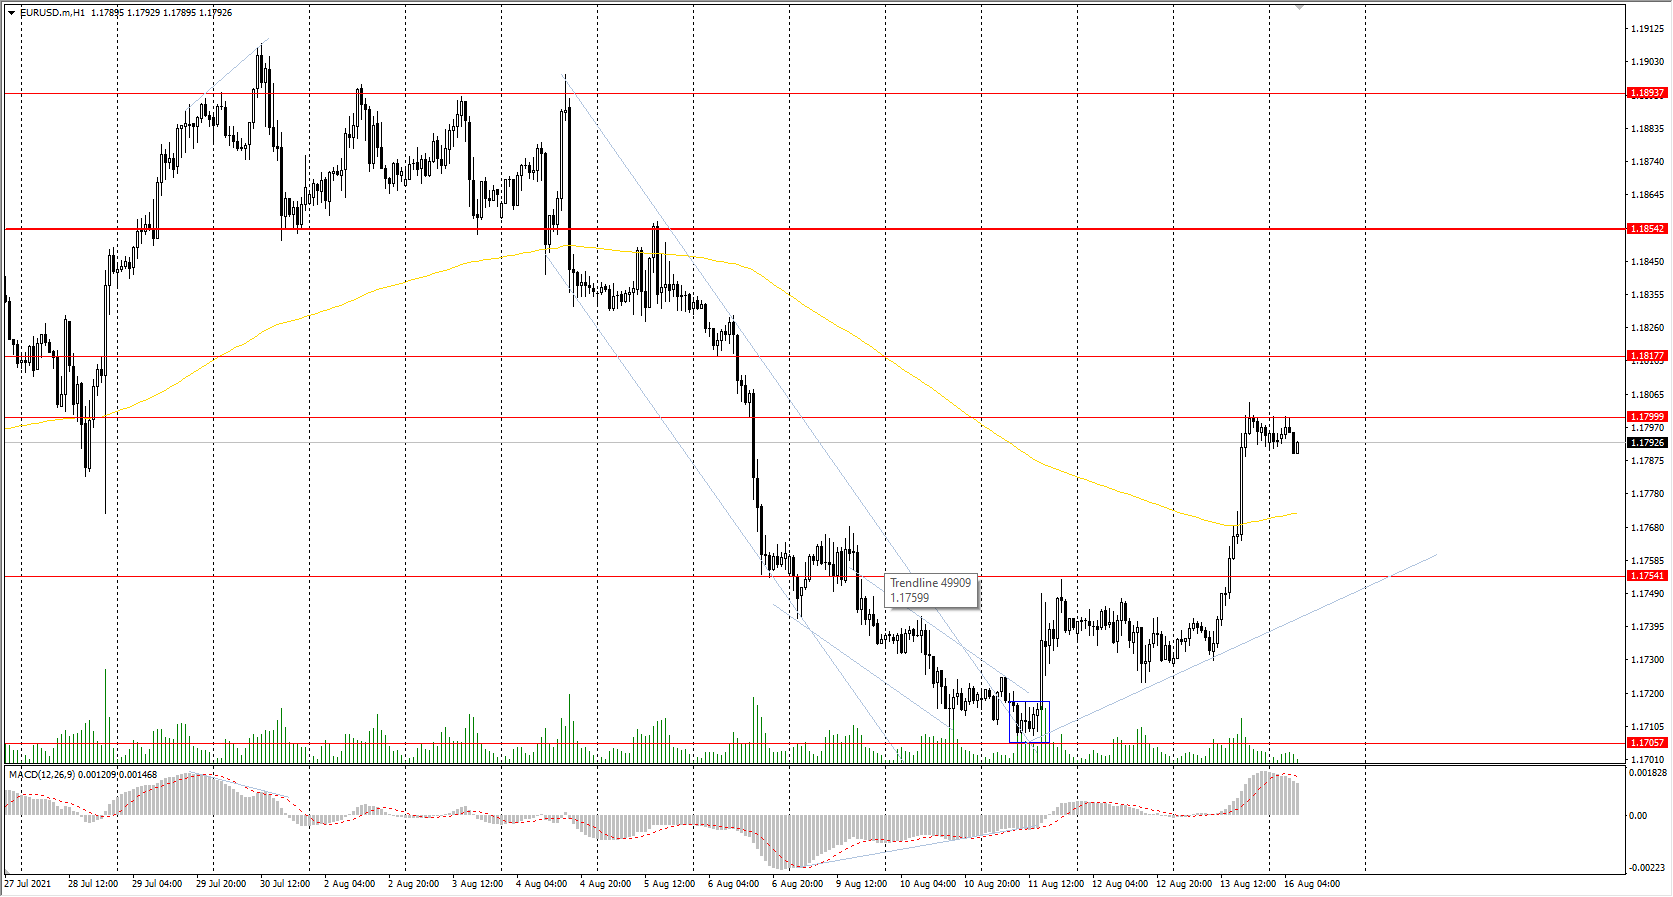
Support levels: 1.1754, 1.1706, 1.1609
Resistance levels: 1.1799, 1.1817, 1.1854, 1.1894, 1.1934, 1.1969
From a technical point of view, the general trend on the EUR/USD currency pair is bearish. On Friday, the price rebounded from the daily support level and started to form a corrective upward movement. The MACD indicator has become positive, and there are no signs of a reversal yet. Under such market conditions, it is better to look for the sell deals from the resistance levels after sellers show initiative. Buy trades can be considered only from the support levels within the local upward movement.
Alternative scenario: if the price breaks through the 1.1854 resistance level and fixes above, the mid-term uptrend will likely resume.
The GBP/USD currency pair
Technical indicators of the currency pair:
Prev Open: 1.3805
Prev Close: 1.3863
% chg. over the last day: +0.42%
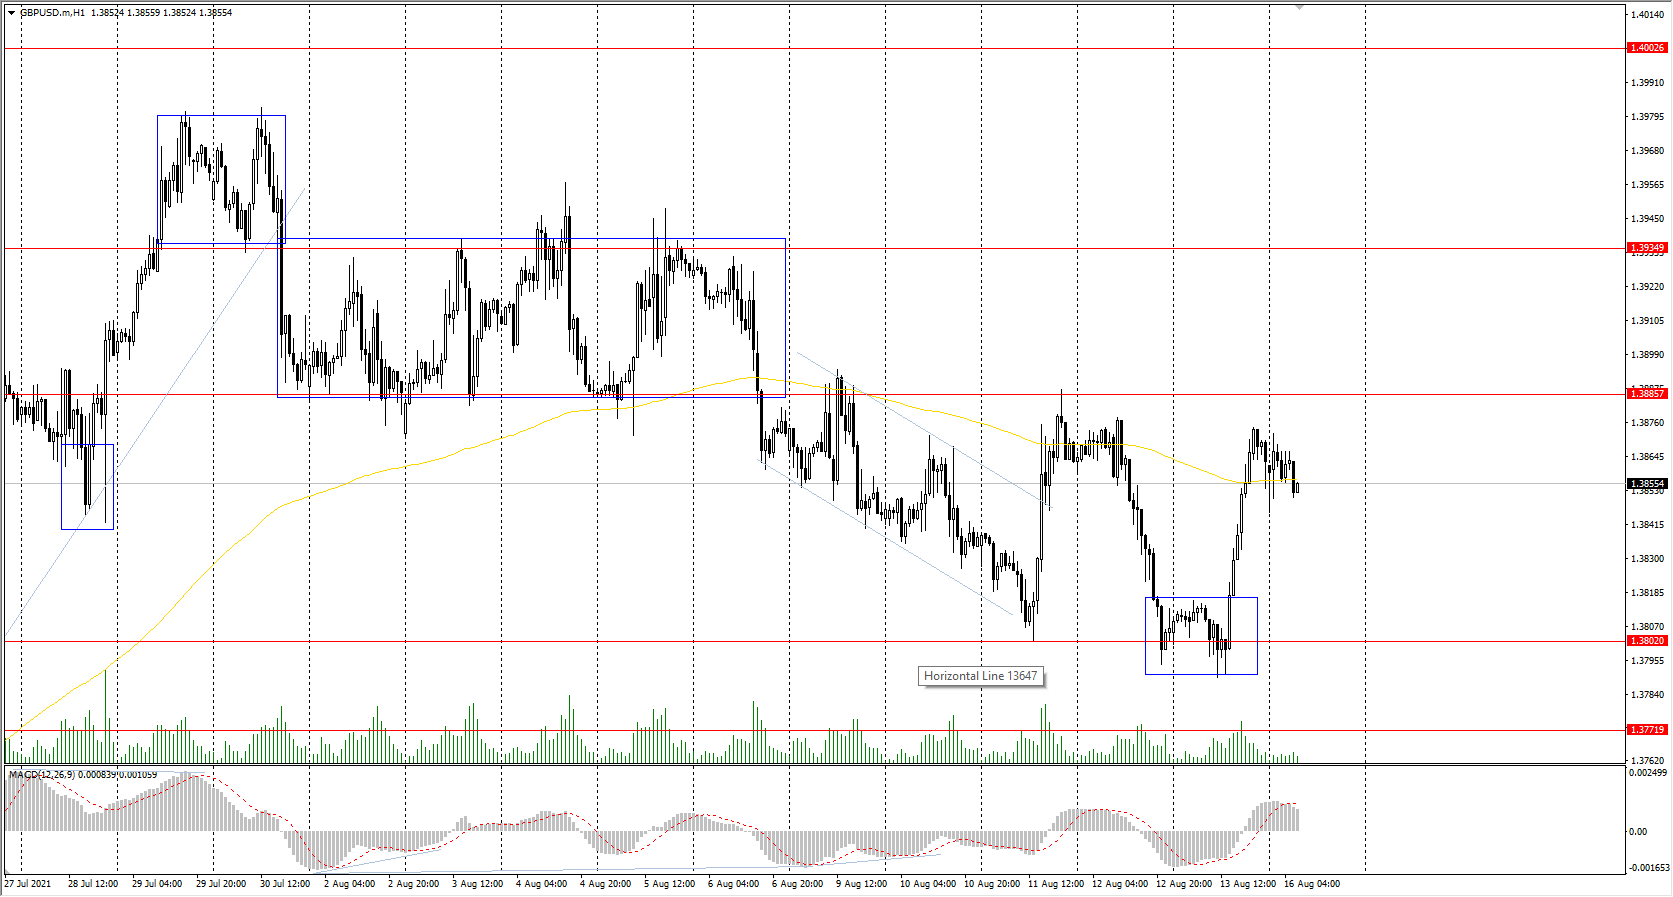
The British pound historically correlates with BRENT crude oil prices, which declined on Friday. But the British pound increased by 0.42%. Therefore, the main reason for the growth was the decrease of the dollar index, but not the strengthening of the pound sterling.
Trading recommendations
Support levels: 1.3802, 1.3772, 1.3714, 1.3676 ,1.3641, 1.3614, 1.3525
Resistance levels: 1.3886, 1.3935, 1.4002, 1.4075, 1.4101
The trend of the GBP/USD currency pair is bullish on the hourly time frame. The price rebounded from the support level, where buyers demonstrated the reaction. The MACD indicator has become positive again. Under such market conditions, traders are better to look for the buy trades from the zone where the buyers show initiative. Sell positions can be considered from the resistance levels and only on intraday time frames.
Alternative scenario: if the price breaks through the 1.3714 support level and consolidates below, the bearish scenario is likely to resume.
The USD/JPY currency pair
Technical indicators of the currency pair:
Prev Open: 110.35
Prev Close: 109.59
% chg. over the last day: -0.69%
The world's third-largest economy increased by 1.3% on a year-on-year basis. In Japan, industrial production increased by 0.3% over the last month. But the recovery is much weaker than with other advanced economies. Many analysts expect the growth to remain modest this quarter as the imposition of a state of emergency to combat a spike in infection will negatively impact business activity.
Trading recommendations
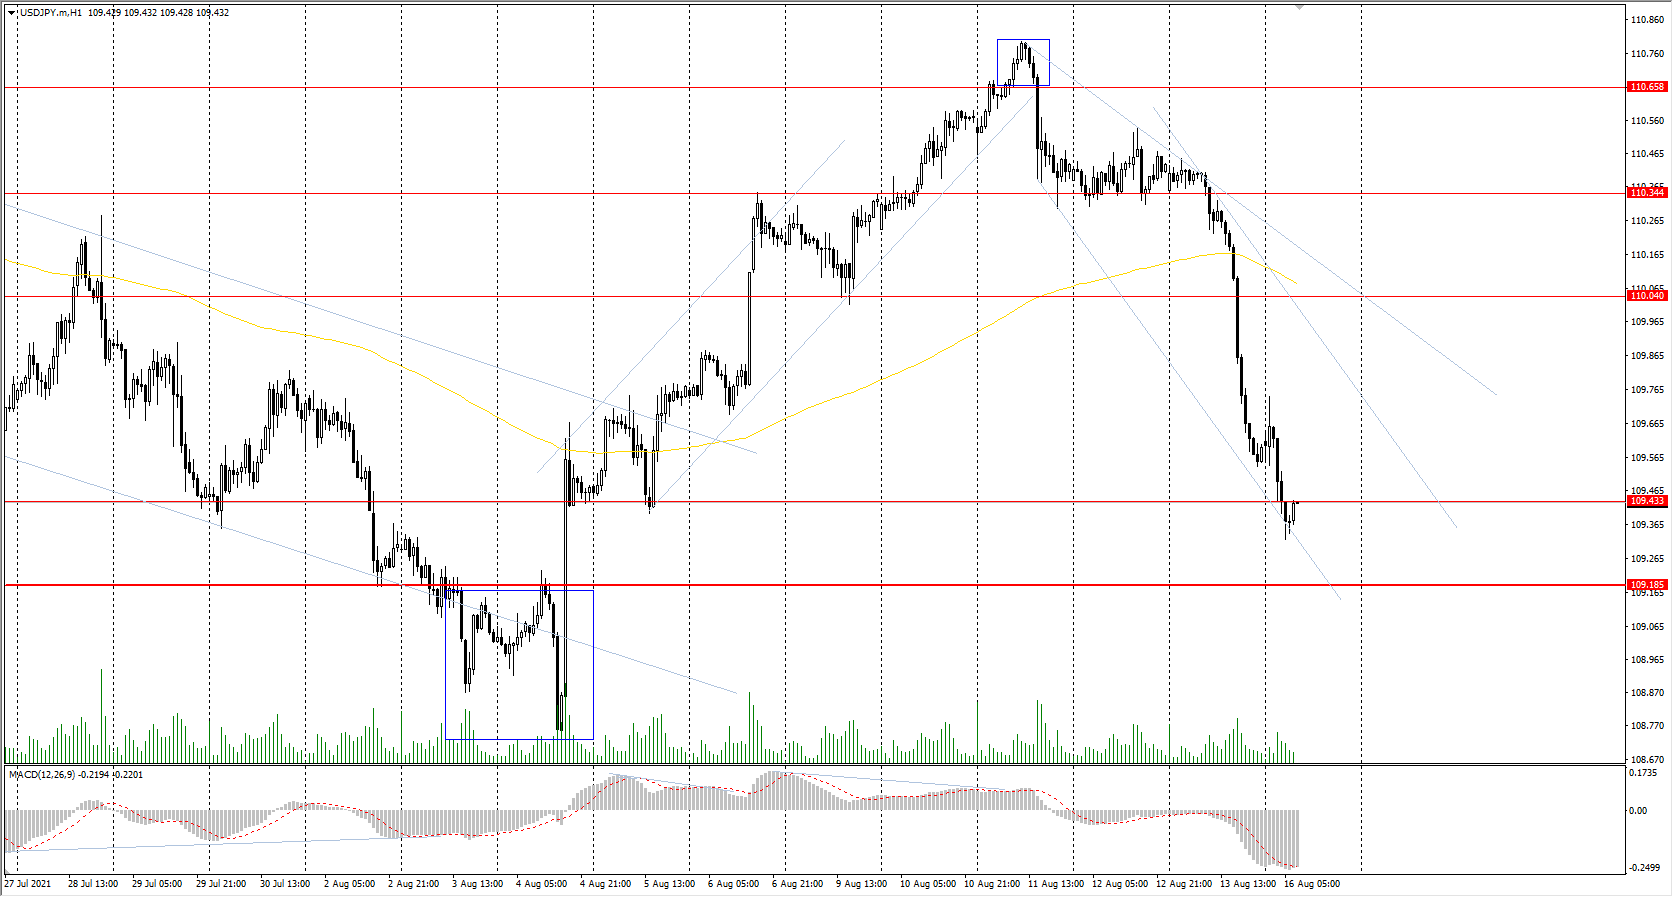
Support levels: 109.43, 109.19, 108.65
Resistance levels: 110.04, 110.34, 110.66, 110.95, 111.48
The main trend on the USD/JPY currency pair is bullish. But the price sharply fell below the moving average on Friday and is close to breakthrough the priority change level. The MACD indicator became negative, with no signs of a reversal. Under such market conditions, it is better to look for buy positions from the support level near the priority change level. Sell positions should be considered only on the lower time frames from the zone where the sellers show initiative.
Alternative scenario: if the price falls below 109.19, the uptrend is likely to be broken.
News feed for 2021.08.16:
- Japan GDP (q/q) at 02:50 (GMT+3);
- Japan Industrial Production (m/m) at 07:30 (GMT+3).
The USD/CAD currency pair
Technical indicators of the currency pair:
Prev Open: 1.2521
Prev Close: 1.2512
% chg. over the last day: -0.07%
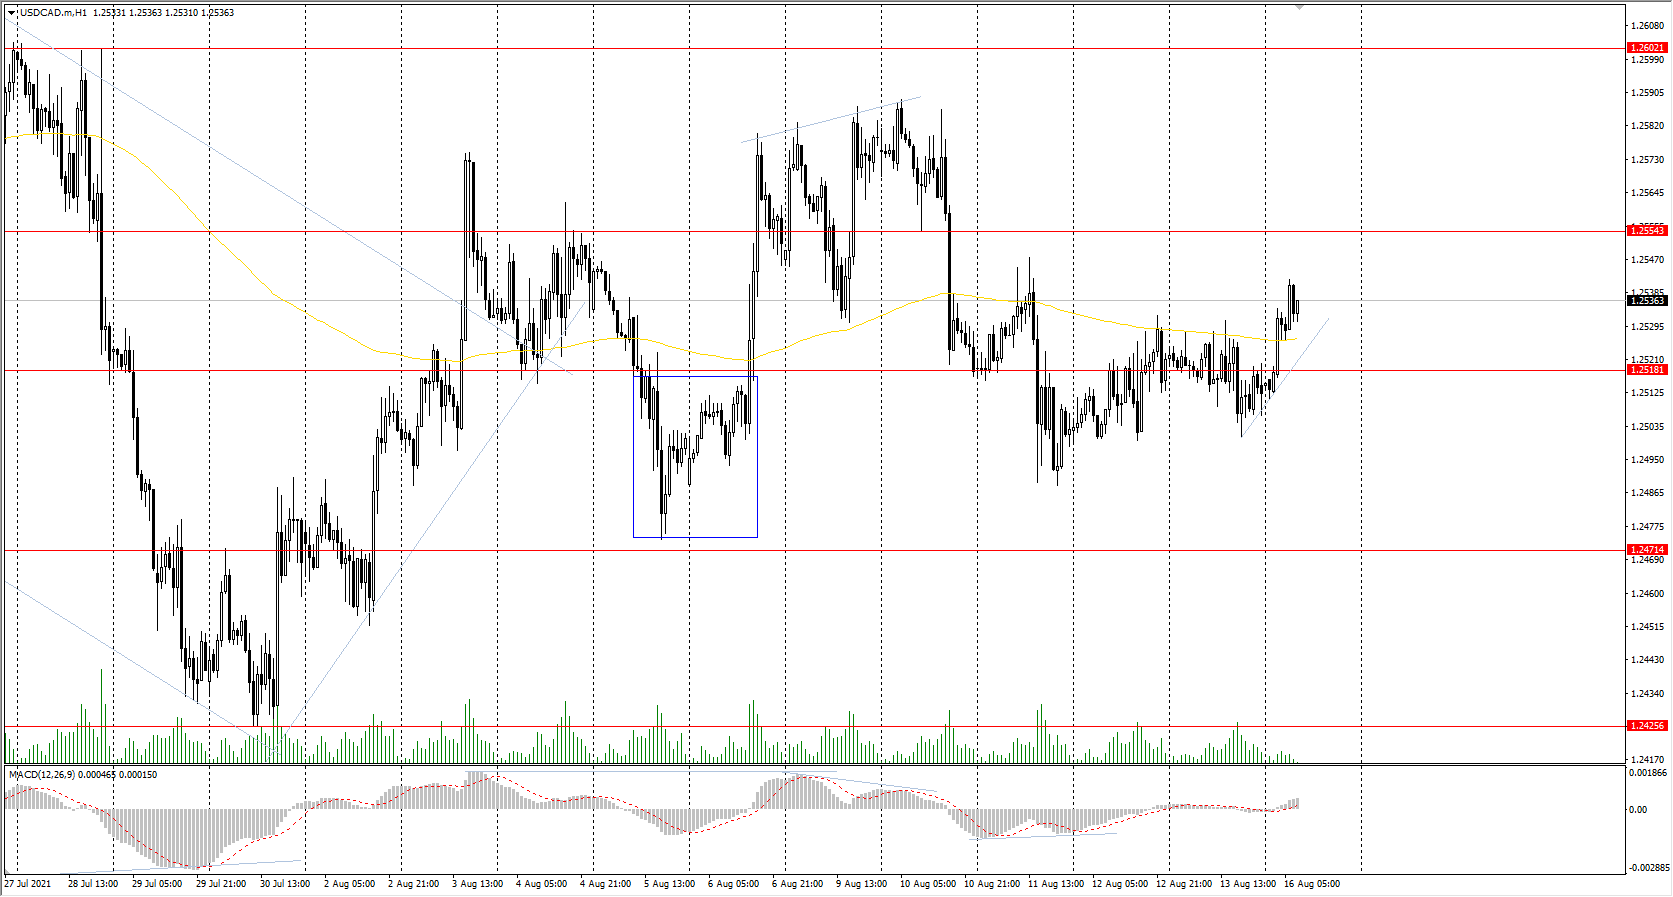
The Canadian dollar is highly dependent on the performance of the dollar index and oil price performance. Both the dollar index and oil declined on Friday. As a result, the price of USD/CAD remained in a narrow price range.
Trading recommendations
Support levels: 1.2518, 1.2471, 1.2425, 1.2370, 1.2312
Resistance levels: 1.2554, 1.2602, 1.2671, 1.2787, 1.2951
Considering technical analysis, the USD/CAD trend is bearish. The price is trading near the moving average, and the MACD indicator has crossed the zero line and is growing, indicating buyers’ pressure. Under such market conditions, it is better to look for the sell positions from the resistance levels. Buy positions should be considered from the support levels on intraday timeframes within the local upward movement.
Alternative scenario: if the price breaks through the 1.2671 resistance level and fixes above, the uptrend is likely to be resumed.
Good Corporate Reporting Season In The US And Europe Compensates For The Spread Of The Delta Strain
Last week on Friday, the University of Michigan released its Consumer Confidence Index. The index decreased from 81.2 to 70.2, indicating growing fears about the dynamics of the economic recovery. As a result, the dollar index fell sharply. However, the US stock market ended Friday's trading higher due to strengthening health care, utilities, and telecommunications sectors. The Dow Jones increased by 0.04% to a historic high, the S&P 500 added 0.16%, and the NASDAQ increased by 0.04%. The gainers among the S&P 500 index companies were the eBay shares (+7.45%), which reached its historical maximum, as well as AMD (+3.80%). The number of securities that fell in price (1760) exceeded the number of securities, which closed on the rise (1467). By the end of the week, the Dow Jones increased by 0.9%, the S&P 500 jumped by 0.7%, while the Nasdaq decreased by 0.1%. The tech sector is still under pressure due to the Biden administration's intentions to raise taxes on tech giants. This week investors will monitor the FOMC minutes as well as the speech of the Fed chair Jerome Powell.
On Friday, European stock indices closed in the green zone on the back of good corporate reports. By the end of the week, the Stoxx Europe 600 composite index jumped by 1.25%, the British FTSE 100 added 1.3%, the German DAX increased by 1.4%, the French CAC 40 gained 1.2%, the Spanish IBEX 35 added 1.4%, and the Italian FTSE MIB increased by 0.4%. Corporate financial results for the second quarter of 2021 give hope for a quick recovery in European economies and offset concerns about the spread of the Delta strain. This week, Eurozone will report on inflation, a good indicator for predicting future ECB policy. For now, the ECB is keeping its monetary policy soft and is not going to change it.
Oil prices dropped on Friday and continued to decline on Monday as the rapid spread of a Delta strain began to have a negative impact on the Chinese economy. There is an increase in the activity of shale companies in the US. The number of existing oil drilling rigs in the United States increased by 10 units last week.
Gold increased on Friday as the dollar index declined and the US Treasury yields fell. As long as the Fed keeps its monetary policy soft, gold and silver prices will rise slowly. But any rumors about the possible reduction of the QE program will cause a wave of sales.
The Asian stock market is still under pressure. In China, the growth of industrial production and retail sales slowed in July, indicating the negative impact of the Delta strain on business activity. In countries such as Thailand, Vietnam, and the Philippines, the number of new coronavirus cases is near record levels. Japan's GDP increased by 0.3% q/q, and industrial production increased by 0.3% in the last month. But the recovery is much weaker than in other advanced economies. Many analysts expect growth to remain modest in the current quarter, and there could be a slowdown in the third quarter because of the Olympic games.
Main market quotes:
- S&P 500 (F) 4,468.00 +7.17 (+0.16%)
- Dow Jones 35,515.38 +15.53 (+0.04%)
- DAX 15,977.44 +39.93 (+0.25%)
- FTSE 100 7,218.71 +25.48 (+0.35%)
- USD Index 92.52 -0.51 (-0.55%)
Important events for today:
- Japan GDP (q/q) at 02:50 (GMT+3);
- China Industrial Production (m/m) at 05:00 (GMT+3);
- Japan Industrial Production (m/m) at 07:30 (GMT+3).
Dollar Takes Some Damage After Soft Data, Gold Smiles
- US dollar retreats after soft consumer sentiment survey
- Chinese data disappoints too, hitting risk sentiment in Asia
- Gold comes back to life, oil ignores Afghanistan tensions
Dollar grapples with consumer uncertainty
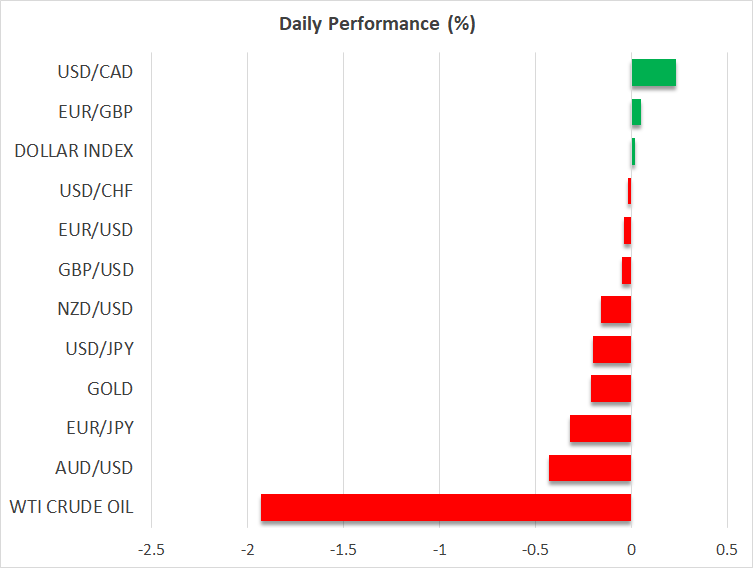
Currency markets closed with a bang last week after an American survey showed consumer sentiment cratering in August to reach its lowest level in a decade. The stunning loss in consumer confidence raised questions about the economy’s fortunes, and consequently about whether the Fed will be able to take its foot off the accelerator soon.
That dealt a heavy blow to the greenback, which fell in tandem with US Treasury yields. Capitalizing the most on the dollar’s troubles was the Japanese yen, which is very sensitive to changes in interest rate differentials and shines whenever foreign yields fall.
The question now is whether this foreshadows a sharp cooldown in consumer spending that hammers growth, or whether it is just survey ‘noise’ that won't really translate into hard data. As such, this elevates the importance of tomorrow’s edition of US retail sales, which will provide the next clue in this debate.
For now, this isn’t enough to derail the grand narrative that the Fed will dial back its asset purchases soon. The US economy is firing on most cylinders and Congress is working on another multi-trillion spending package. Whether tapering is announced in September or November ultimately doesn’t matter much. What matters for the dollar is that the Fed is years ahead of the ECB and the BoJ in the normalization game.
China slows down, sapping sentiment
The Chinese economy is losing momentum. Industrial production, retail sales, and fixed asset investment all slowed very sharply in July as fresh virus restrictions and extreme weather events came together to suppress growth.
The disappointing report took the wind out of riskier assets early on Monday. Stock markets in Asia and Europe were a sea of red, although the losses were not very dramatic and there wasn’t any sense of panic. Wall Street didn’t escape unscathed either, with futures pointing to a slightly negative open today.
In the FX arena, it was the Australian dollar that got hit the hardest. The past few weeks have been a perfect storm for the aussie, which had to suffer strict domestic lockdowns to battle the Delta variant as iron ore prices crumbled and China started to slow down.
Oil focuses on China, gold breathes again
The debacle in Afghanistan has attracted a lot of attention lately but there has been no visible market impact. Oil prices are instead trading lower on Monday as fears around a slowdown in Asian demand overpowered hopes for supply disruptions in case the instability in Afghanistan spreads beyond its borders.
It’s not just China either. Japanese growth data just showed that the world’s third-largest economy had a solid second quarter and avoided a double-dip recession, but that optimism was quickly tempered by soaring covid infections. This wave has been Japan’s biggest by far, raising the chances for even tighter social restrictions.
Meanwhile, gold prices have staged a heroic comeback lately. The yellow metal erased the ‘mini flash crash’ to close higher overall last week, drawing power from the sudden retreat in the dollar and real yields. That’s quite impressive as it shows that dip buyers are still there, just waiting for more attractive prices.
The bull case for gold is that Congress is about to unleash more fiscal firepower and the Delta outbreak could delay the Fed from normalizing. That said, the bear case looks even stronger. Real rates are just a shade away from record lows and yet gold hasn’t been able to shine much. If real yields recover alongside the dollar as the Fed moves to taper, emboldened by more fiscal spending, it could get ugly for bullion.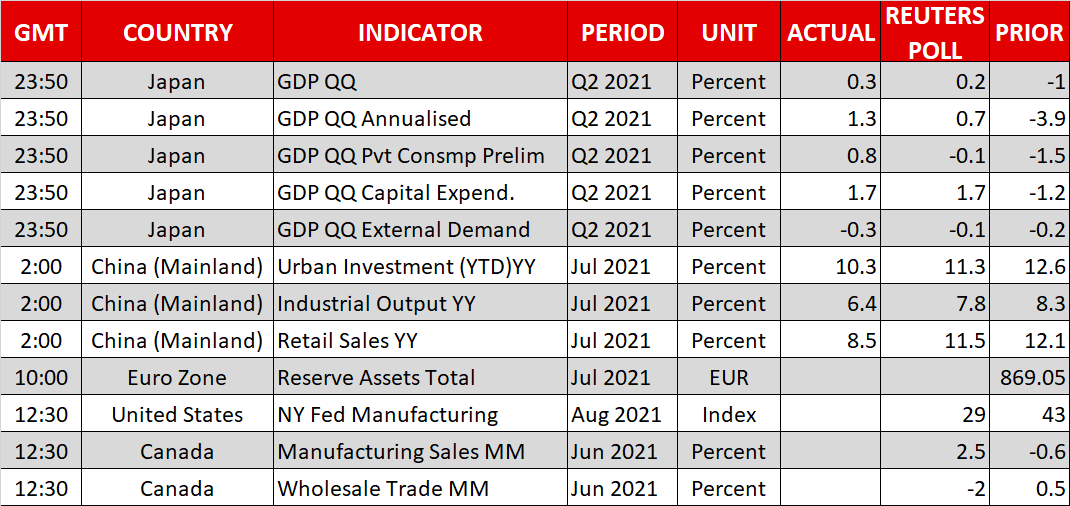
Gold Heads South After Rebound Off 4-Month Low
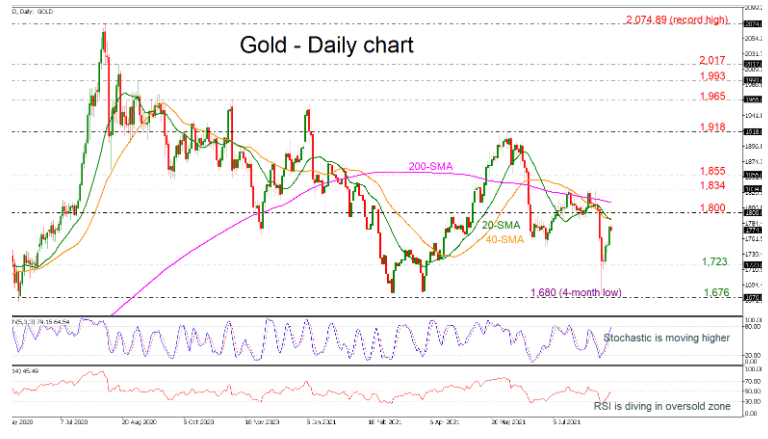
Gold prices are easing after the strong bounce off the four-month low of 1,680 in the preceding week, driving the market near 1,780. The stochastic oscillator is approaching the overbought territory, while the RSI is ticking marginally down around the neutral threshold of 50.
If the buying interest persists, immediate resistance could come from the 20- and 40-day simple moving averages (SMAs) at 1,790 before touching the key level of 1,800. Slightly above this hurdle, the 200-day SMA at 1,814 may halt the bullish actions before meeting the 1,834 resistance. Even higher, the 1,855 inside swing low from June 4 and the 1,918 high from June 1 could attract traders’ attention.
In the negative scenario, a drop lower could head the price south towards the 1,723 support before resting near the four-month low of 1,680 and the 1,676 barrier, reached on March 8.
To sum up, the yellow metal is trying to gain some ground despite today’s bearish open. In the broader outlook, the market is lacking a clear direction.