

Sample Category Title
GBP/USD Mid-Day Outlook
Daily Pivots: (S1) 1.3816; (P) 1.3846; (R1) 1.3899; More...
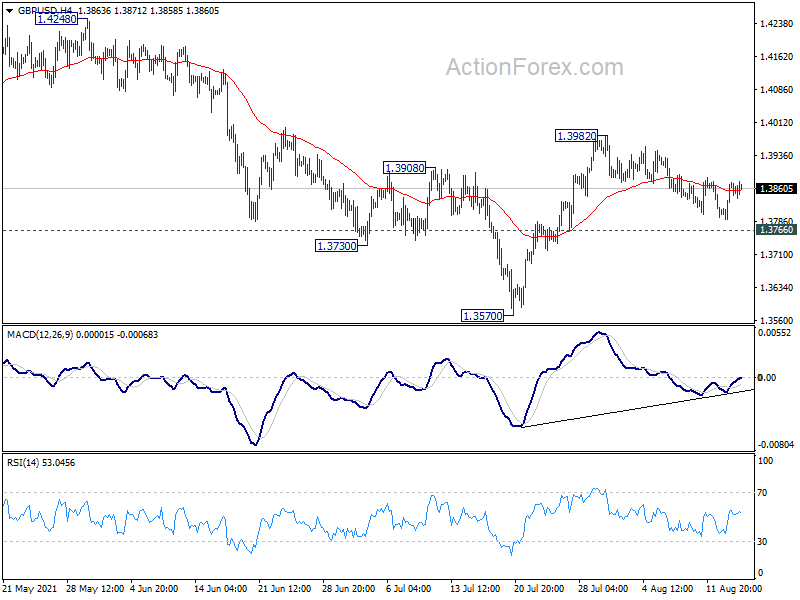
GBP/USD is still extending the consolidation from 1.3982 and intraday bias remains neutral first. Outlook is unchanged that corrective pattern from 1.4240 could have completed with three waves down to 1.3570. On the upside, break of 1.3982 will resume the rise from 1.3570 to retest 1.4248 high. However, break of 1.3766 support will dampen this bullish view and bring retest of 1.3570.
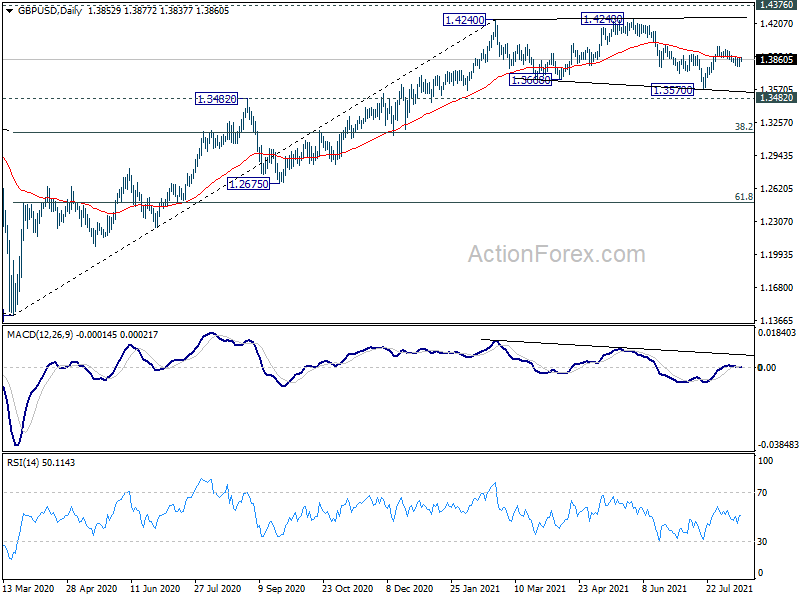
In the bigger picture, as long as 1.3482 resistance turned support holds, up trend from 1.1409 should still continue. Decisive break of 1.4376 resistance will carry larger bullish implications. However, firm break of 1.3482 support will argue that the rise from 1.1409 has completed. GBP/USD would then be seen in another leg of long term range pattern between 1.1409 and 1.4376. Deeper fall could then be seen to 61.8% retracement of 1.1409 to 1.4248 at 1.2493, and even below.
USD/CHF Mid-Day Outlook
Daily Pivots: (S1) 0.9123; (P) 0.9181; (R1) 0.9211; More....
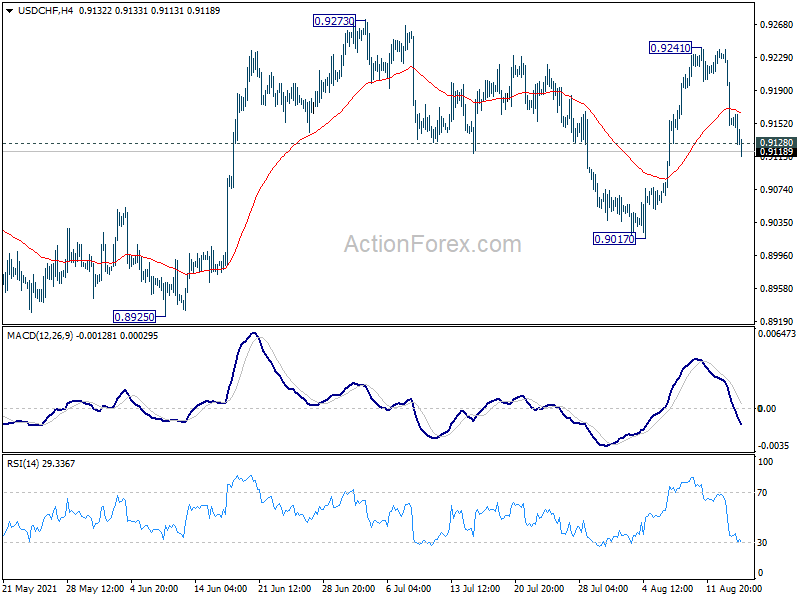
USD/CHF's break of 0.9128 minor support suggests that rebound form 0.9017 has completed at 0.9241 already. Intraday bias is back on the downside for 0.9017 support. Break there will likely resume the decline form 0.9471 through 0.8925 low. For now, risk will stay mildly on the downside as long as 0.9241 resistance holds, in case of recovery.
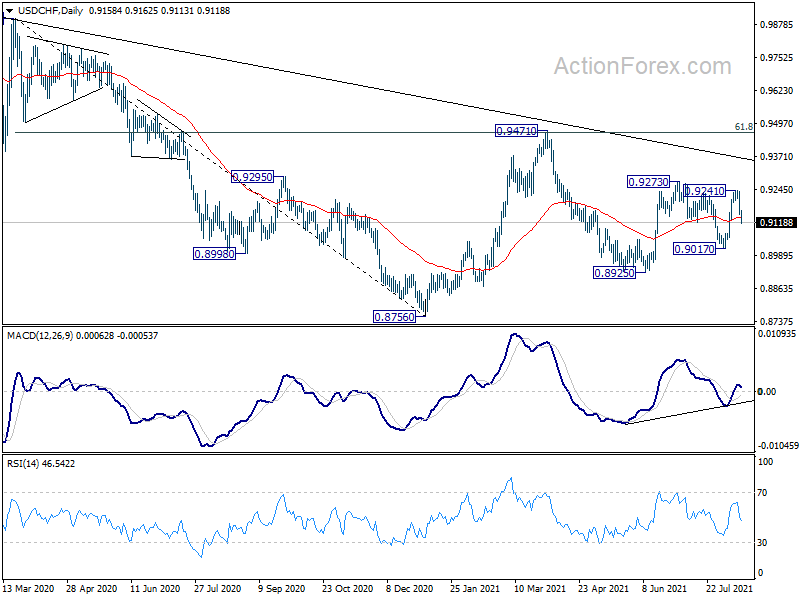
In the bigger picture, the failure to sustain above 55 week EMA (now at 0.9184) retains medium term bearish in USD/CHF. Break of 0.8925 support should resume the whole decline form 1.0342 (2016 high) through 0.8756 low. However, break of 0.9273 resistance and sustained trading above 55 week EMA will be an early sign of bullish trend reversal. Focus will then turn to 0.9471 resistance for confirmation.
USD/JPY Mid-Day Outlook
Daily Pivots: (S1) 109.28; (P) 109.87; (R1) 110.19; More...
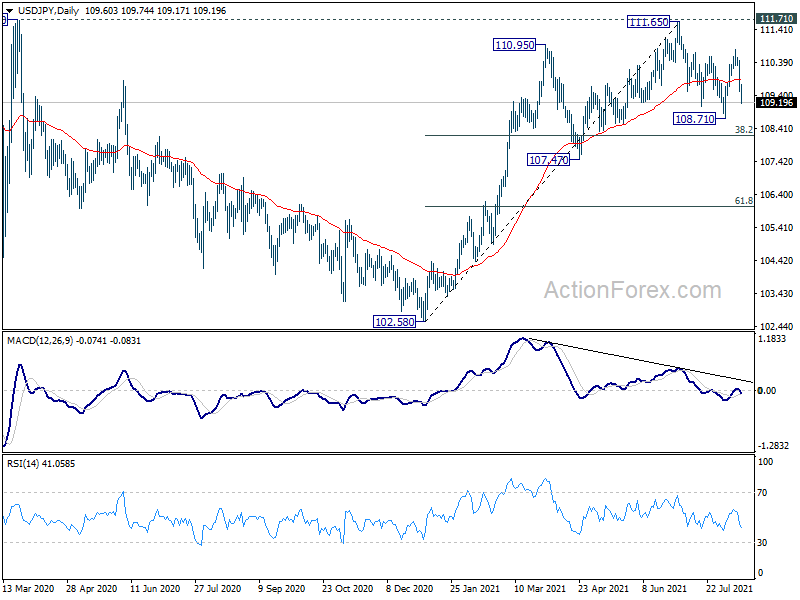
Intraday bias in USD/JPY stays on the downside for 108.71 support. Firm break there will will resume the decline from 111.65 and target 38.2% retracement of 102.58 to 111.65 at 108.18 next. On the upside, above 109.74 minor resistance will turn intraday bias neutral first. But risk will stay mildly on the downside as long as 110.79 resistance holds.
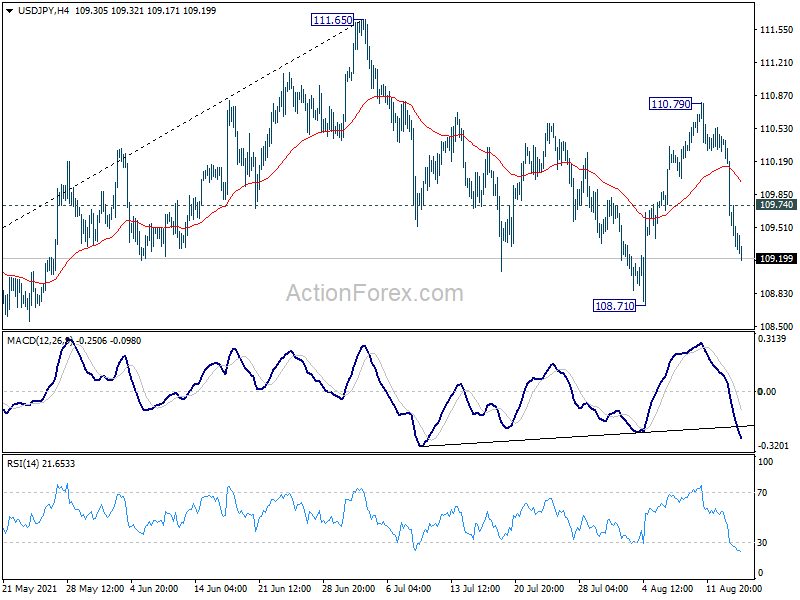
In the bigger picture, medium term outlook is staying neutral with 111.71 resistance intact. The pattern from 101.18 could still extend with another falling leg. Sustained trading below 55 day EMA will bring deeper fall to 107.47 support and below. Nevertheless, strong break of 111.71 resistance will confirm completion of the corrective decline from 118.65 (2016 high). Further rise should then be seen to 114.54 and then 118.65 resistance.
Canada’s Manufacturing Sales Pick Up in June as Auto Production Slowly Recovers
- Canada's manufacturing sales grew 2.1% (m/m) in June, slightly above Statistics Canada's flash estimate for a 1.9% increase. The picture was similar after accounting for price effects, with manufacturing shipment volumes up 2.2% on the month.
- The increase in manufacturing shipments was predominantly led by the motor vehicles industry, where sales increased 25.6% on the month. Sales of petroleum and coal products (+5.2%) and aerospace products and parts (+21.7%) were also notably strong. A decline in wood product sales (-5.7%) provided some offset.
- Forward looking indicators were positive, with new orders up 11.1% and unfilled orders up 1.4%. Inventories increased 1.9%, but higher sales kept the inventory-to-sales ratio unchanged at 1.56.
Key Implications
- After an unusually weak May report, Canada's manufacturing sales showed some signs of life in June. However, while output in the auto industry has partially recovered, production levels remain low as a result of the global shortage in semiconductor chips. Recent reports from auto manufacturers suggest that we aren't out of the woods yet, with some citing that shortages may continue to cloud the outlook into next year.
- Looking ahead, the macro backdrop remains supportive for the manufacturing sector, with near-term indicators pointing to continued expansion. New orders posted a solid increase in June, and manufacturing sentiment remains firmly in expansion territory, as evidenced by recent PMI readings. Meanwhile, hours worked in the sector recorded a decent increase in July. Importantly, the strong economic performance in Canada's largest trading partner (the U.S.) bodes well for the sector.
Swiss Franc and Yen Rise as Markets Turn to Risk-Off Mode
Risk aversion is a main theme today, on situation in Afghanistan, poor China data, and spread of Delta virus. Yen and Swiss Franc rise broadly, and to a lesser extent followed by Dollar. Commodity currencies are all in red, in particular with Aussie pressured by increasing pandemic restrictions. On the other hand, Euro and Sterling and mixed for the moment, awaiting the next move.
Technically, EUR/CHF's break of 1.0788 minor support suggests that rebound from 1.0715 has completed much earlier than expected. EUR/JPY is eyeing 128.85 support and break will resume the fall from 134.11. EUR/GBP's recovery also lost momentum after hitting 0.8516. the question now is whether recovery in EUR/USD would be cut short but selling in Euro in crosses.
In Europe, at the time of writing, FTSE is down -1.22%. DAX is down -0.48%. CAC is down -0.85%. Germany 10-year yield is up 0.005 at -0.459. Earlier in Asia, Nikkei dropped -1.62%. Hong Kong HSI dropped -0.80%. China Shanghai SSE rose 0.03%. Singapore Strait Times dropped -0.63%. Japan 10-year JGB yield dropped -0.0077 to 0.017.
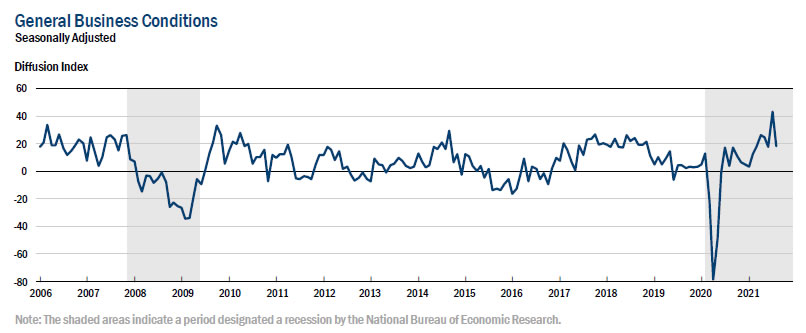
US Empire state manufacturing dropped sharply to 18.3
In the August Empire State Manufacturing Survey, the headline general business conditions index dropped sharply from 43.0 to 18.3, even worse than expectation of 28.9. New York Fed said manufacturing activity continued to increase the the New York state, but growth was much slower. Index of future business conditions, on the other hand, rose from 39.5, pointing to ongoing optimism about future conditions.
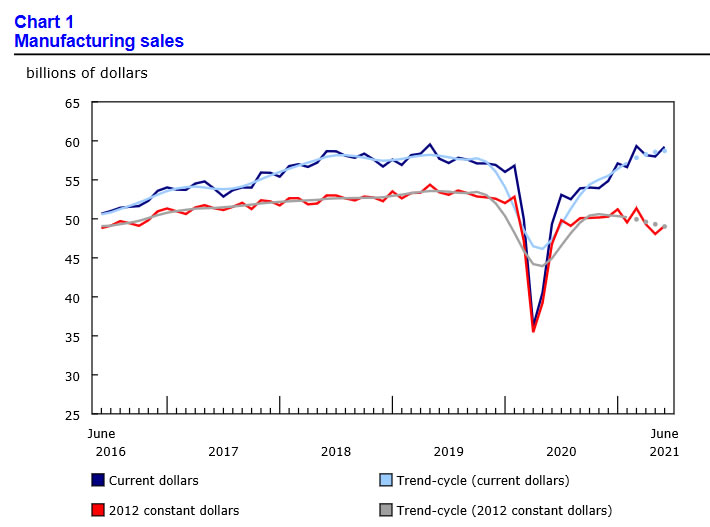
Canada manufacturing sales rose 2.1% mom in June, led by auto assembly
Canada manufacturing sales rose 2.1% mom to CAD 59.2B in June, slightly above expectation of 2.0% mom. Sales rose in 13 of 21 industries, with most of the increase attributable to improved production at auto assembly plants and higher sales of petroleum and coal products. On the other hand, wood product sales posted the largest decline.
China industrial production, retail sales, investment missed expectations
Industrial production rose 6.4% yoy in July, below expectation of 7.8% yoy. Retail sales rose 8.5% yoy, below expectation of 11.5% yoy. Fixed asset investment grew 10.3% ytd yoy, below expectation of 11.3% ytd yoy.
"Given the combined impact of sporadic local outbreaks of Covid-19 and natural disasters on the economy of some regions, the economic recovery is still unstable and uneven," said NBS. "We should not only look at the growth to analyze the economic situation, but also need to look at the overall picture of employment, prices and residential incomes."
Japan GDP grew 0.3% qoq, 1.3% annualized in Q2
Japan GDP grew 0.3% qoq in Q2, above expectation of 0.2% qoq. The economy was back in growth after -1.0% qoq contraction in Q1. In annualized term, GDP grew 1.3%, above expectation of 0.7%.
Looking at some details, external demand contracted -0.3% qoq, versus expectation of -0.1% qoq. Capital expenditure rose 1.7% qoq, matched expectations. Private consumption grew 0.8% qoq, much better than expectation of -1.0% qoq. Price index dropped -0.7% yoy, worse than expectation of -0.4% yoy.
EUR/CHF Mid-Day Outlook
Daily Pivots: (S1) 1.0782; (P) 1.0811; (R1) 1.0827; More....
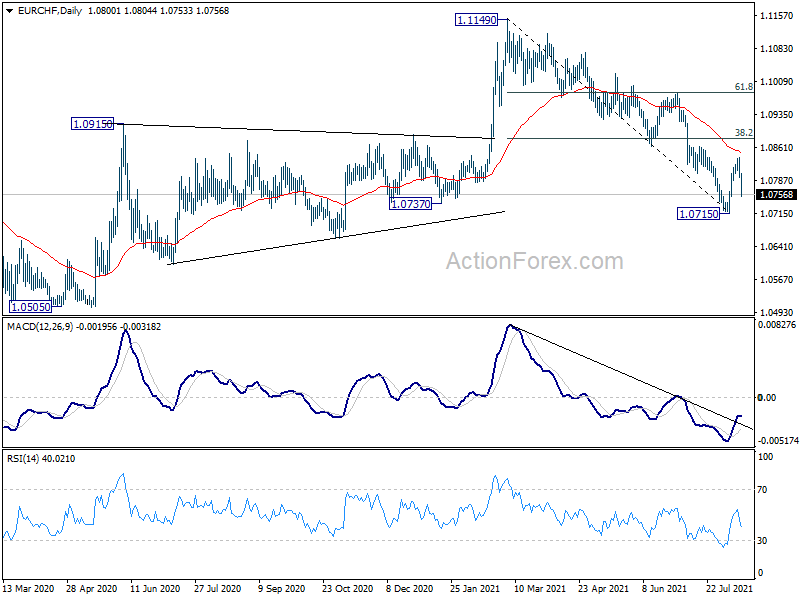
EUR/CHF's sharp fall and break of 1.0788 minor support suggests that rebound from 1.0715 has completed earlier than expected at 1.0839. Failure below 55 day EMA retains near term bearishness too. Intraday bias is back on the downside for retesting 1.0715 first. Break will resume whole decline from 1.1149, towards 1.0505 low. On the upside, above 1.0839 will resume the rebound to 38.2% retracement of 1.1149 to 1.0715 at 1.0881.
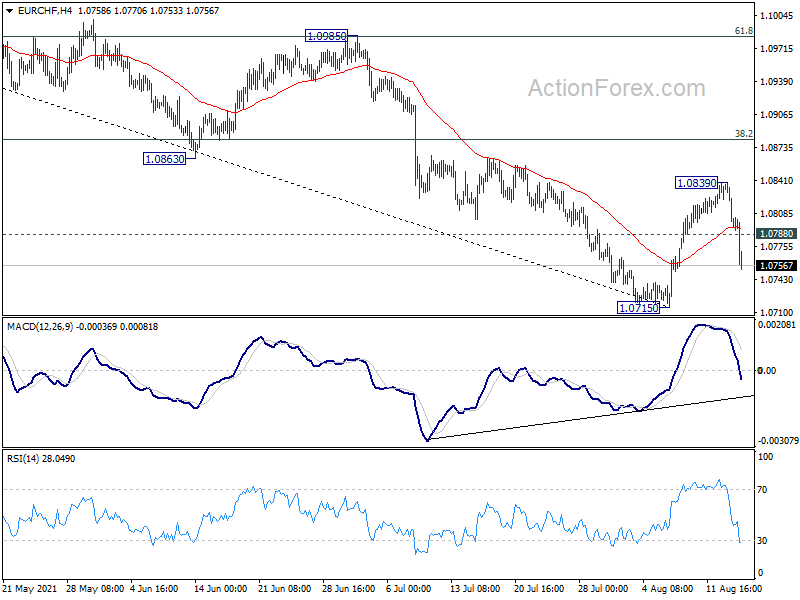
In the bigger picture, rebound from 1.0505 (2020 low) should have completed at 1.1149 already. The three-wave corrective structure argues that the downtrend from 1.2004 (2018 high) is not over yet. Medium term outlook will now stay bearish as long as 55 week EMA (now at 1.0865) holds. Break of 1.0505 low would be seen at a later stage.
Economic Indicators Update
| GMT | Ccy | Events | Actual | Forecast | Previous | Revised |
|---|---|---|---|---|---|---|
| 23:01 | GBP | Rightmove House Price Index M/M Aug | -0.30% | 0.70% | ||
| 23:50 | JPY | GDP Q/Q Q2 P | 0.30% | 0.20% | -1.00% | |
| 23:50 | JPY | GDP Deflator Y/Y Q2 P | -0.70% | -0.40% | -0.10% | |
| 02:00 | CNY | Retail Sales Y/Y Jul | 8.50% | 11.50% | 12.10% | |
| 02:00 | CNY | Industrial Production Y/Y Jul | 6.40% | 7.80% | 8.30% | |
| 02:00 | CNY | Fixed Asset Investment YTD Y/Y Jul | 10.30% | 11.30% | 12.60% | |
| 04:30 | JPY | Industrial Production M/M Jun F | 6.50% | 6.20% | 6.20% | |
| 12:30 | USD | Empire State Manufacturing Index Aug | 18.3 | 28.9 | 43 | |
| 12:30 | CAD | Manufacturing Sales M/M Jun | 2.10% | 2.00% | -0.60% | |
| 12:30 | CAD | Wholesale Sales M/M Jun | -0.80% | -1.80% | 0.50% |
EUR/CHF Mid-Day Outlook
Daily Pivots: (S1) 1.0782; (P) 1.0811; (R1) 1.0827; More....
EUR/CHF's sharp fall and break of 1.0788 minor support suggests that rebound from 1.0715 has completed earlier than expected at 1.0839. Failure below 55 day EMA retains near term bearishness too. Intraday bias is back on the downside for retesting 1.0715 first. Break will resume whole decline from 1.1149, towards 1.0505 low. On the upside, above 1.0839 will resume the rebound to 38.2% retracement of 1.1149 to 1.0715 at 1.0881.
In the bigger picture, rebound from 1.0505 (2020 low) should have completed at 1.1149 already. The three-wave corrective structure argues that the downtrend from 1.2004 (2018 high) is not over yet. Medium term outlook will now stay bearish as long as 55 week EMA (now at 1.0865) holds. Break of 1.0505 low would be seen at a later stage.
Canada manufacturing sales rose 2.1% mom in June, led by auto assembly
Canada manufacturing sales rose 2.1% mom to CAD 59.2B in June, slightly above expectation of 2.0% mom. Sales rose in 13 of 21 industries, with most of the increase attributable to improved production at auto assembly plants and higher sales of petroleum and coal products. On the other hand, wood product sales posted the largest decline.
US Empire state manufacturing dropped sharply to 18.3
In the August Empire State Manufacturing Survey, the headline general business conditions index dropped sharply from 43.0 to 18.3, even worse than expectation of 28.9. New York Fed said manufacturing activity continued to increase the the New York state, but growth was much slower. Index of future business conditions, on the other hand, rose from 39.5, pointing to ongoing optimism about future conditions.
British Pound Slowly Plunging
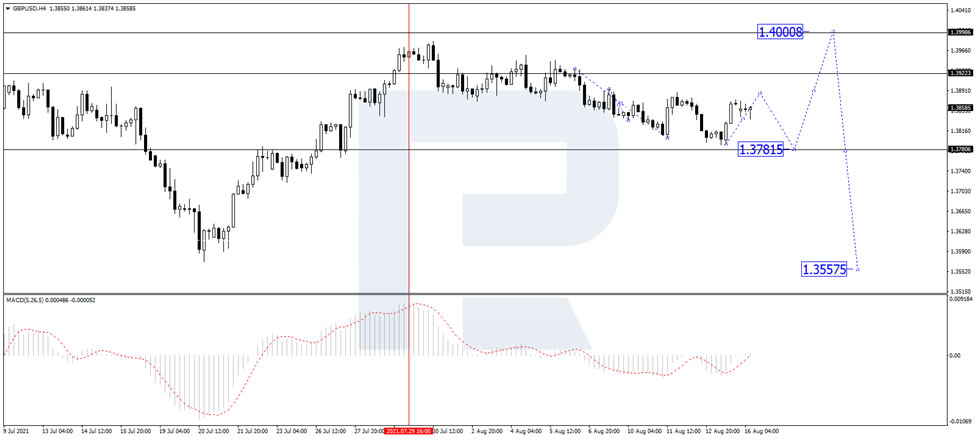
Early in another August week, the British Pound is slowly falling against the USD. GBPUSD remains under pressure within the mid-term downtrend and is mostly trading at 1.3847.
The GDP statistics for the second quarter of 2021 published by the United Kingdom were pretty much as expected, so market players switched their attention to local events. We remind you that the British economy expanded by 4.8% q/q in April-June after losing 1.6% q/q in the first quarter. As one can see, the economy is recovering and the positive report surprised no one and didn’t become a trigger for long-term confidence.
Right now, the Pound is pressured by the USD strength. Investors are pretty sure that the US Federal Reserve System will reduce its QE program sooner than expected due to strong numbers. It’s a great support to the “greenback”, which puts serious pressure on other traded currencies.
As we can see in the H4 chart, after rebounding from 1.3990, GBP/USD is correcting with the target at 1.3781; it has already completed the descending structure at 1.3790 and is currently growing towards 1.3875. Later, the market may fall towards the above-mentioned target and then complete the correction by reaching 1.4000. After that, the instrument may resume trading within the downtrend towards 1.3750. From the technical point of view, this scenario is confirmed by MACD Oscillator: its signal line is rising towards 0, a breakout of which may boost the price chart growth. On the other hand, if the line rebounds from 0, it will resume falling towards the lows and the price chart will update its lows as well.
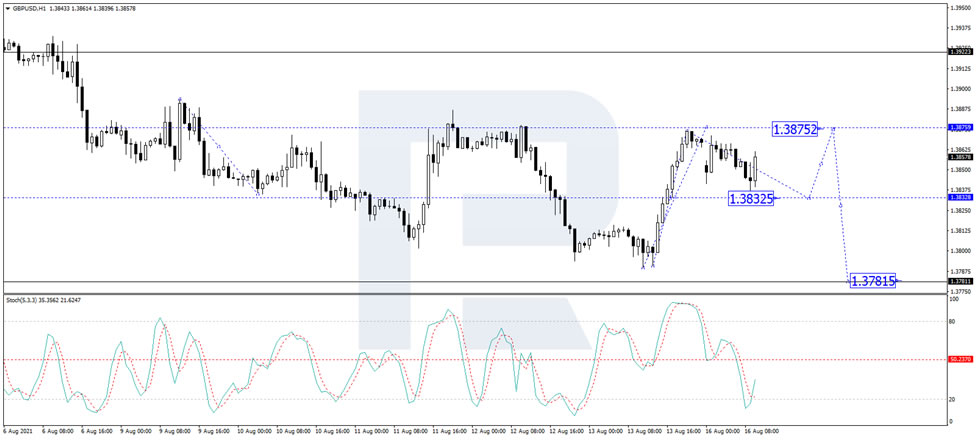
In the H1 chart, GBP/USD is correcting downwards. Possibly, the pair may form a new descending structure towards 1.3832. After that, the instrument may grow to reach 1.3875 and then fall to return to 1.3832. In fact, the asset is expected to consolidate around 1.3832. If the price breaks the range to the downside, the market may resume falling within the downtrend with the target at 1.3750; if to the upside – extend the ascending wave up to 1.4000. After reaching 1.4000, the pair may form a reversal pattern and start a new decline. From the technical point of view, this scenario is confirmed by the Stochastic Oscillator: its signal line is trading to rebound from 20 to the upside and grow towards 50, a breakout of which may lead to further growth to reach 80.
RBNZ Preview – Raising Rate as Least Regrets Option
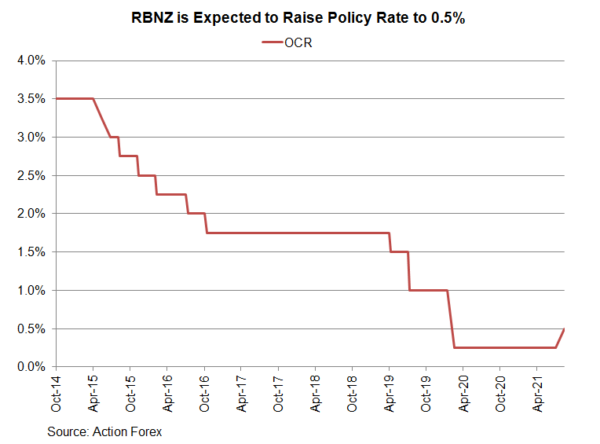
The market has priced in a 25 bps hike, bringing the OCR to 0.5%, at this week’s RBNZ meeting. Much stronger-than-expected economic recovery since the last meeting, the rapidly rising inflation and inflation expectations, and a better job market are the key reasons for the rate increase. Signs of overheating have heightened, making a rate hike probably the “least regret” option for the central bank for the current situation. Since the action has been priced in, the focus of the meeting would be the forward guidance on further tightening, i.e. how many more hikes are anticipated by the central bank.
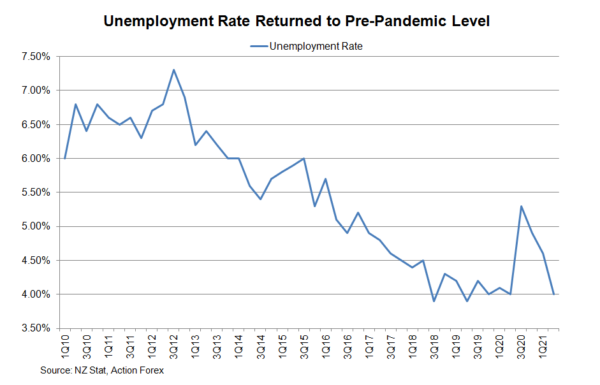
 The unemployment rate fell to 4% in 2Q21, from a revised 4.6% in the prior quarter. The market had anticipated only a mild drop to 4.5%. The decline in the unemployment rate despite higher participation rate (up +0.1 ppt to 70.5%) signaled that the job market is thriving. The number of employment increased 1% q/q, accelerating from +0.6% in the first quarter, while the growth in the labor cost also accelerated to +0.7% y/y from +0.4% in the first quarter.
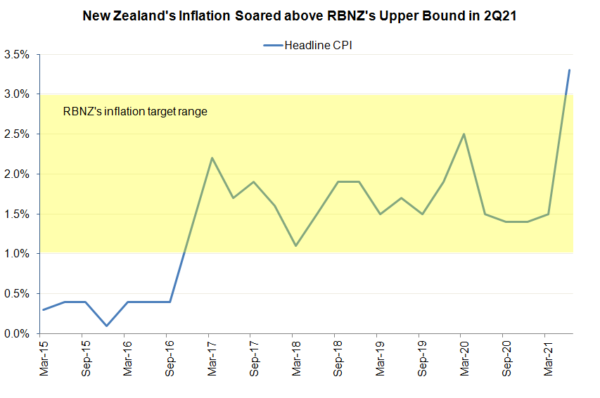
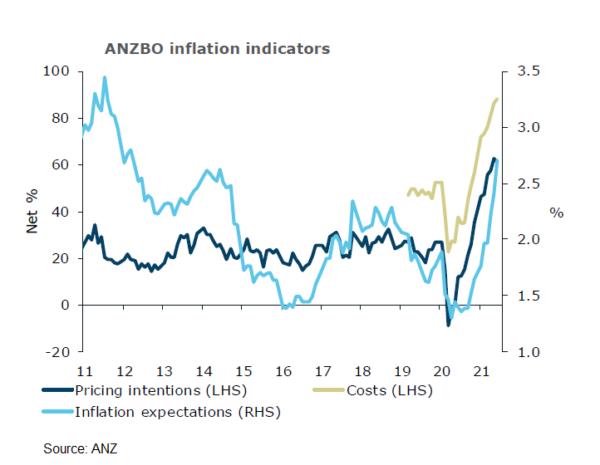
The rise in inflation appears more sustainable that RBNZ’s expectations. Headline CPI jumped to +3.3% y/y in 2Q21, exceeding RBNZ's 1% to 3% target range for the first time since 2011 and doubling first quarter’s reading of +1.5%. From a quarter ago, inflation accelerated to +1.3% from +0.7% previously. Inflation expectations also skyrocketed. According to ANZ’s latest business survey, general inflation expectations rose +29 bps to 2.70%, highest since 2012, while the late-month sample showing inflation expectations of +3.33%.
Notwithstanding government’s tax policy, housing price still jumped +5% y/y in July. Overheating in the housing market would become a genuine concern if it is not curbed by further measures.
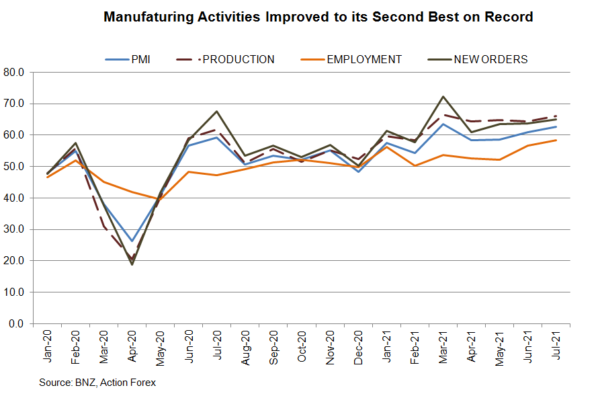
BNZ's latest manufacturing PMI revealed that activities remain strong in the beginning of the third quarter. The seasonally adjusted PMI increased +1.7 points to 62.6 in July, the second highest on record. The accompanying noted the PMI was "doing exceptionally well". It also cautioned over "the headwinds happening for global manufacturing", amidst "the resurgence of COVID19 in its delta strain".
Since the beginning of the pandemic last year, the RBNZ has been adopting a “least regrets” approach, “delivering stimulus sooner rather than later, and thus minimizing the risk that the stimulus delivered turns out not to be enough”. Given the changes in economic developments over the past months, prolonged easing is not necessary to booth growth. Rather, certain unwinding of previous stimulus would be appropriate to prevent overheating. The kiwi has rallied amidst expectations of the 25 bps-hike. Further strength would been seen only when the RBNZ delivers a hawkish outlook and projects more hikes in coming months.