Sample Category Title
EURJPY Maintains Descending Move Below Short-Term SMAs
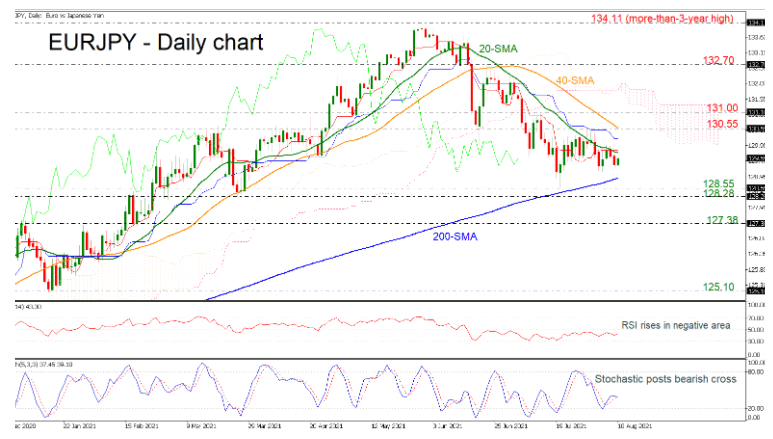
EURJPY could not find enough buyers to overcome the 130.55 level last week, with the spotlight shifting again towards the 200-day simple moving average (SMA).
Encouragingly, however, the RSI indicator is pointing up in the negative territory, providing some optimism that the bulls may not give up the battle yet. On the other hand, the stochastic oscillator is sloping downwards after the bearish cross within the %K and %D lines, overall mirroring the latest downside move from the more-than-three-year high of 134.11.
The 129.80 number, where the 20-day SMA is currently hovering, could challenge any bullish attempts towards the 130.55 area. Any breakout at this point may gather extra interest, with the price likely speeding up to the 131.00 handle. The 132.70 resistance could next come on the radar, though only a rally above 134.11 can boost buying confidence in the medium- and long-term pictures.
Alternatively, an extension below the 200-day SMA would strengthen the case of a down-trending market, likely activating a fresh bearish wave towards 128.28-128.55. Failure to hold above that floor could cause another negative extension towards 127.38 and 125.10.
In brief, the negative trend below the more-than-three-year high of 134.11 remains valid, keeping the bearish outlook intact.
GBPUSD Slips To Test 20-SMA, Short-Term Bias Neutral
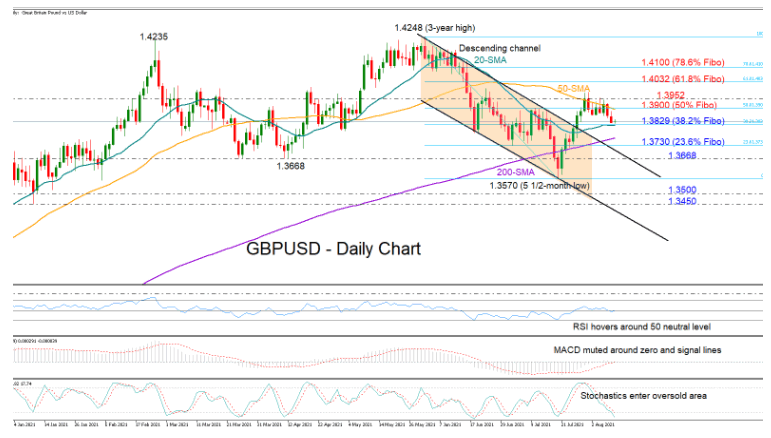
GBPUSD abandoned the intense but fruitless battle within the 1.3900 – 1.3952 resistance area to seek support near the 1.3829 level, where the 20-day simple moving average (SMA) and the 23.6% Fibonacci retracement of the 1.4248 – 1.3570 down leg overlap.
Despite the pullback, the pair has not confirmed a bearish bias in the daily chart yet according to the RSI and the MACD, which continue to fluctuate around their neutral levels. Meanwhile, the Stochastics have dropped below the 20 oversold zone, suggesting that a pivot point could be around the corner.
Should the pair find new buyers around 1.3829, the spotlight will turn again to the 1.3900 – 1.3952 resistance region. A break above this ceiling would clear the way towards the 61.8% Fibonacci of 1.4032, while not far above, the 1.4100 psychological level, which coincides with the 78.6% Fibonacci retracement, could be the next target.
On the downside, if the price breaks below 1.3829, the 200-day SMA could immediately add some footing at 1.3765, while slightly lower, the 23.6% Fibonacci of 1.3730 could prevent a test around the broken descending trendline and the former support of 1.3668.
Summarizing, GBPUSD is looking neutral in the short-term picture. A break below 1.3829 or above 1.3900 – 1.3952 could change that status accordingly.
GER 30 Struggles To Break Higher
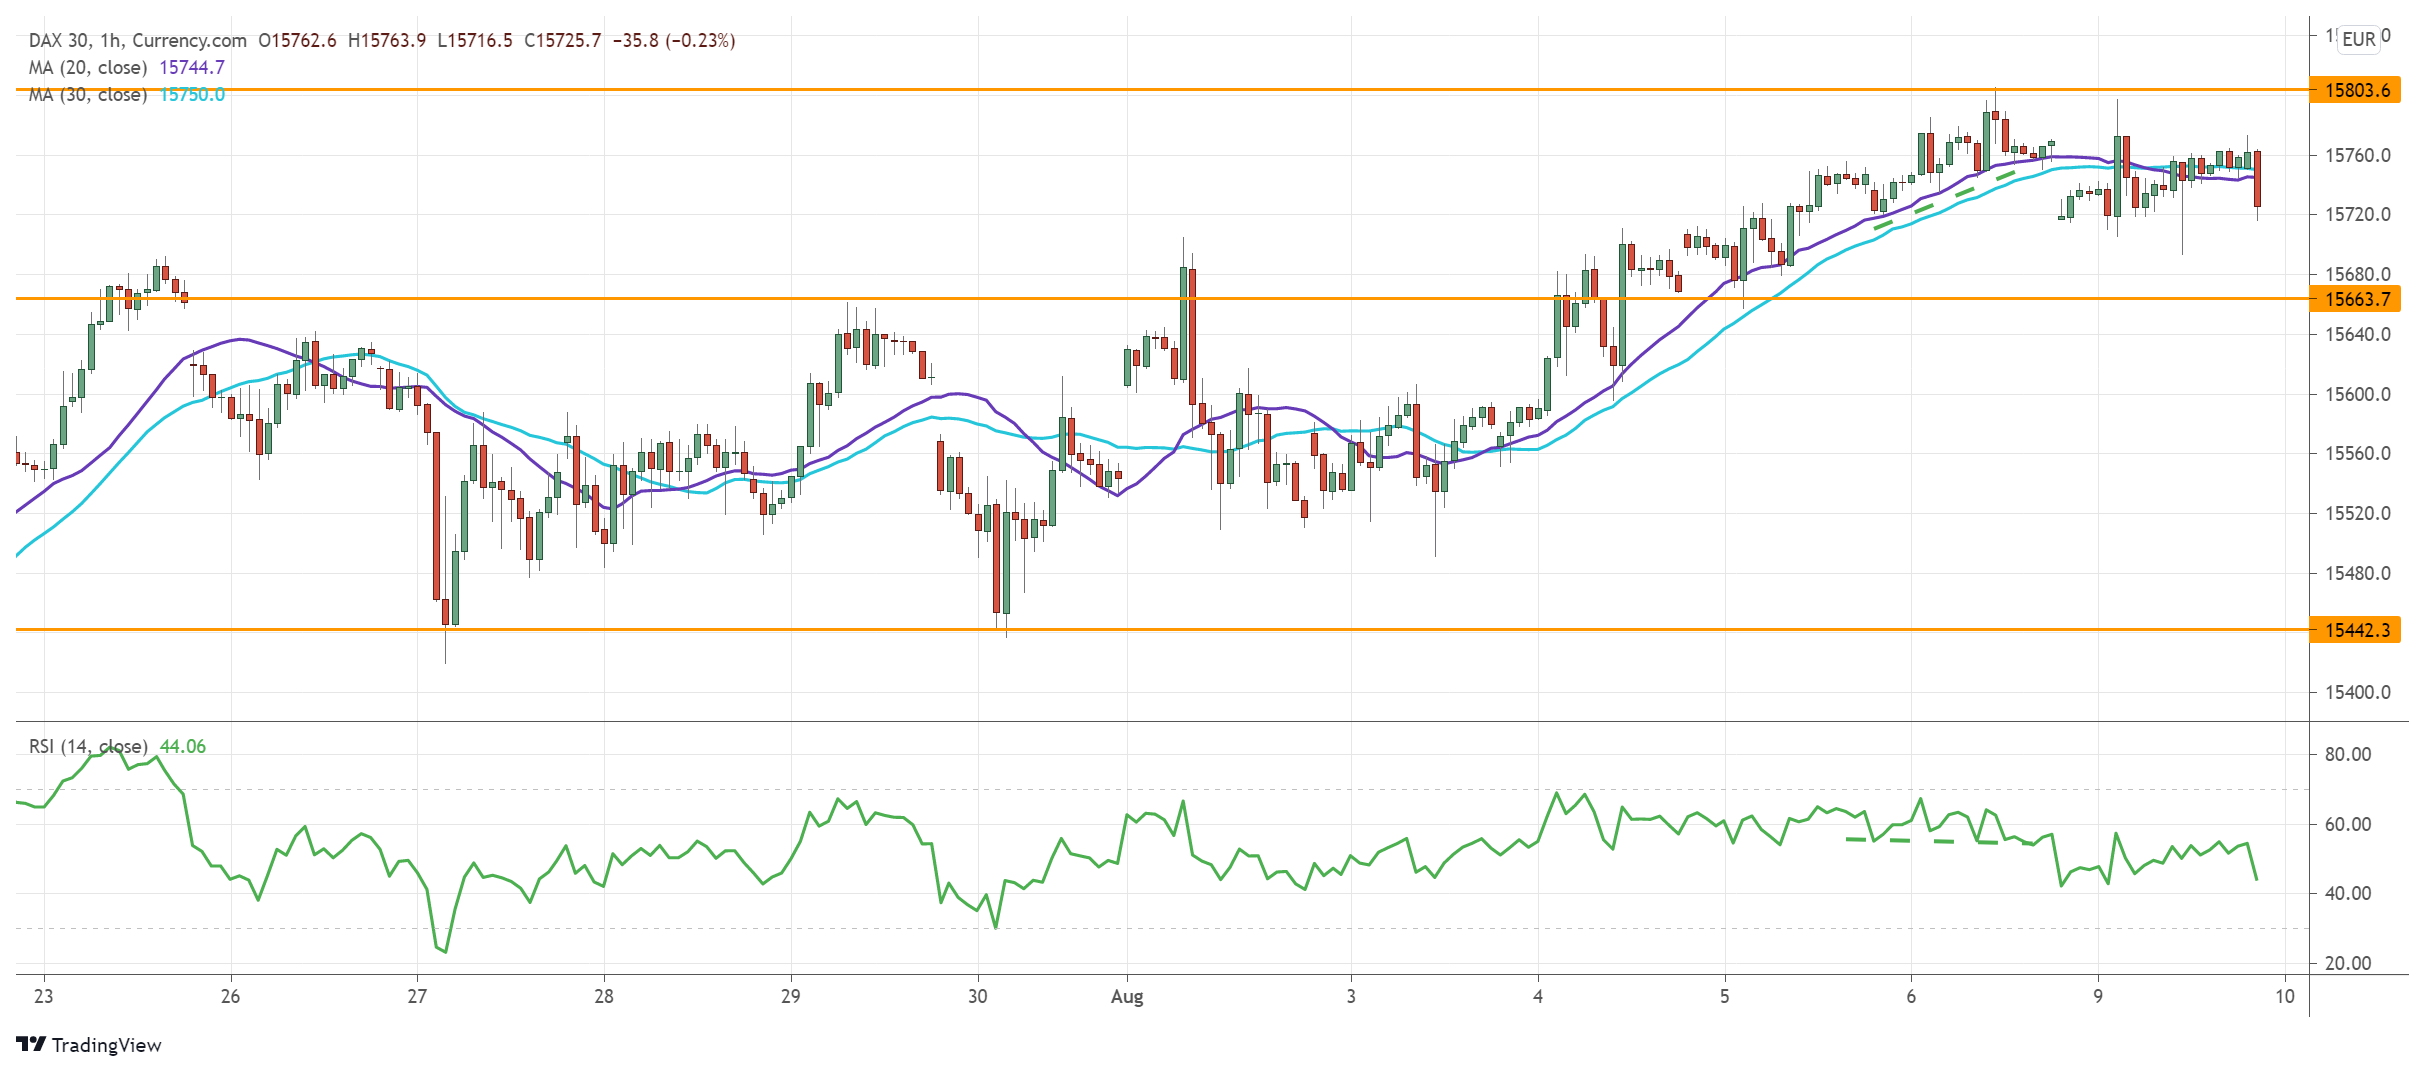
The Dax 30 hits a speed bump as investors fret about tapering in the wake of strong US jobs data. The rebound has come to a halt right at the peak at 15800.
Buyers’ struggle to push past the all-time high indicates stiff pressure from both profit-taking and fresh selling.
The RSI divergence in this kind of major supply area is a warning sign as buying has lost its impetus.
The break below 15660 could prompt the bulls to bail out. 15440 would be the next support as the index goes into a correction.
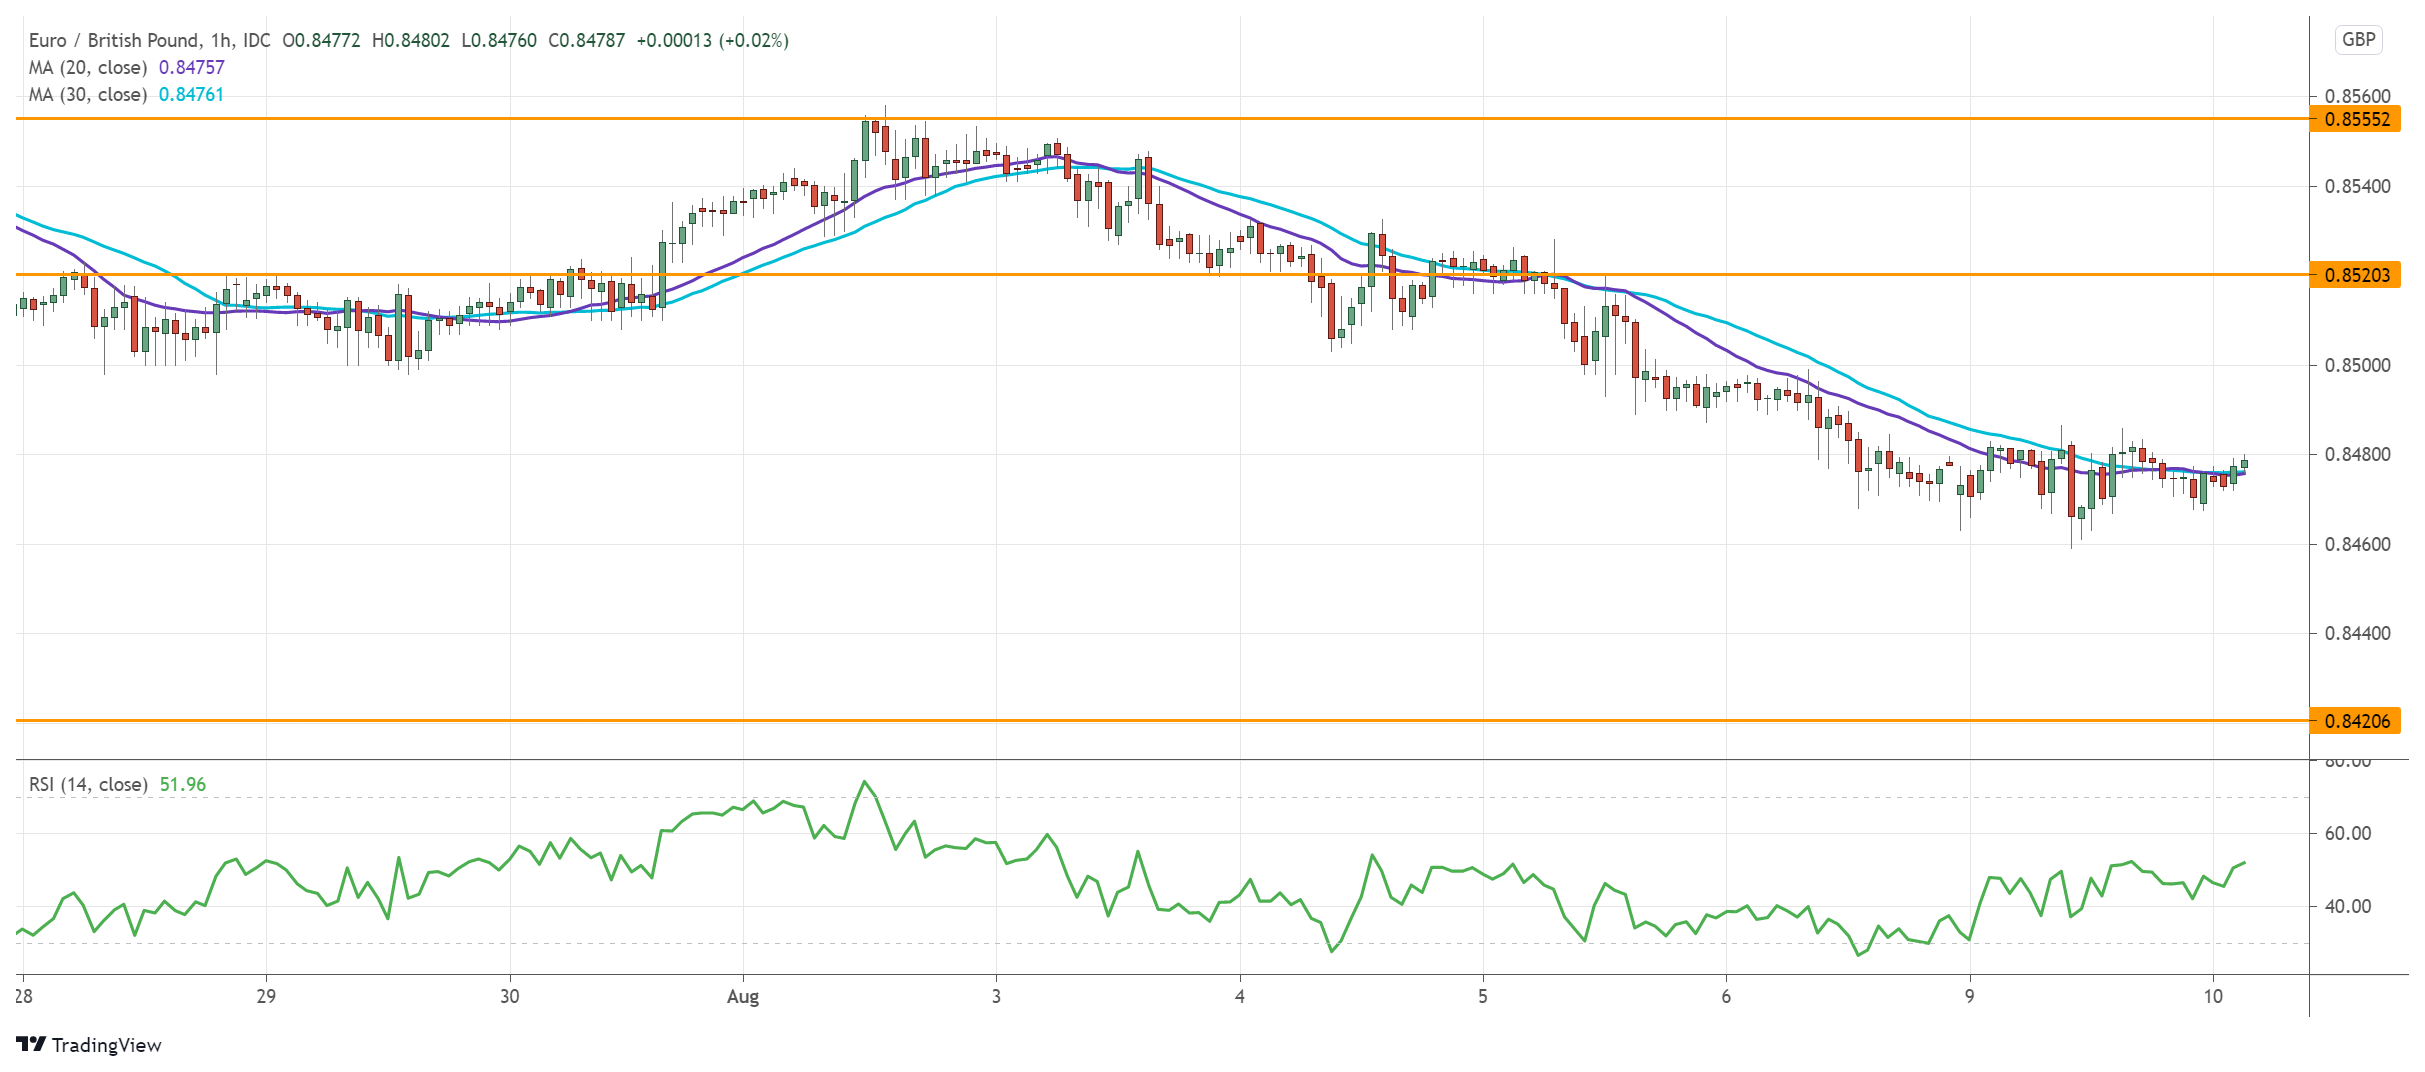
EUR/GBP Tumbles Through Floor
The sterling rises as traders bet that the BOE would start to tighten its policy sooner than most of its peers.
The daily support at 0.8470 has failed to contain the firesale. The bearish breakout has invalidated April’s rebound as sellers became more aggressive.
The downward momentum is pushing the price towards 0.8400.
An oversold RSI may have caused a limited bounce as intraday traders take some chips off the table. Sentiment remains downbeat though, as long as the euro is under 0.8520.
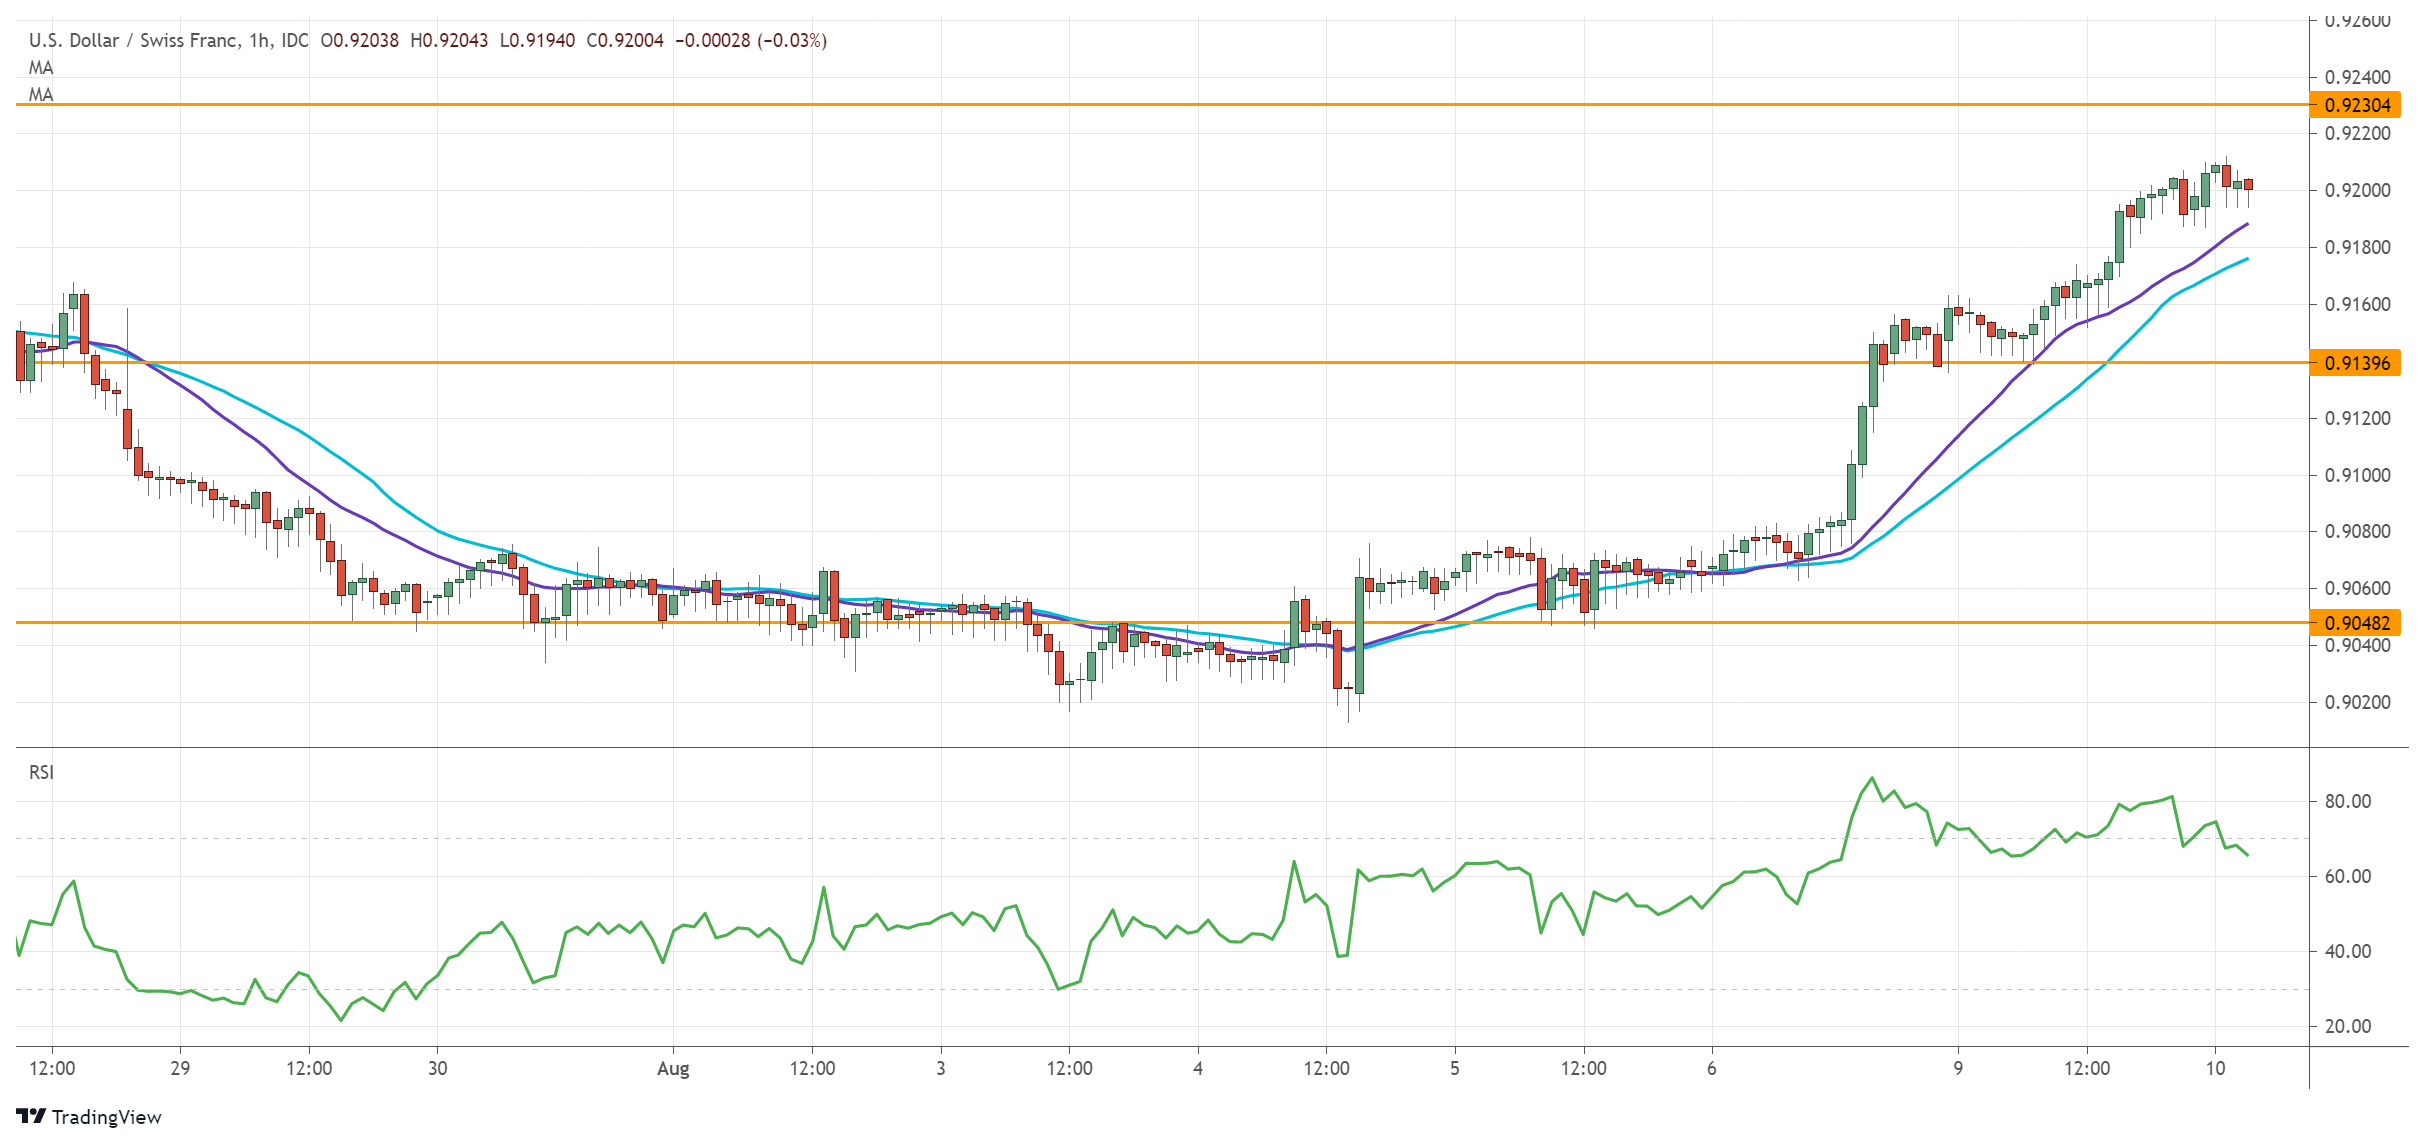
USD/CHF Approaches Key Hurdle
The US dollar continues to make up lost ground thanks to post-NFP momentum.
The break above 0.9150, the last leg of the previous sell-off, suggests solid commitment from the bulls. The rebound has originated from the demand zone around 0.9030 on the daily chart, and it is heading towards the major resistance at 0.9230.
A bullish breakout may help the dollar break free of a narrowing consolidation range and resume the rally from the start of the year.
0.9140 is the first support in case of a pullback to let the RSI cool down.
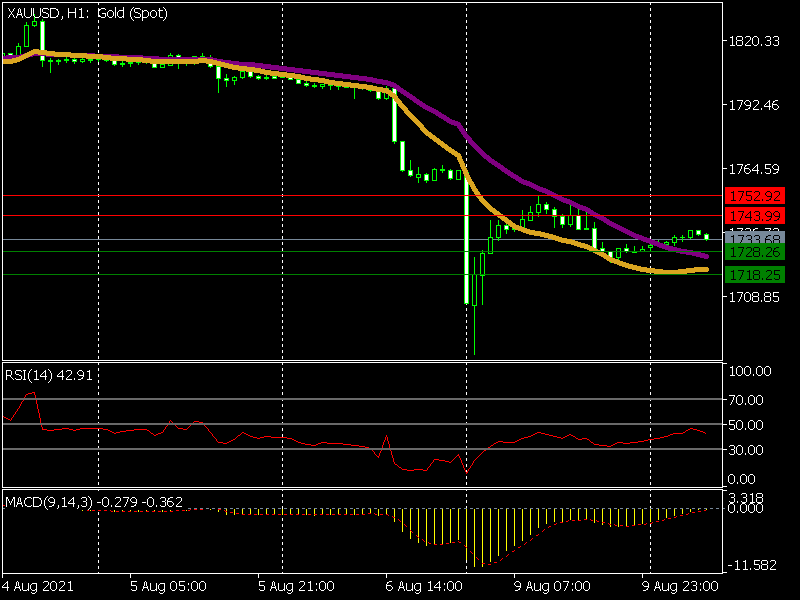
XAUUSD Is Possibly Bullish
Technical analysis
The EMA(50) and the EMA(100) tend to cross, which can be favourable for opening an order
The EMA(50) might surpass the EMA(100) after that, which will be beneficial for bulls
The MACD indicator line touched 0 from beneath and showed an upward direction
The RSI is below 50.
What the possible outcomes are
XAUUSD rebounded from yesterday’s decline, caused by the solid American new jobs numbers. The pair trades at 1,734. However, tomorrow will be crucial for the pair with the U.S. CPI data due to release. Today there will be no vital statistics, which may affect the pair. The gold price could gain support today from the vote on the U.S.dollar 1 trillion infrastructure bill at the Senate.
If the price passes the initial resistance level of 1,743.99, it could test the next one higher at 1,752.92.
Alternatively, if the price reverses, then it could reach the first support level of 1,728.26.
A pass below the first level can move the price up lower toward 1,718.25.
Key levels
Support 1,728.26 1,718.25
Resistance 1,743.99 1,752.92
Crude Oil Prices Crawl Back As China Cases Rise
The price of crude oil crawled back after having one of its worst days this year. Brent, the global benchmark, rose from $68.2 to $69.2 while West Texas Intermediate (WTI) rose from $65.2 to $66.86. These prices are substantially lower than the highest levels this year as investors remain concerned about demand as the Delta variant continues. A key worry is China, where the number of cases is rising. Chinese authorities cancelled all large-scale events and exhibitions to curb the spread. At the same time, some key companies like Amazon and Wells Fargo have recently delayed their return-to-work plans as the Delta variant spreads. Oil stocks like ExxonMobil, BP, and Royal Dutch Shell fell by more than 2% on Monday.
American stocks were mixed as investors watched the latest proceedings in the Senate where the house is set to pass the $1 trillion infrastructure package. This bill seeks to help rebuild the country’s roads and bridges and invest in clean energy. Still, the overall impact of the bill to the American economy will be muted since it will be implemented in a ten-year period. Meanwhile, the consolidation wave continued. On Monday, Cargill and Continental Grains acquired Sanderson Farms. At the same time, Canadian Pacific presented a new offer to buy Kansas City Southern. The new offer is worth about $31 billion. DraftKings also acquired Golden Nugget Online in a $1.56 billion deal.
The economic calendar will be relatively muted today. The key event will be the latest German economic sentiment data that will be published by the ZEW Institute. Analysts expect that the sentiment declined from 63.3 in July to 56.7 in August. The current conditions are expected to increase from 21.9 in July to 30.0 in August. In South Africa, the statistics agency will publish the latest manufacturing production data while Norway and Sweden will release the latest inflation and industrial production numbers.
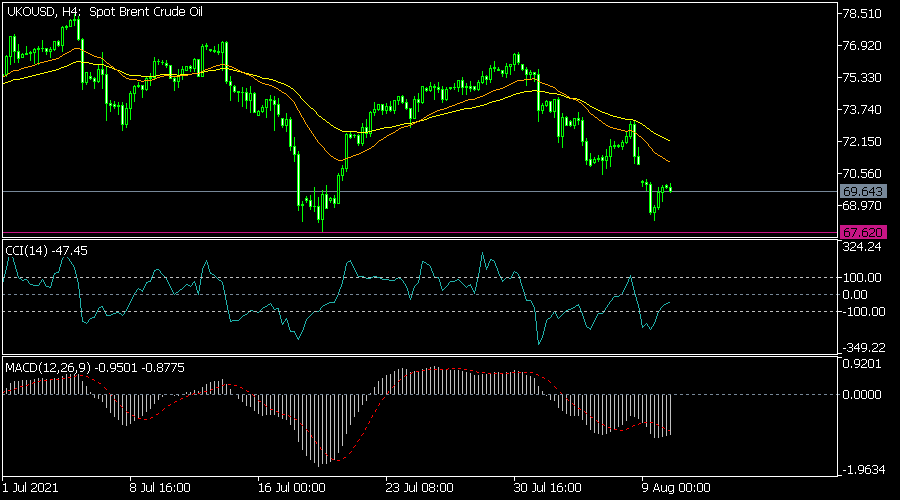
XBRUSD
The price of Brent declined to a low of 68.2 yesterday as fears of the latest wave of the pandemic remained. The lowest level on Monday was slightly above the pair’s July 20 low. This means it has formed what looks like a double-bottom pattern. It remains below the 25-day and 50-day moving averages. Oscillators like the Commodity Channel Index and MACD have tilted higher. Therefore, the pair will likely rebound as investors target the next key resistance at 70.00.
EURUSD
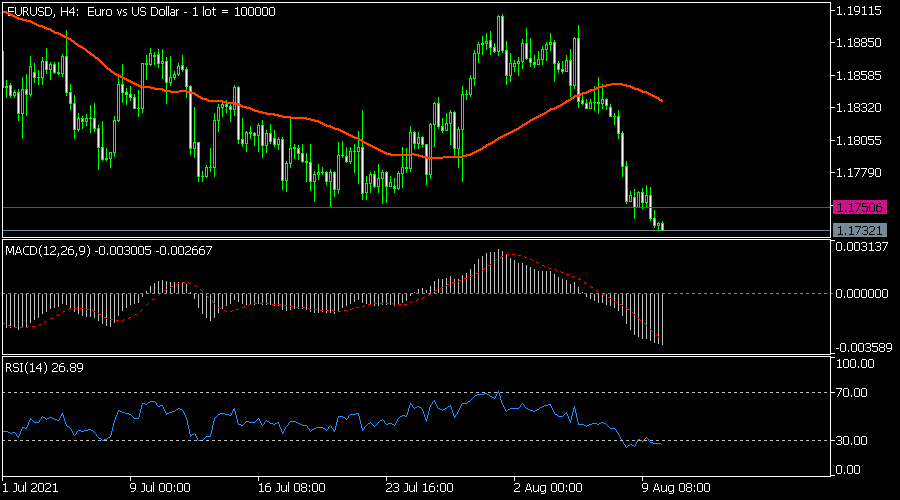
The EURUSD pair remained under pressure ahead of the upcoming German sentiment numbers. It dropped to 1.1732, which was slightly below the key support at 1.1750. The pair has dropped below the 25-day moving average while the MACD has moved below the neutral line. The RSI has also declined below the oversold level of 30. Therefore, the pair may keep falling as bears attempt to move below 1.1700.
AUDUSD
The AUDUSD tilted lower during the overnight session. The pair declined to 0.7318, which was the lowest level since July 21. The MACD has also moved below the 25-day moving average. It has also formed a double-top pattern at 0.7420. Therefore, the overall view of the pair is bearish, with the next key target being at 0.7250.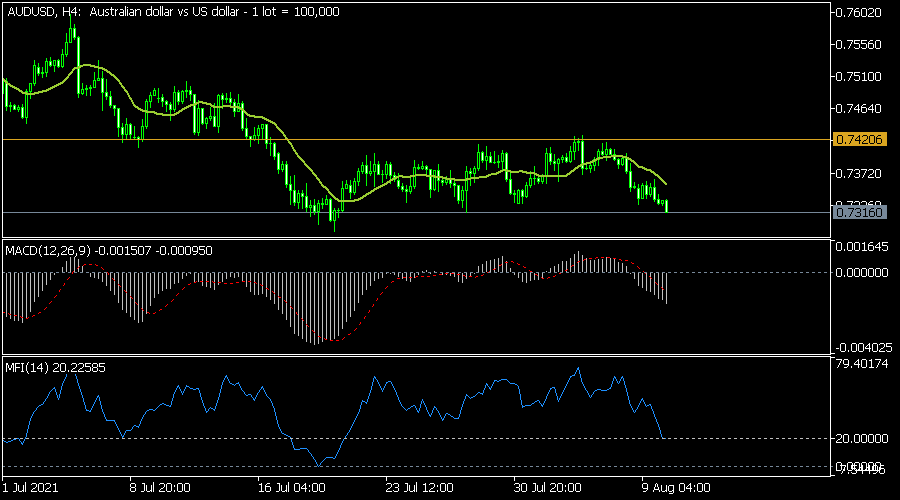
XAU/USD Bounces Off Support
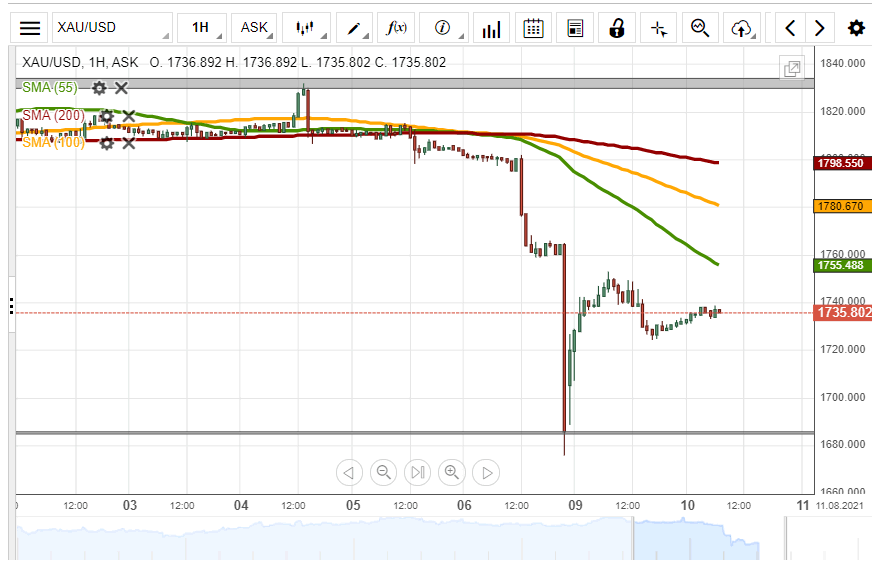
The XAU/USD exchange rate bounced off a support level at 1686.0 on Monday. As a result, Gold surged by 634 pips or 3.76% against the US Dollar during yesterday's trading session.
Technical indicators flash selling signals on the 4H and daily time-frame charts. Most likely, sellers could drive the precious metal lower during the following trading session.
On the other hand, the yellow metal's price might continue to edge higher during the following trading session.
USD/JPY Remains Below 110.40
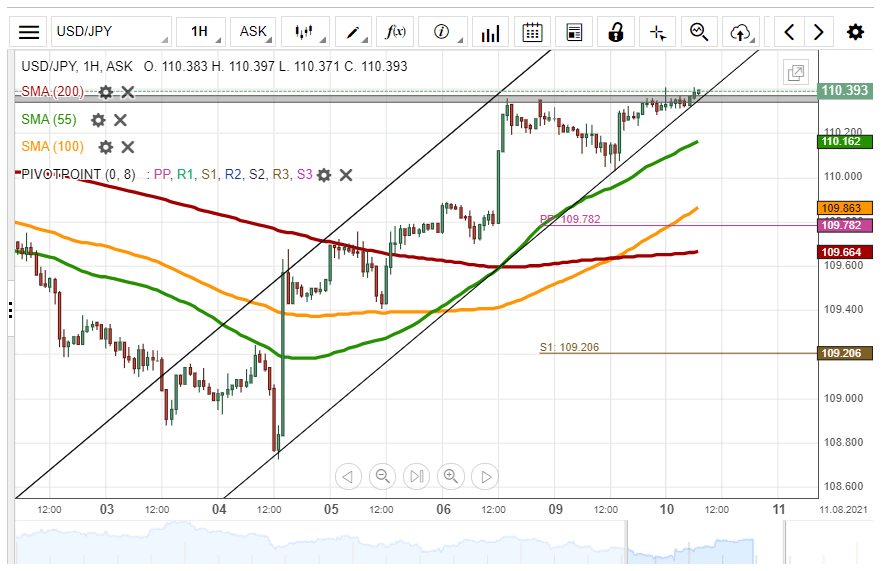
On Monday, the US Dollar rose by 29 pips or 0.26% against the Japanese Yen. But, the currency pair remained below the 110.40 area during Tuesday's trading session.
As for the near future, the exchange rate could continue to edge higher in an ascending channel pattern. The potential target for buyers will be near the weekly R1 at 110.84.
However, the currency exchange rate could continue to consolidate below the 110.40 level within this session.
GBP/JPY Daily Outlook
Daily Pivots: (S1) 152.52; (P) 152.85; (R1) 153.11; More...
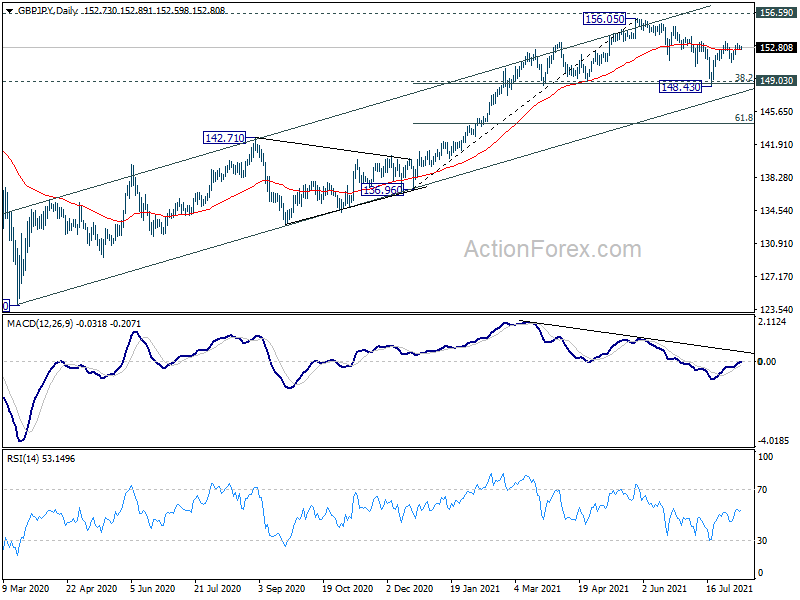
GBP/JPY is staying in range of 151.14/153.42 and intraday bias remains neutral. On the upside, break of 153.42/46 resistance will reaffirm the case that correction from 156.05 has completed at 148.43. Intraday bias will be back on the upside for retesting 156.05. On the downside, though, below 151.14 will bring deeper fall back to retest 148.43.
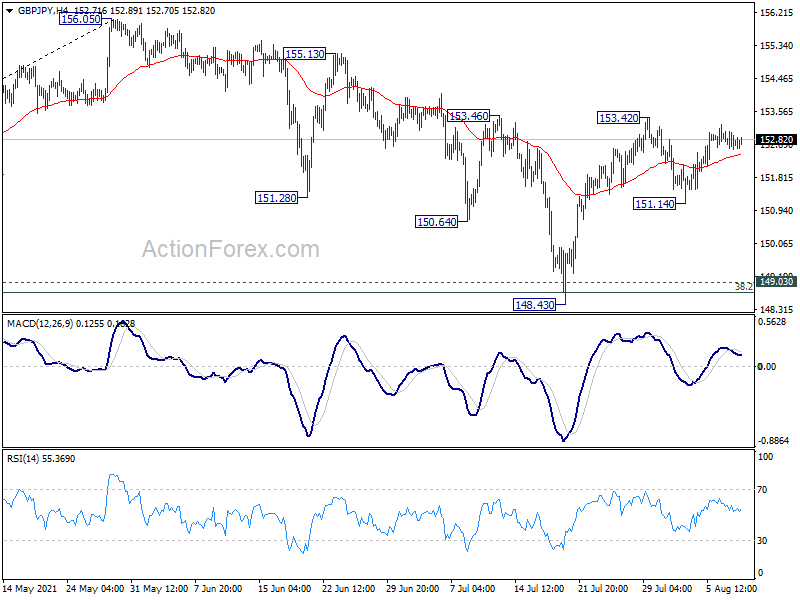
In the bigger picture, rise from 123.94 is seen as the third leg of the pattern from 122.75 (2016 low). Focus remains on 156.59 resistance (2018 high). Sustained break there should confirm long term bullish trend reversal. Next target is 61.8% retracement of 195.86 (2015 high) to 122.75 at 167.93. On the downside, sustained break of 149.03 support, however, will argue that rise from 123.94 has completed. Further break of 142.71 would open up the bearish case for retesting 122.75 low.