Sample Category Title
USD/JPY Mid-Day Outlook
Daily Pivots: (S1) 110.13; (P) 110.24; (R1) 110.46; More...
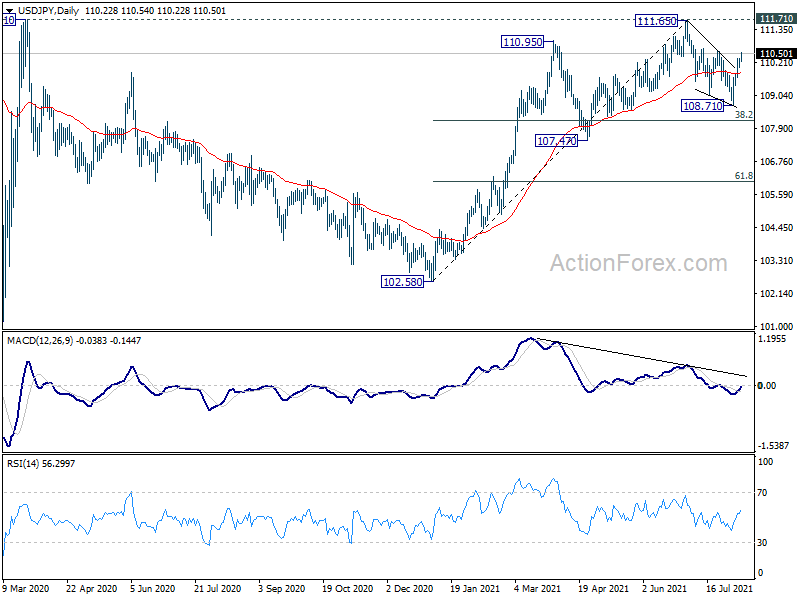
Intraday bias in USD/JPY stays on the upside at this point. Decisive break of 110.58 resistance will confirm that correction from 111.65 has completed with three waves down to 108.71. Stronger rise would then be seen to retest 111.65 high. On the downside, though, below 110.01 minor support will mix up the near term outlook and turn intraday bias neutral first.
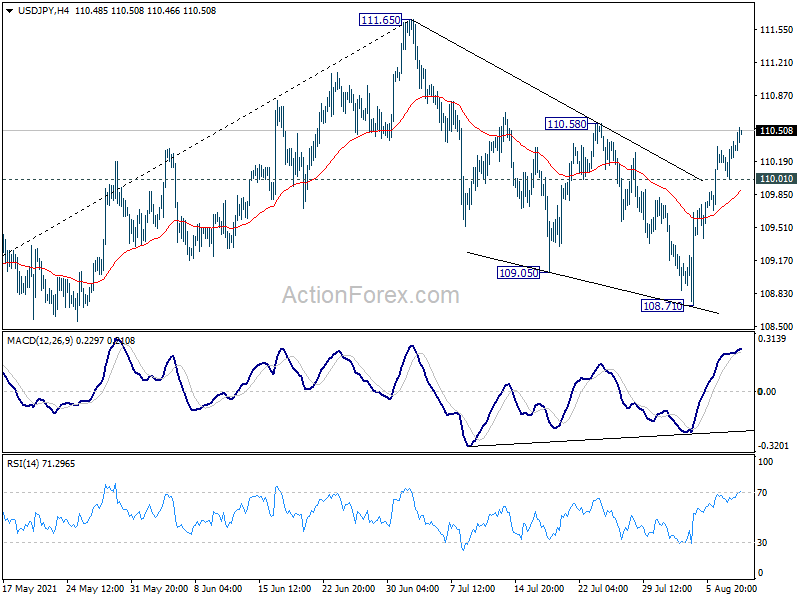
In the bigger picture, medium term outlook is staying neutral with 111.71 resistance intact. The pattern from 101.18 could still extend with another falling leg. Sustained trading below 55 day EMA will bring deeper fall to 107.47 support and below. Nevertheless, strong break of 111.71 resistance will confirm completion of the corrective decline from 118.65 (2016 high). Further rise should then be seen to 114.54 and then 118.65 resistance.
USD/CHF Mid-Day Outlook
Daily Pivots: (S1) 0.9161; (P) 0.9184; (R1) 0.9230; More....
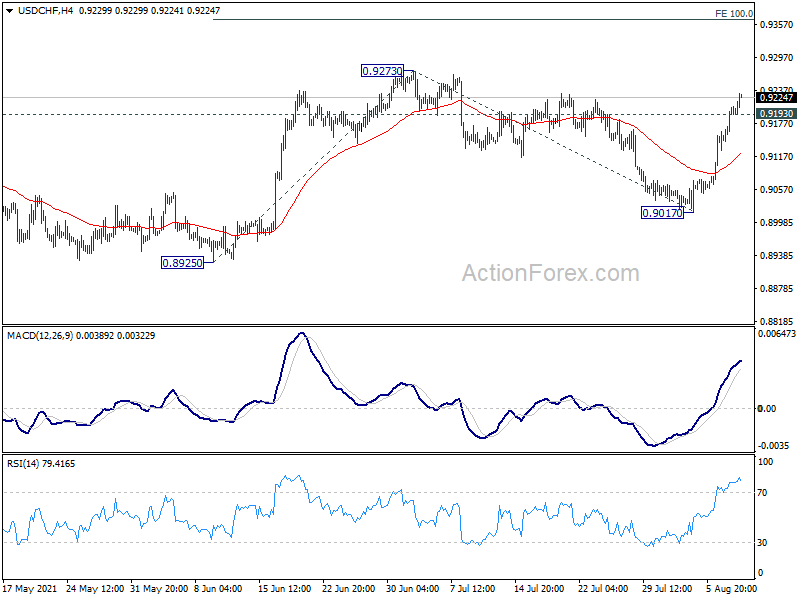
Intraday bias in USD/CHF remains on the upside for 0.9273 resistance. Sustained break there will resume rise from 0.8925 to 100% projection of 0.8925 to 0.9273 from 0.9017 at 0.9365. On the downside, break of 0.9193 minor support will mixed up the outlook and turn intraday bias neutral first.
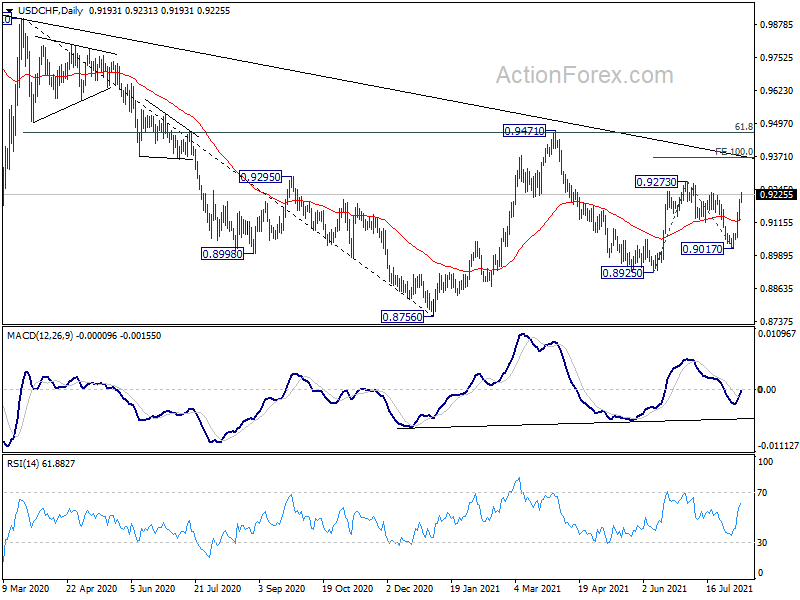
In the bigger picture, the failure to sustain above 55 week EMA (now at 0.9183) retains medium term bearish in USD/CHF. Break of 0.8925 support should resume the whole decline form 1.0342 (2016 high) through 0.8756 low. However, break of 0.9273 resistance and sustained trading above 55 week EMA will be an early sign of bullish trend reversal. Focus will then turn to 0.9471 resistance for confirmation.
GBP/USD Mid-Day Outlook
Daily Pivots: (S1) 1.3826; (P) 1.3861; (R1) 1.3880; More...
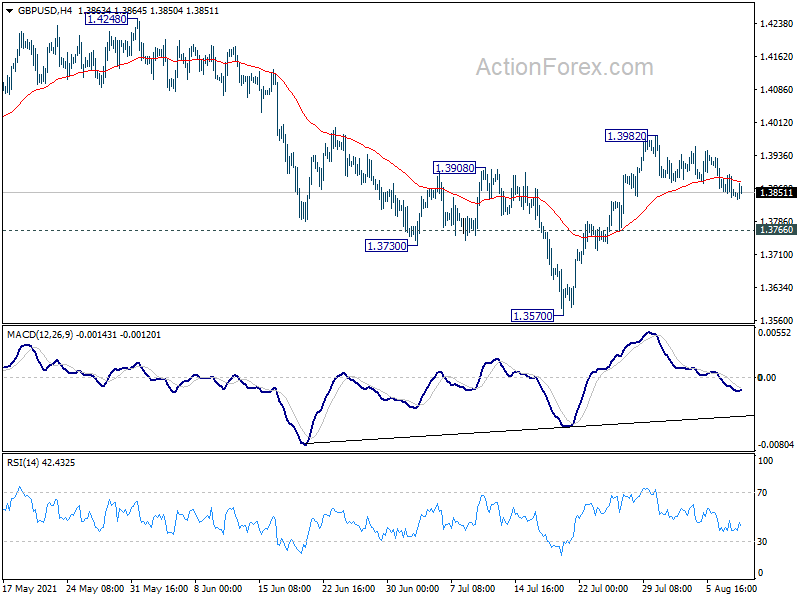
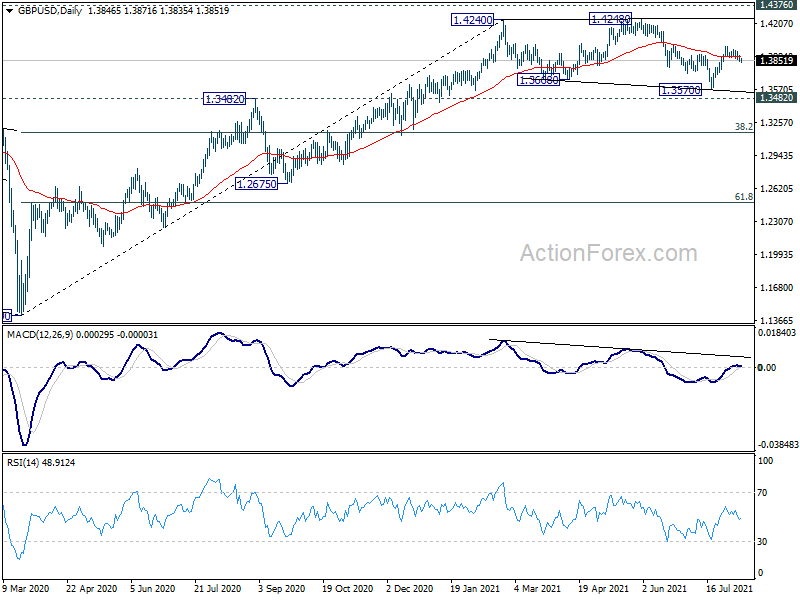
Intraday bias in GBP/USD stays neutral and more consolidation could be seen below 1.3982. Outlook is unchanged that corrective pattern from 1.4240 could have completed with three waves down to 1.3570. On the upside, break of 1.3982 will resume the rise from 1.3570 to retest 1.4248 high. However, break of 1.3766 support will dampen this bullish view and bring retest of 1.3570.
In the bigger picture, as long as 1.3482 resistance turned support holds, up trend from 1.1409 should still continue. Decisive break of 1.4376 resistance will carry larger bullish implications. However, firm break of 1.3482 support will argue that the rise from 1.1409 has completed. GBP/USD would then be seen in another leg of long term range pattern between 1.1409 and 1.4376. Deeper fall could then be seen to 61.8% retracement of 1.1409 to 1.4248 at 1.2493, and even below.
EUR/USD Mid-Day Outlook
Daily Pivots: (S1) 1.1724; (P) 1.1747; (R1) 1.1758; More...
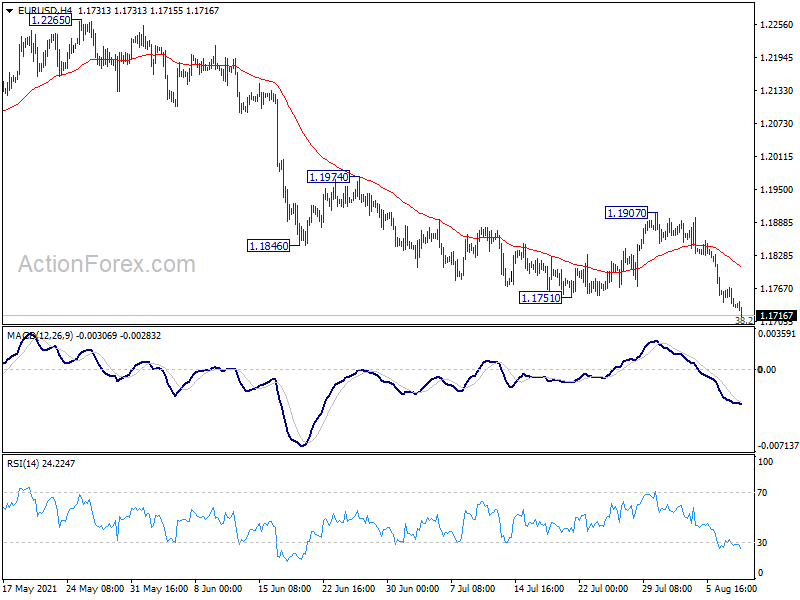
EUR/USD's decline extends to as low as 1.1715 so far today, and intraday bias remains on the downside. We'd look for strong support from 1.1602/1703 support zone to bring rebound. But break of 1.1907 resistance is needed to confirm short term bottoming. Otherwise, further fall is in favor even in case of recovery. Meanwhile, sustained break of 1.1602 will argue that it's already reversing the trend from 1.1603, and target 61.8% retracement of 1.1603 to 1.2348 at 1.1289.
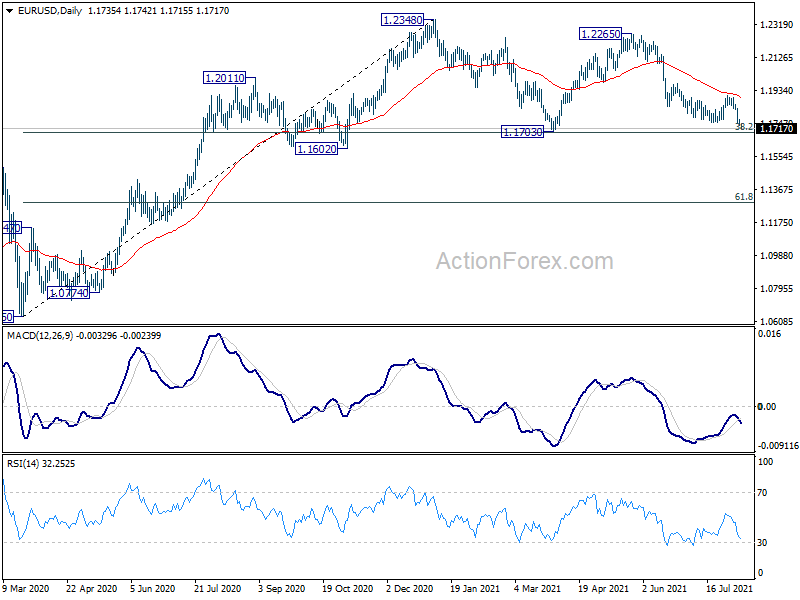
In the bigger picture, rise from 1.0635 is seen as the third leg of the pattern from 1.0339 (2017 low). Further rally could be seen to cluster resistance at 1.2555 next, (38.2% retracement of 1.6039 to 1.0339 at 1.2516). This will remain the favored case as long as 1.1602 support holds. Reaction from 1.2555 should reveal underlying long term momentum in the pair. However sustained break of 1.1602 will argue that the rise from 1.0635 is over, and turn medium term outlook bearish again.
Euro Falls after Sharp Fall in Economic Sentiment, Accelerating Lower
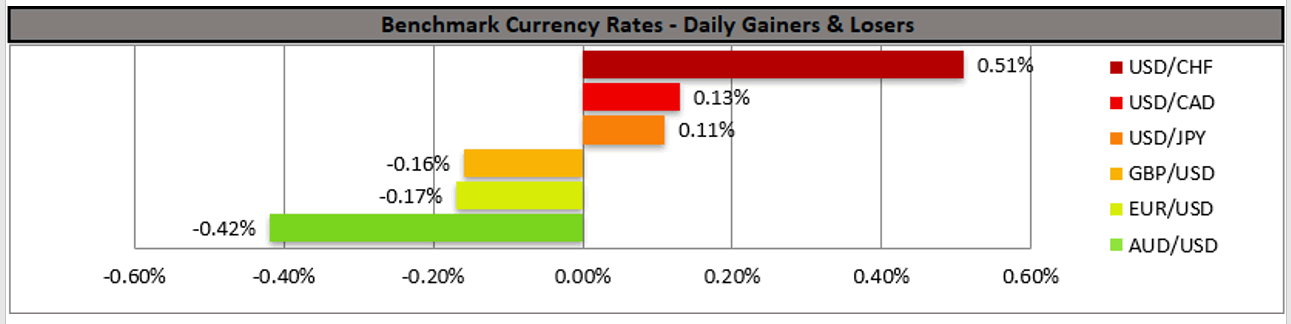
Euro falls broadly today after data showed surprised sharp fall in Germany and Eurozone economic sentiment. But at this point, Swiss Franc is even worse, while Yen is not far behind. On the other hand, Sterling and commodity currencies are trading generally higher, which much help from crosses. Dollar is also firm but await more comments from Fed officials for the next move.
Technically, EUR/USD finally accelerates down away from 1.1751 support. A major focus is whether it would drop through 1.1602/1703 support zone without hesitation, or it would draw support from there to set up a rebound. Meanwhile, EUR/GBP is also trying to get ride of 0.8470 support decisively. Sustained trading below would bring downside acceleration towards 0.8276 long term support. That could drag down Euro elsewhere too.
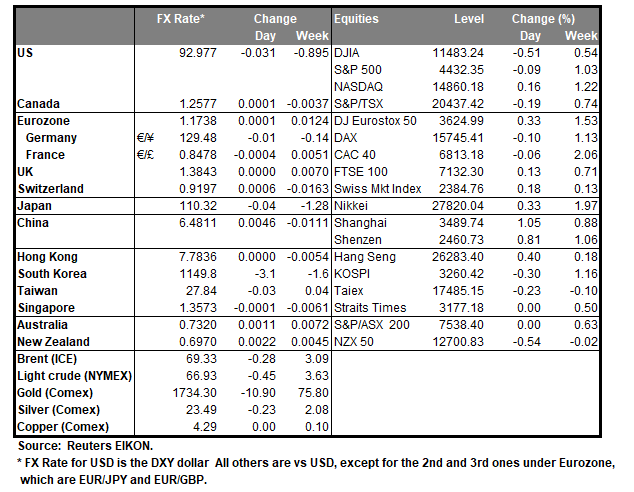
In Europe, at the time of writing, FTSE is down -0.09%. DAX is up 0.14%. CAC is up 0.02%. Germany 10-year yield is down -0.0107 at -0.468. Earlier in Asia, Nikkei rose 0.24%. Hong Kong HSI rose 1.23%. China Shanghai SSE rose 1.01%. Singapore Strait Times rose 0.95%. Japan 10-year JGB yield rose 0.0101 to 0.025.
German ZEW dropped sharply to 40.4, increasing risks for the economy
Germany ZEW Economic Sentiment dropped sharply from 63.3 to 40.4 in August, well below expectation of 57.0. Germany Current Situation rose from 21.9 to 29.3, below expectation of 30.0. Eurozone ZEW Economic Sentiment dropped sharply from 61.2 to 42.7, well below expectation of 72.0. Eurozone Current Situation rose 8.6 pts to 14.6.
"Expectations have declined for the third time in a row. This points to increasing risks for the German economy, such as from a possible fourth COVID-19 wave starting in autumn or a slowdown in growth in China. The clear improvement in the assessment of the economic situation, which has been ongoing for months, shows that expectations are also weakening due to the higher growth already achieved," comments ZEW President Professor Achim Wambach on current expectations.
Australia NAB business confidence dropped to -8, conditions dropped to 11
Australia NAB business confidence dropped sharply from 11 to -8 in July. Business conditions dropped form 25 to 11. Looking at some details, trading conditions dropped form 32 to 12. Profitability conditions dropped from 25 to 6. Employment conditions dropped from 18 to 10.
NAB said: "The continuing lockdown in NSW and the briefer periods of disruption across a number of other states saw a further deterioration in activity in the business sector in July... Confidence took a big hit in the month with optimism collapsing on the back of ongoing restrictions."
"It is now widely expected that we will see a negative print for GDP in Q3. However, we know that once restrictions are removed that the economy has tended to rebound relatively quickly. We will continue to track the survey very closely for an indication of just how quickly that happens – particularly forward orders and capacity utilisation as we assess how the disruption has fed into expansion plans as conditions bounce back".
EUR/USD Mid-Day Outlook
Daily Pivots: (S1) 1.1724; (P) 1.1747; (R1) 1.1758; More...
EUR/USD's decline extends to as low as 1.1715 so far today, and intraday bias remains on the downside. We'd look for strong support from 1.1602/1703 support zone to bring rebound. But break of 1.1907 resistance is needed to confirm short term bottoming. Otherwise, further fall is in favor even in case of recovery. Meanwhile, sustained break of 1.1602 will argue that it's already reversing the trend from 1.1603, and target 61.8% retracement of 1.1603 to 1.2348 at 1.1289.
In the bigger picture, rise from 1.0635 is seen as the third leg of the pattern from 1.0339 (2017 low). Further rally could be seen to cluster resistance at 1.2555 next, (38.2% retracement of 1.6039 to 1.0339 at 1.2516). This will remain the favored case as long as 1.1602 support holds. Reaction from 1.2555 should reveal underlying long term momentum in the pair. However sustained break of 1.1602 will argue that the rise from 1.0635 is over, and turn medium term outlook bearish again.
Economic Indicators Update
| GMT | Ccy | Events | Actual | Forecast | Previous | Revised |
|---|---|---|---|---|---|---|
| 23:01 | GBP | BRC Like-For-Like Retail Sales Y/Y Jul | 4.70% | 7.20% | 6.70% | |
| 01:30 | AUD | NAB Business Confidence Jul | -8 | 11 | ||
| 01:30 | AUD | NAB Business Conditions Jul | 11 | 24 | ||
| 05:00 | JPY | Eco Watchers Survey: Current Jul | 48.4 | 42.9 | 47.6 | |
| 09:00 | EUR | Germany ZEW Economic Sentiment Aug | 40.4 | 57 | 63.3 | |
| 09:00 | EUR | Germany ZEW Current Situation Aug | 29.3 | 30 | 21.9 | |
| 09:00 | EUR | Eurozone ZEW Economic Sentiment Aug | 42.7 | 72 | 61.2 | |
| 10:00 | USD | NFIB Business Optimism Index Jul | 99.7 | 102.3 | 102.5 | |
| 12:30 | USD | Nonfarm Productivity Q2 P | 2.30% | 3.60% | 5.40% | 4.30% |
| 12:30 | USD | Unit Labor Costs Q2 P | 1.00% | 1.20% | 1.70% |
AUD/JPY Has Established a Strong Support
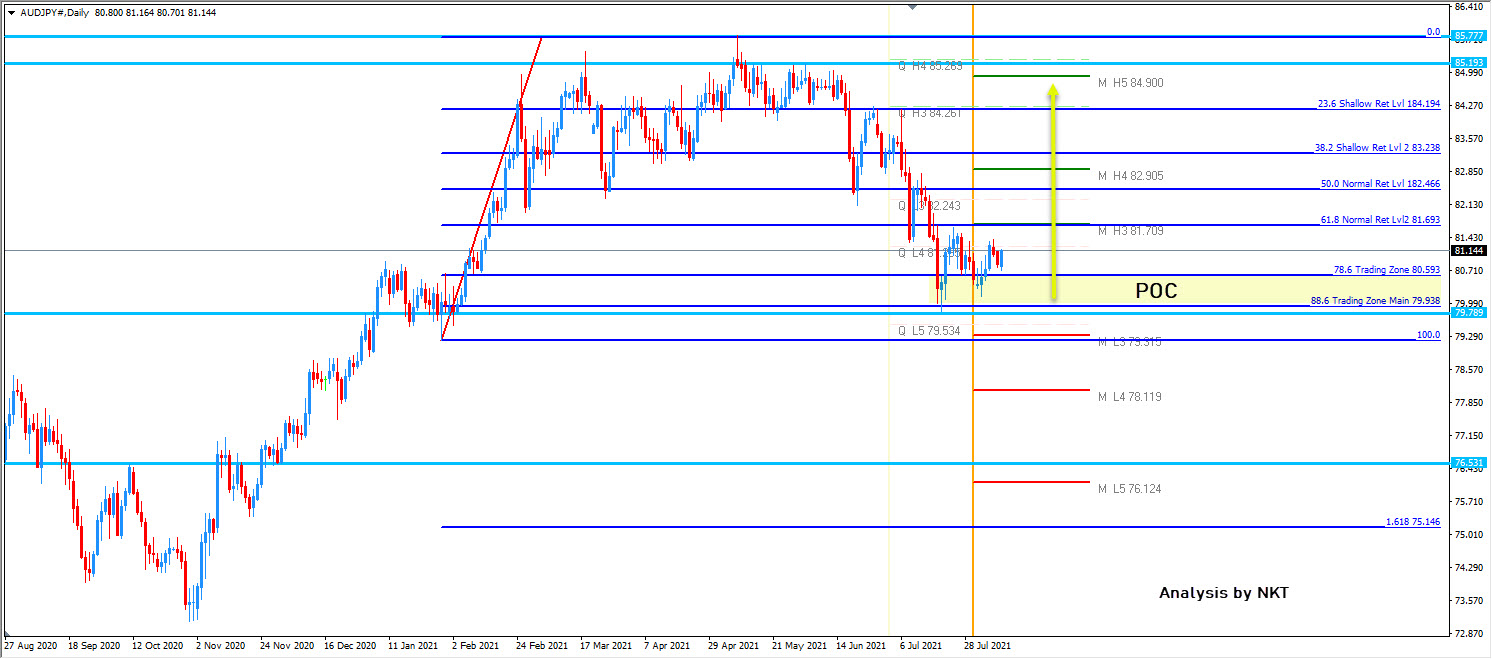
The AUD/JPY went to the 88.6 zones and established strong support. The bounce should be happening.
79.90-80.60 is the zone where we should be seeing a bounce. Q L5 pivot also protects the bulls. A bullish bounce towards 81.70 is very possible. A close above it will make the price more bullish towards 82.90 and 84.90 as the final target. Look for buying into dips.
EUR/USD Elliott Wave Analysis Eyes to 1.1700 Level
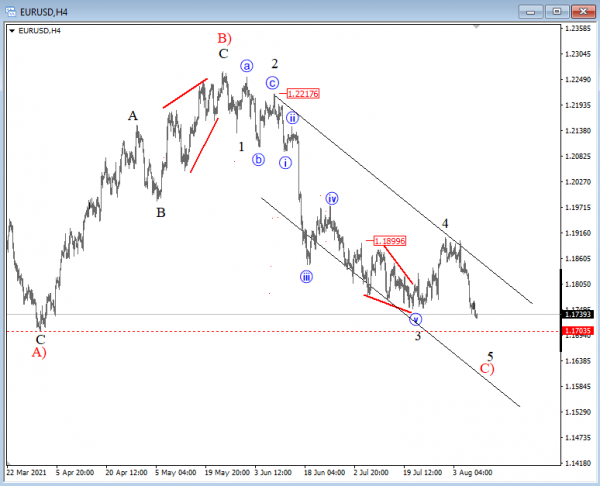
As per Elliott Wave analysis, EURUSD is coming down after Friday's NFP report, now seems like it's breaking down into wave 5 targeting that April levels are near 1.1700.
Ideally, the pair will still be looking for some buyers down there when the market may turn up after completed a higher degree (A)-(B)-(C) drop since the start of the year.
EUR/USD 4h Elliott Wave analysis chart
Pace Of US CPI Inflation To Test Dollar Bulls
While the Fed has distinctly stated that a potential shift in monetary tightening is strictly conditional on whether the US labor market will make significant progress, US CPI inflation figures could still be worth watching on Wednesday at 12:30 GMT. Forecasts are for a minor slowdown in July’s figures, which makes any deviations possible. An upside surprise could add pressure for monetary tightening as soon as September, providing more fuel to dollar bulls and vice versa.
Inflation expectations remain below 2.0%
According to inflation swap rates, inflation expectations have moderately diminished from recent peaks in the US, signalling that investors have somewhat swallowed the Fed’s excuse of transitory inflation despite the recent surge in price indices.
Inflation spikes not a worry anymore for Fed
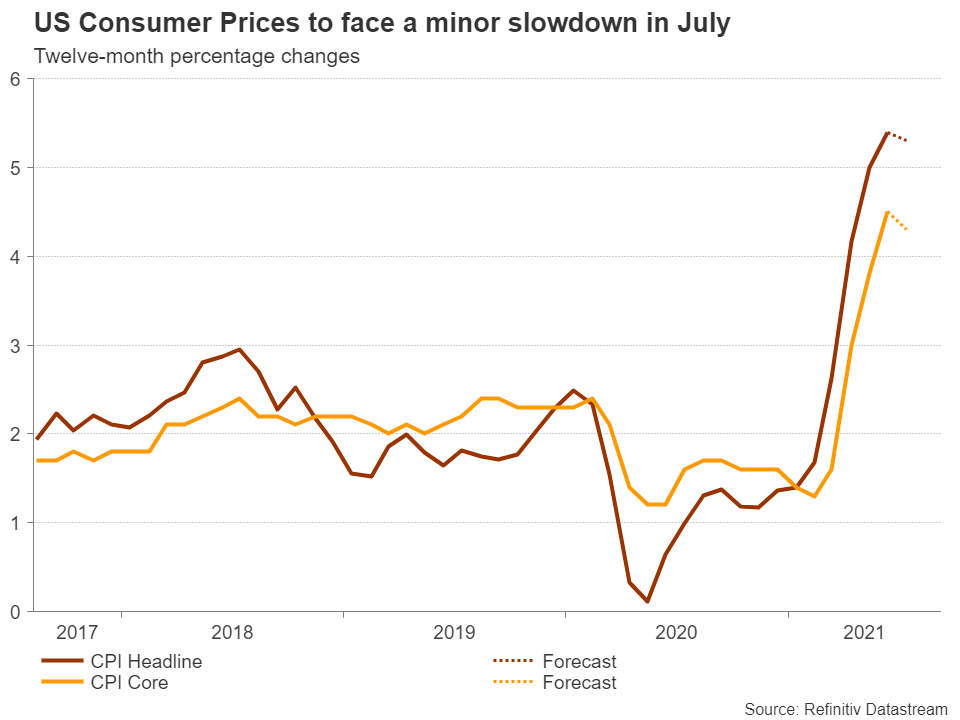
The Fed’s favorite inflation measure, the core PCE index, has been up and running since April, marking highs after highs above 2.0%, which was the central bank’s upper limit before the switch to a more flexible targeting. The core CPI inflation followed a similar pattern, but the pace of increases was steeper, leading the gauge to a 30-year high of 4.5% year-on-year in June, while the broader headline CPI clocked in even higher at 5.4% y/y.
Under other circumstances, the Fed would have immediately abandoned its ultra-easy stimulus programs with scope to press inflation back to the 2.0% target. But this is not the case anymore. Its new inflation approach is now allowing prices to heat above 2.0% for some time until they average around this threshold in the medium term before any move to policy tightening takes place. On top of this, the central bank believes that the spiral in prices is a transitory phenomenon underpinned by the pandemic blues, implying that once the economy returns to normal life and supply constraints vanish, price growth would pull back below 2.0%.
The above reasoning is justifying the dollar’s muted reaction to inflation numbers over the past few months. Perhaps, as long as the Fed is not sweating and the labor market remains the elephant in the room, investors could be less sensitive to any inflation numbers. However, if the jobs data reach the desired level in the next few months and inflation remains stuck at high levels, forcing the Fed to bring forward any bond tapering plans, the dollar could get an extra boost.
Another interesting scenario would be if inflation loses steam as base effects fade, but consumer prices remain at high levels, weighing on demand for products and services. But this is another story!
CPI inflation to lose steam in July
Nevertheless, CPI stats for the month of July are expected to rise at a softer pace on Wednesday. The headline CPI is forecast to gear marginally down to 5.3% y/y from 5.4% previously, while the core measure, which excludes volatile items such as food and energy, is projected to slip to 4.3% y/y from 4.5%. The monthly change is expected to slow down at a faster pace, falling from 0.9% to 0.5%.
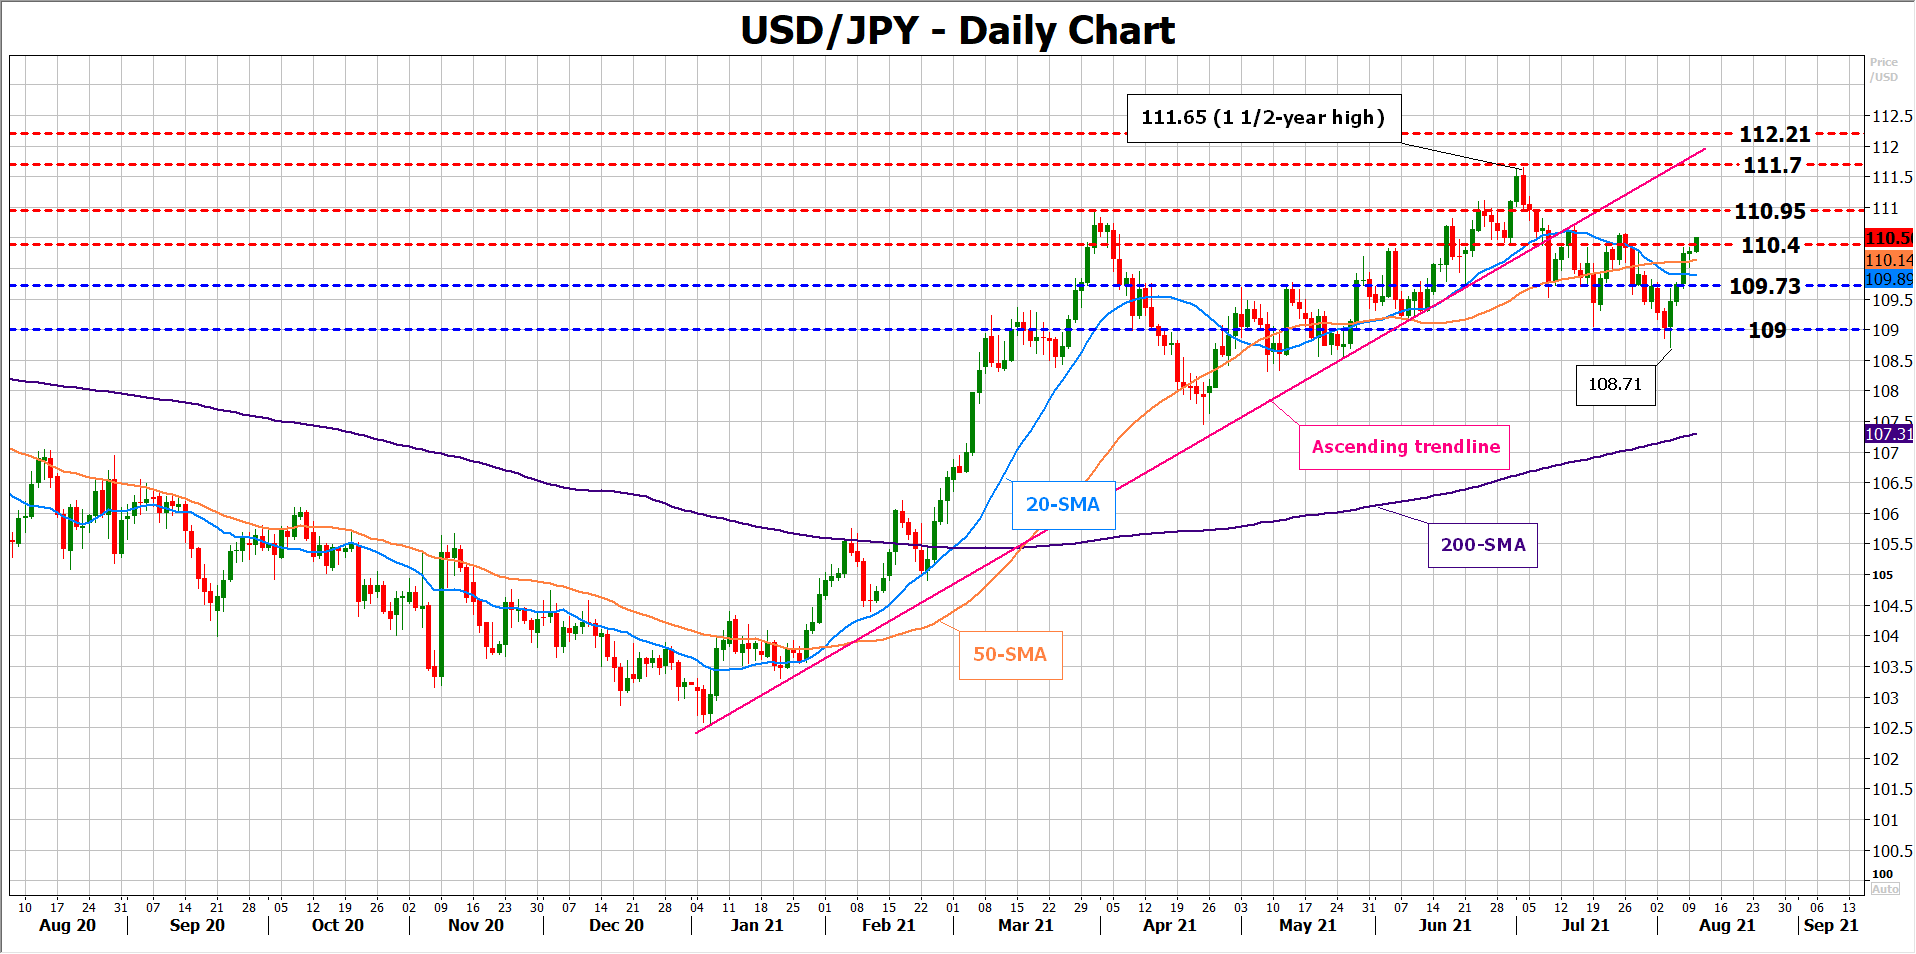
The above projections suggest a minimal pullback, which could still leave price indices elevated comfortably above 2.0%. Hence, such a result would not affect the dollar much. Probably, a sharper-than-expected slowdown could defend the Fed’s transitory explanation and vindicate the falling inflation expectations, reducing the need for tighter monetary policy, and consequently sending dollar/yen back to the nearby 109.73 support area. Lower, the door would open for the 109.00 mark.
Alternatively, if CPI numbers run surprisingly beyond forecasts, extending their uptrend above 2.0% for the fifth consecutive month, calls for monetary tightening could step up within the central bank, but given the Fed’s overall calm tone, any upside correction in dollar/yen could be restricted. Should the pair close above 110.40, the next obstacle could emerge near 110.95 and then around 111.70.
Recall that July’s ISM business PMI survey reported a significant price surge in the services sector, which is a key growth driver in the US economy. Hence, an upside surprise is theoretically likely.
EURUSD Is Possibly Bullish
Technical analysis
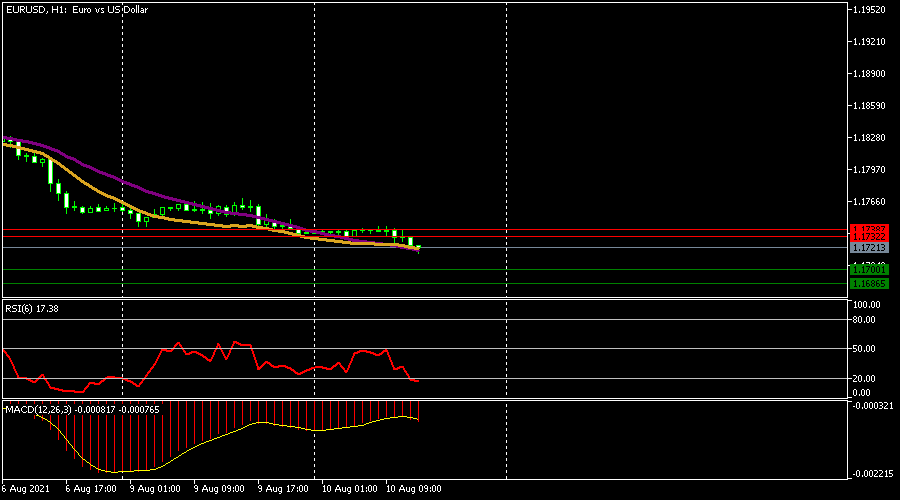
The EMA(50) and the EMA(100) crossed, which is favourable for opening an order
The EMA(50) is above the EMA(100) after that, which will be beneficial for bulls
The MACD indicator line is below 0, showing a downward direction
The RSI surpassed 20, the oversold zone, and may change the trend.
What the possible outcomes are
EURUSD declined after the weak German ZEW data. The pair trades at 1.17200. However, technically the price may rebound to the previous day's level with a little uprising momentum.
If the price passes the initial resistance level of 1.17322, it could test the next one higher at 1.17387.
Alternatively, if the price reverses, then it could reach the first support level of 1.17001.
A pass below the first level can move the price up lower toward 1.6865.
Key levels
Support 1.17001 1.16865
Resistance 1.17322 1.17387
USD Continues To Strengthen
The USD continued to rise against a number of its counterparts yesterday in the aftermath of a strong employment report for July, which tended to enhance market expectations for the Fed to start tapering its QE program. The possibility of the Fed starting to tighten its monetary policy tended to weaken safe heavens such as gold and bonds and its characteristic that US treasury yields were on the rise for the past few days. Fed officials seem to be leaning also towards an earlier tapering, as Atlanta Fed President Bostic yesterday stated that he is eyeing the fourth quarter for the bank to start tapering its QE program, while Boston Fed President Rosengren stated that the Fed should begin slowing stimulus efforts by fall. Both statements tended to intensify market expectations for the Fed to taper its QE program rather sooner than later. Yesterday the JOLTS job openings for June came out higher than expected and inflation is the next big question for the US economy. We expect the US CPI release for July due out tomorrow Wednesday, to draw the attention of USD traders as it would provide additional information that could affect the Fed’s stance and until then probably fundamentals are to take over and guide the greenback.
The USD Index continued to rise yesterday distancing its price action from the 92.75 (S1) support line. We tend to maintain a bullish outlook for the index yet the RSI indicator below our 4-hour chart has surpassed the reading of 70, which on the one hand confirms the dominance of the bulls, yet on the other may imply that the index is overbought and a correction lower is possible. Should the USD continue to be in demand we may see the USD Index breaking the 93.20 (R1) resistance line and aim for the 93.65 (R2) resistance level. Should a correction lower come into play and a selling interest be displayed we may see the index breaking the 92.75 (S1) support line and aim for the 92.30 (S2) support level.
AUD leans on the soft side
AUD continued to weaken against the USD yesterday, as dropping commodity prices and ongoing lockdown measures back home tended to weigh. Iron ore prices continue to fall weakening the outlook for the Aussie given that Iron Ore is one of the main export products of Australia and seems to feel the pressure from China which is a main importer of the industrial metal. At the same time the path of the pandemic back home remains highly worrisome as lockdown measures in the most populous state, New South Wales are extended and concerns about the spreading of Covid remain high. It’s characteristic that business conditions and confidence for July dropped yesterday underscoring the weaker outlook for the Aussie.
AUD/USD continued to retreat yesterday breaking the 0.7335 (R1) support line now turned to resistance. We tend to maintain a bearish outlook for AUD/USD as long as it remains below the downward trendline incepted since the 5th of August. Should the bears actually maintain control over the pair’s direction, we may see AUD/USD aiming if not breaking the 0.7265 (S1) support line, in search of lower grounds. Should the bulls take over we may see AUD/USD breaking the prementioned downward trendline, the 0.7335 (R1) resistance line and aim for the 0.7400 (R2) level.
Other economic highlights today and the following Asian session:
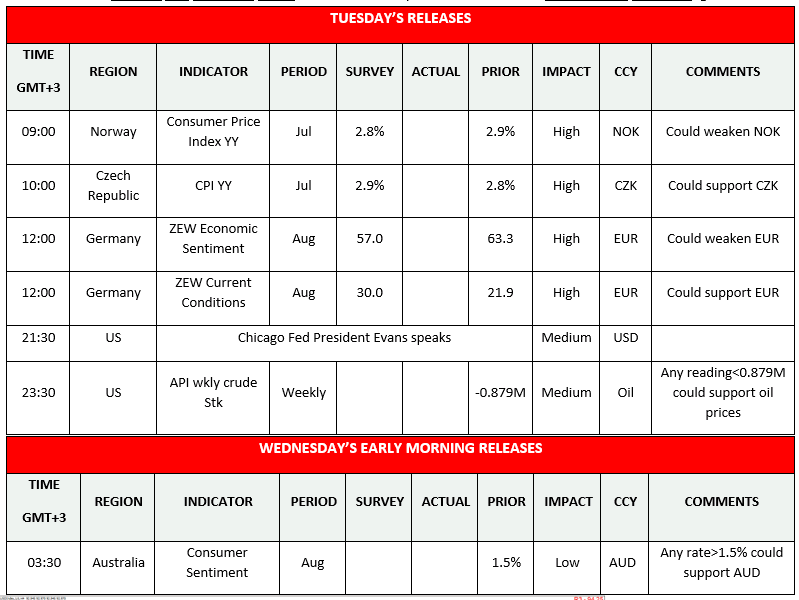
Today, in the European session, we get Norway’s and the Czech Republic’s CPI rates for July as well as Germany’s ZEW indicators for August. In the late American session, we get from the US the weekly API weekly crude oil inventories figure, while during tomorrow’s Asian session we get Australia’s consumer sentiment for August. Please note that on the monetary front, during today’s American session Chicago Fed President Evans is scheduled to speak and could draw considerable attention, given the current hype regarding the Fed’s intentions.
USD Index H4 Chart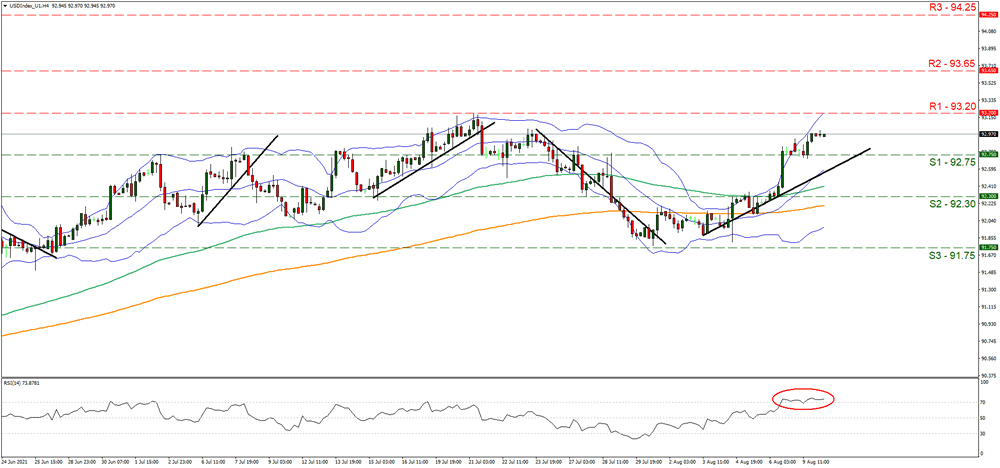
Support: 92.75 (S1), 92.30 (S2), 91.75 (S3)
Resistance: 93.20 (R1), 93.65 (R2), 94.25 (R3)
AUD/USD H4 Chart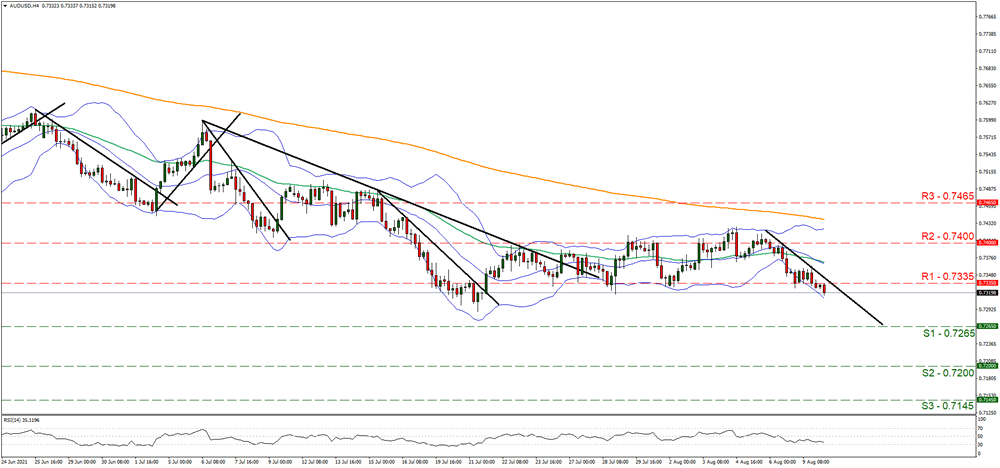
Support: 0.7265 (S1), 0.7200 (S2), 0.7145 (S3)
Resistance: 0.7335 (R1), 0.7400 (R2), 0.7465 (R3)