Sample Category Title
USDJPY Maintains Sideways Trajectory Below Broken Trendline
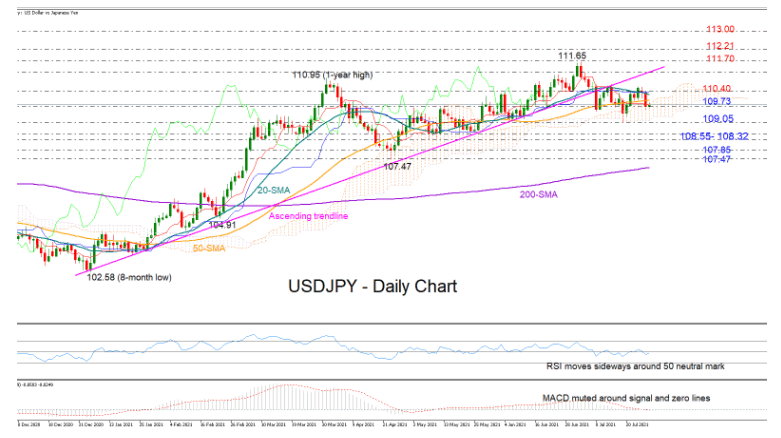
USDJPY was capped by the 20-day simple moving average (SMA) around the 110.40 resistance area on Tuesday, with the price pulling back to seek support near the 109.73 number once again.
Previously, the crack below the long-term trendline forced the price into a sideways trajectory as the bounce at the bottom of the Ichimoku cloud at 109.05 withered the potential of sharper declines. With the RSI swinging around its 50 neutral mark and the MACD holding muted around its zero and signal lines, expectations are for the pair to maintain its trendless direction in the short-term picture.
Nevertheless, as the Fed policy announcement approaches, traders will be waiting for a close above the 20-day SMA and the 110.40 level before they target again the broken ascending trendline seen around 111.20. Slightly higher, the 111.70 – 112.21 resistance region, where the price topped in 2020, could build a tougher wall, blocking any move towards the 113.00 psychological level.
In the bearish scenario, a decisive step below the cloud and the 109.05 number would open the door for the 108.55 – 108.32 support zone. Breaching that floor too, the bears would aim for a close below the 107.85 – 107.47 area, which triggered April’s rebound, while not far below, the 200-day SMA may attract all the attention if sellers persist.
Summarizing, USDJPY is looking neutral in the short-term picture. The next round of volatility is expected to start above 110.40 or below 109.00.
EUR/AUD Daily Outlook
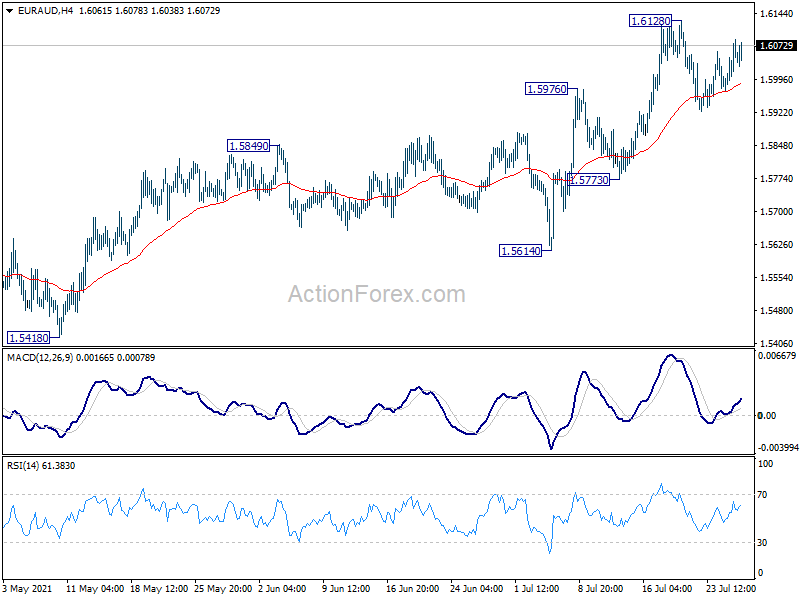
Daily Pivots: (S1) 1.5996; (P) 1.6042; (R1) 1.6103; More...
EUR/AUD is staying in consolidation from 1.6128 and intraday bias remains neutral first. Overall, near term outlook stays bullish as long as 1.5773 support holds. On the upside, break of 1.6128 will resume the rise from 1.5250, as a correction to fall from 1.9799, to 1.6827 resistance next.
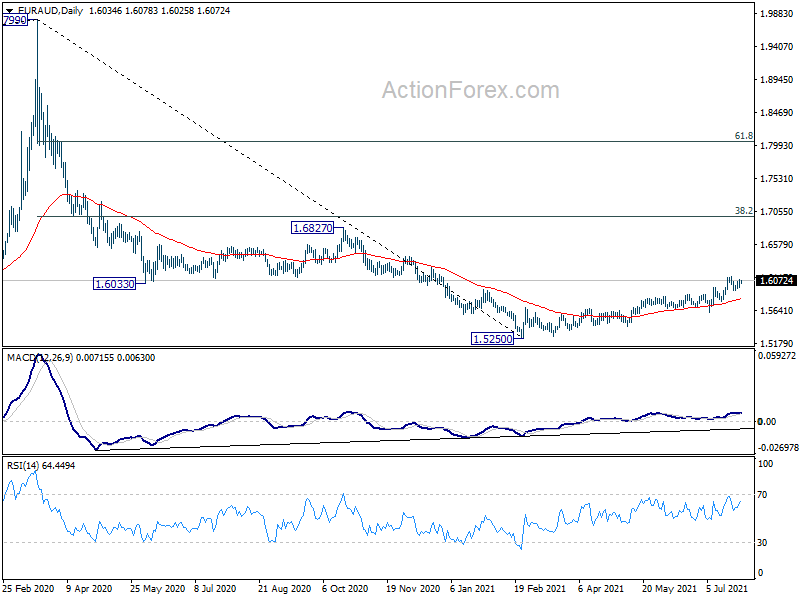
In the bigger picture, current development argues that a medium term bottom is formed at 1.5250, on bullish convergence condition in daily MACD. Rise from 1.5250 is seen as a correction to the down trend from 1.9799 first. Stronger rise would be seen to 38.2% retracement of 1.9799 to 1.5250 at 1.6988 next. This will remain the favored case for now, as long as 1.5614 support holds.
NZDUSD Remains Below 23.6% Fibonacci And Falling Line
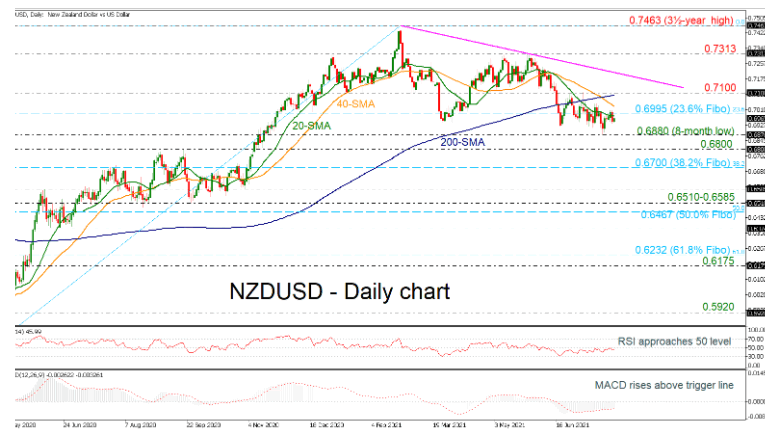
NZDUSD has been in a declining mode after the pullback off the three-and-a-half-year high of 0.7463, sending the price beneath the 23.6% Fibonacci retracement level of the up leg from 0.5470 to 0.7463 at 0.6995. However, the RSI is mirroring the latest rising move and is pointing upwards near the neutral threshold of 50, while the MACD is extending its positive bias above its trigger line.
The 0.7000-0.7100 area, where the 20- and 200-day SMAs reside, could challenge any bullish attempts. The descending trend line is also in the neighborhood, holding near the 0.7175 barrier. Hence, any breakout at this point may gather extra interest, with the price likely speeding up to 0.7313 before the 0.7463 resistance come on the radar.
Alternatively, an extension lower would strengthen the case for a down-trending market, likely activating a fresh bearish wave towards the eight-month low of 0.6880 and 0.6800. Failure to hold above that floor could case another negative extension towards the 38.2% Fibonacci of 0.6700.
In brief, although the eight-month low has downgraded the short-term outlook to slightly bearish, upside corrections cannot be ruled out in the near term according to the technical indicators.
EUR/GBP Daily Outlook
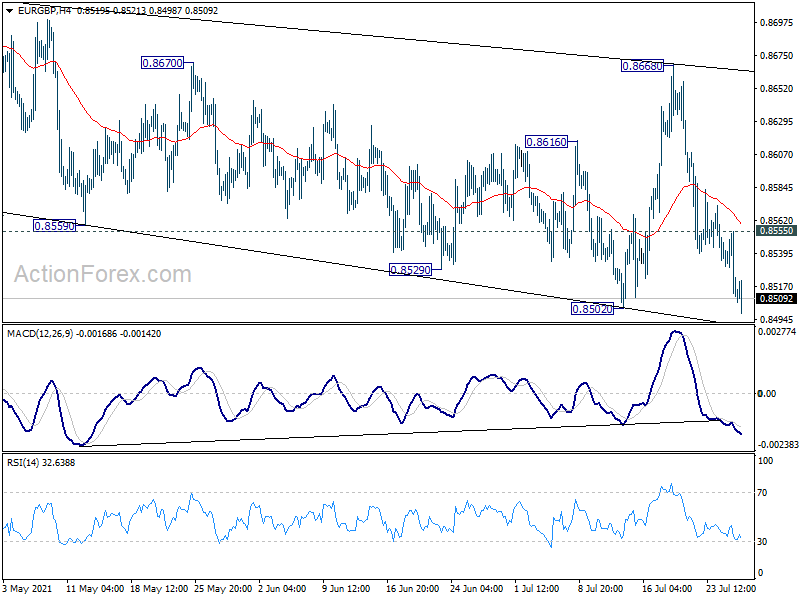
Daily Pivots: (S1) 0.8499; (P) 0.8527; (R1) 0.8543; More...
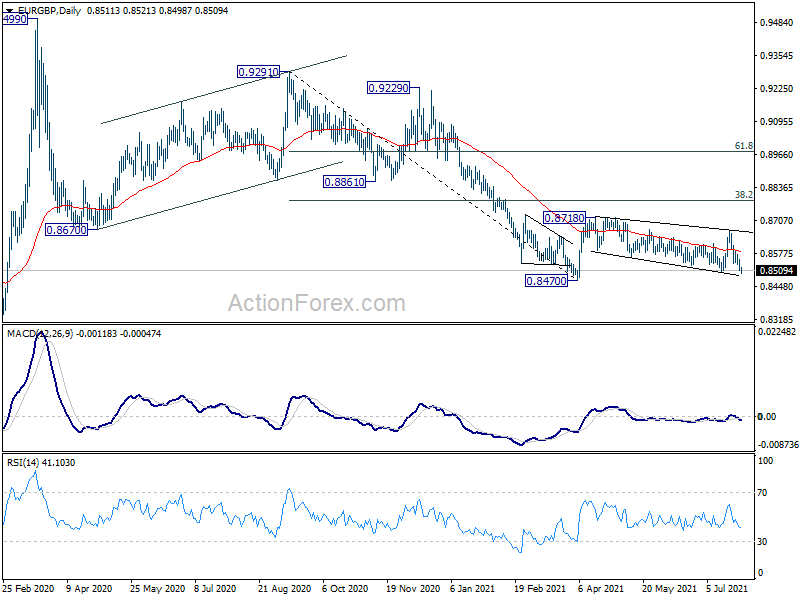
EUR/GBP's breach of 0.8502 suggests that choppy corrective fall from 0.8718 is resuming. Intraday bias is back on the downside for retesting 0.8470 low. On the upside, above 0.8555 minor resistance will turn intraday bias neutral again first. But risk will stay mildly on the downside as long as 0.8668 resistance holds.
In the bigger picture, price actions from 0.9499 are still seen as developing into a corrective pattern. That is, up trend from 0.6935 (2015 low) would resume at a later stage. This will remain the favored case as long as 0.8276 support holds. However, firm break of 0.8276 support will suggest that rise from 0.6935 has completed and turn medium term outlook bearish.
EUR/CHF Daily Outlook
Daily Pivots: (S1) 1.0796; (P) 1.0809; (R1) 1.0820; More....
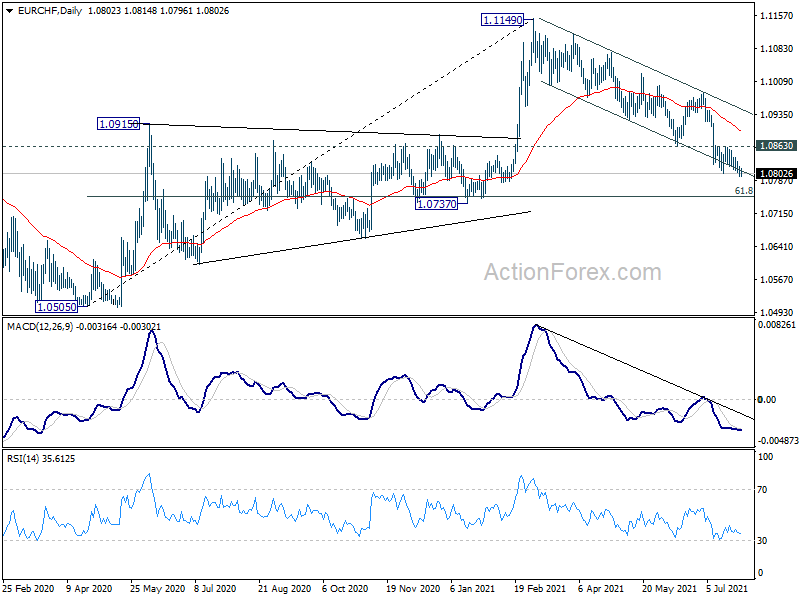
Intraday bias in EUR/CHF remains on the downside at this point. Current fall from 1.1149 is in progress for 1.0737 cluster support next. On the upside, break of 1.0863 resistance is needed to indicate short term bottoming. Otherwise, outlook will stay bearish in case of recovery.
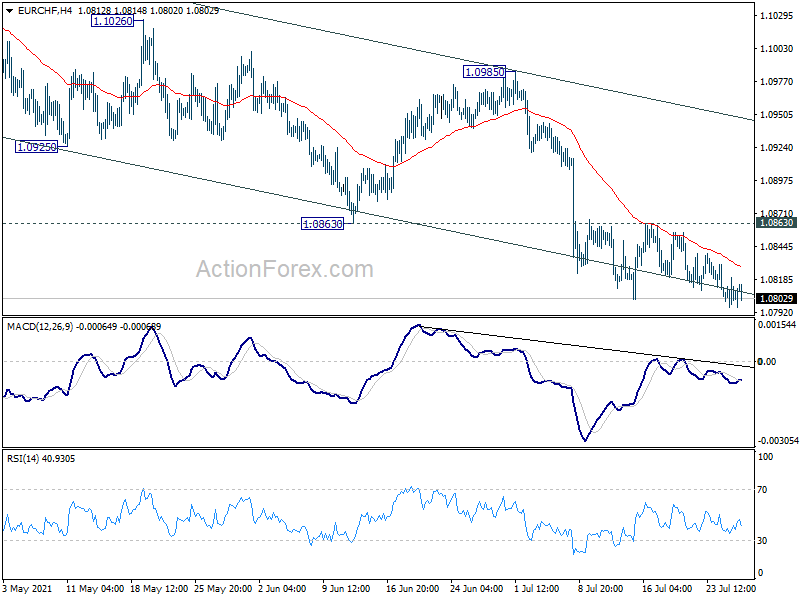
In the bigger picture, current development argues that rebound from 1.0505 (2020 low) might be completed with three waves up to 1.1149 already, after hitting 1.1078 long term fibonacci level. On the downside, sustained trading below 55 week EMA (now at 1.0880) will affirm this bearish case. Further break of 1.0737 cluster support (61.8% retracement of 1.0505 to 1.1149 at 1.0751) will bring retest of 1.0505 low.
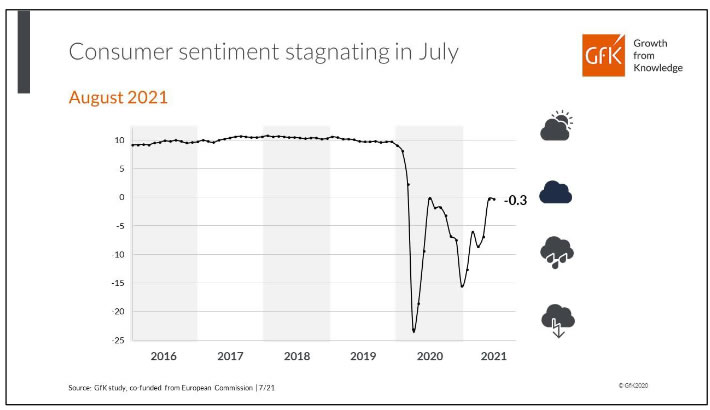
Germany Gfk consumer sentiment unchanged at -0.3, slowing vaccinations limit improvement
Germany Gfk consumer sentiment for August was unchanged at -0.3. In July, economic expectations dropped from 58.4 to 54.6. Income expectations dropped from 34.1 to 29.0. Propensity to buy rose from 13.4 to 14.8. .
Rolf Bürkl, a GfK consumer expert commented on this observation: "The phase where the decrease of COVID-19 incidence of infection has come to an end and those figures are again on the rise. In addition, the momentum for vaccination has recently slowed down considerably, despite there being sufficient quantities of the vaccine available. This is currently preventing any further significant increase as it pertains to consumer sentiment."
Fed Comments Set To Revive Markets And Tenew The Dollar’s Trend
Global markets seem to be in a phase where they are starting to live separately from economic reports and indicators. Otherwise, it is hard to explain why markets remained under pressure yesterday, despite very positive news.
The International Monetary Fund raised its estimate for the GDP growth in 2022 from 4.4% to 4.9% after a 6% growth this year. Forecasts for this year were improved for the USA (from 6.4% to 7.0%), the Eurozone (from 4.4% to 4.6%), and the UK (from 5.3% to 7%). At the same time, China's growth forecast has lowered from 8.4% to 8.1%, remaining at very high levels.
US house prices are going up at full speed, adding another 1.7% in May, according to FHFA estimates. Another well-respected survey, the Case-Shiller index, noted a 17% YoY increase in home prices in the largest US metropolitan areas, close to the record 17.1% achieved in 2004.
Along with house prices, consumer confidence is rising. The Conference Board index is at 129.1 in July compared to a peak of 132.6 in February 2020. 130-140 is the area of the historical highs that the index reached in 2018 and 2000. These are levels of peak optimism, and a subsequent reversal of sentiment could trigger a significant correction in the markets.
Of course, market corrections are triggered not by consumer's elation but by its cooling off. The logical response of policymakers to market records and consumer optimism would be to cut back on crisis support measures, and their unnecessarily rapid unwinding could trigger such a peak.
Still, there is not much reason for such fears so far as US lawmakers have been in no hurry to withdraw support but are considering all new stimulus packages. China has today reassured investors in the markets that there are no systemic risks to be feared and that a "crackdown" on several IT companies does not mean war on private business and stock markets. As a result, the Hang Seng index reversed to intraday gains, retreating from 12-month lows.
Also, the currency market is in a lull ahead of the Fed's decision and comments on Wednesday evening. The continuation of the regulator's soft stance could reinforce the dollar's pullback from the highs of the range since November. If the Fed gives a clear signal of QE rollback, the dollar will return to growth and breakthrough resistance. Thanks to the prolonged consolidation since the beginning of the month, players pulled stop orders close to current levels, risking increased volatility.
Daily Tecnical Analysis
EUR/USD
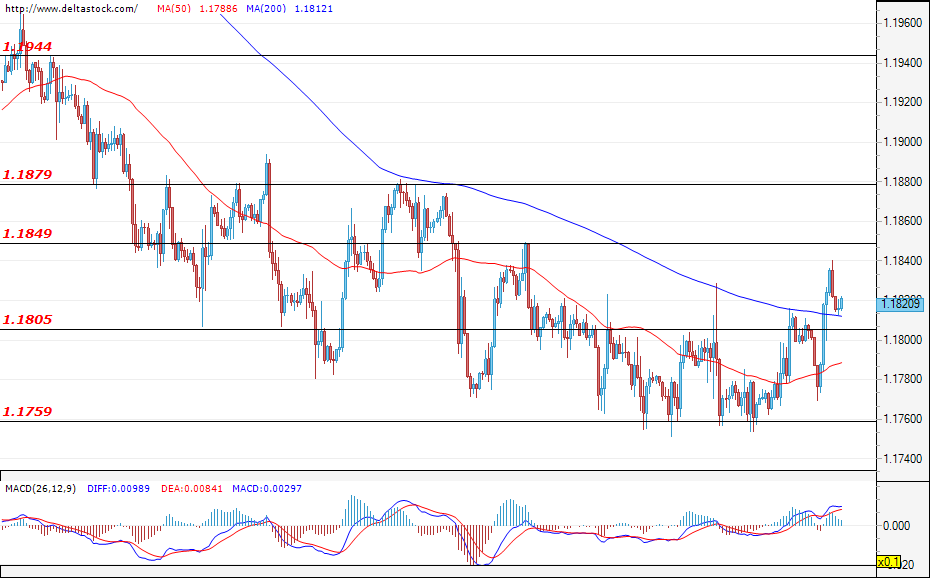
Current level - 1.1820
The bulls prevailed during yesterday's trading session and the successful breach of the resistance zone at 1.1805 led to new gains for the euro against the greenback. At the time of writing, the pair is sitting just above the mentioned level, which is currently acting as a support zone. If the bears enter the market, the corrective phase should be limited by this support.. If this proves to be the case and the mentioned support holds, the pair will most likely head towards the resistance zone at 1.1850 - 1.1880. The Fed interest rate decision that will be announced today at 18:00 GMT and the following press conference (18:30 GMT) will be of great importance for the value of the U.S. dollar. Sharp moves in either direction can be expected then as we find out whether the current high levels of inflation are transitory and if there will be any hints of the Fed taking a more hawkish stance.
| Resistance | Support | ||
| intraday | intraweek | intraday | intraweek |
| 1.1849 | 1.1879 | 1.1800 | 1.1717 |
| 1.1879 | 1.1944 | 1.1760 | 1.1600 |
USD/JPY
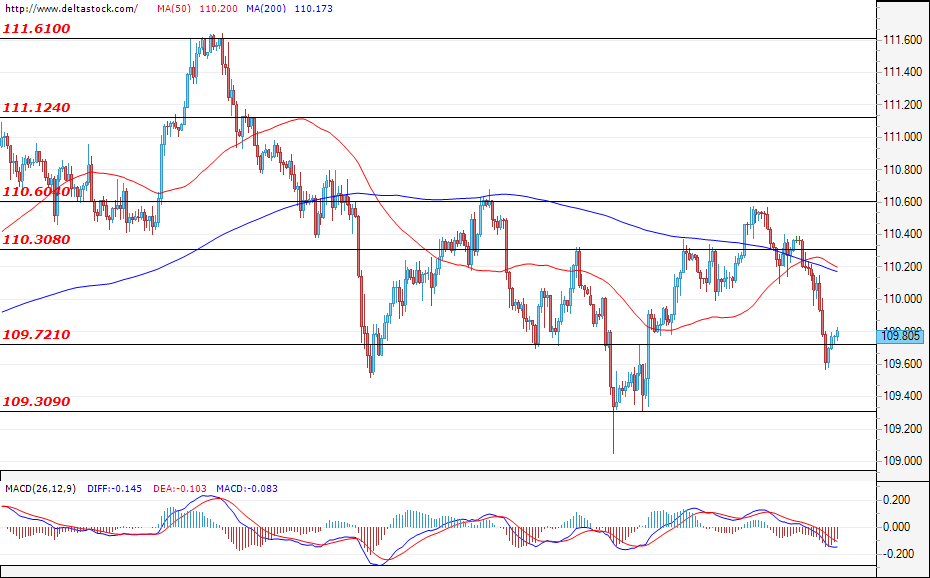
Current level - 109.80
During yesterday's trading session the Japanese yen appreciated against the U.S. dollar and the pair tested the support at 109.72. However a breach of this level did not happen. If the currency pair holds above the mentioned support, then a test of the resistance at 110.30 will be the most probable scenario. In case the support at 109.72 gets breached, a decline towards the next support at 109.30 can be expected.
| Resistance | Support | ||
| intraday | intraweek | intraday | intraweek |
| 110.30 | 111.12 | 109.72 | 108.55 |
| 110.60 | 111.61 | 109.30 | 108.10 |
GBP/USD
Current level - 1.3844
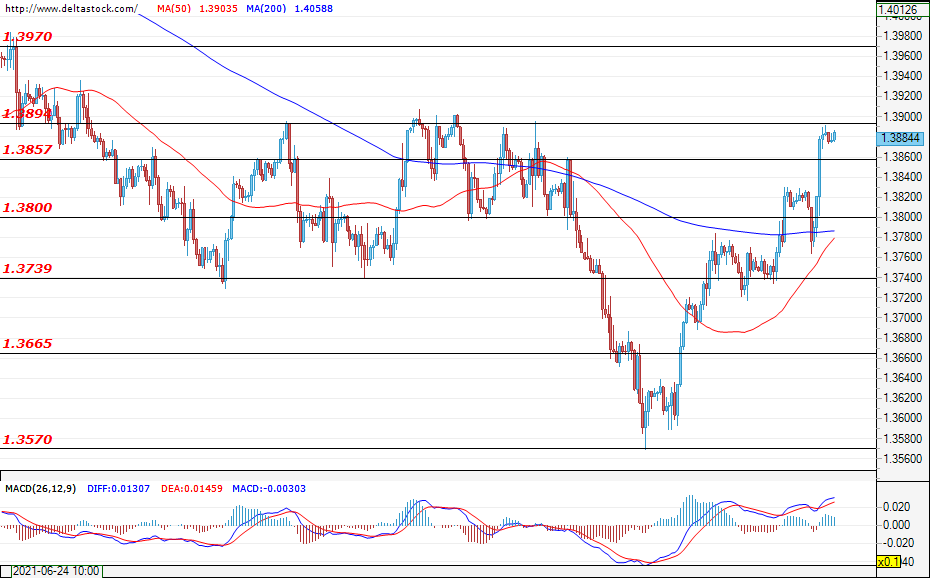
The sterling continues to appreciate against the dollar and, at the time of writing, the currency pair is on the verge of testing the resistance at 1.3894. If the bulls prevail and manage to overcome this critical level, then the currency pair would probably head towards a test of the resistance at 1.3970. However, before this level gets breached and the upward movement continues, it is possible for the GBP/USD to enter a corrective phase and test the support level of 1.3800.
| Resistance | Support | ||
| intraday | intraweek | intraday | intraweek |
| 1.3894 | 1.3970 | 1.3857 | 1.3739 |
| 1.3970 | 1.4000 | 1.3800 | 1.3665 |
USD/CAD Bullish Sentiment
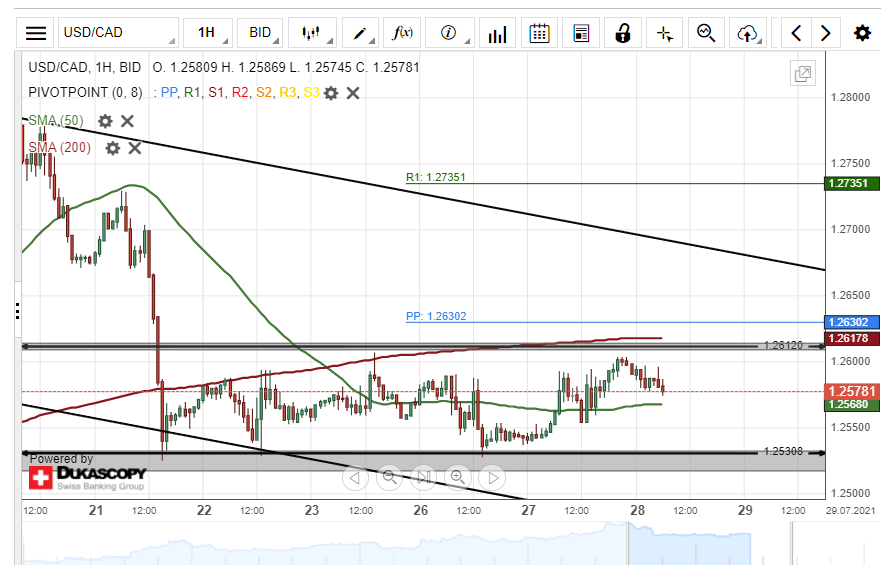
On Tuesday, the US Dollar surged by 61 pips or 0.49% against the Canadian Dollar. The currency pair breached the 50– hour simple moving average at 1.2567 during Tuesday's trading session.
Buyers are likely to continue to drive the USD/CAD exchange rate higher during the following trading session. The possible target for long traders would be near the 1.2660 level.
However, the 200– hour SMA at 1.2617 might provide resistance for the currency exchange rate within this session.
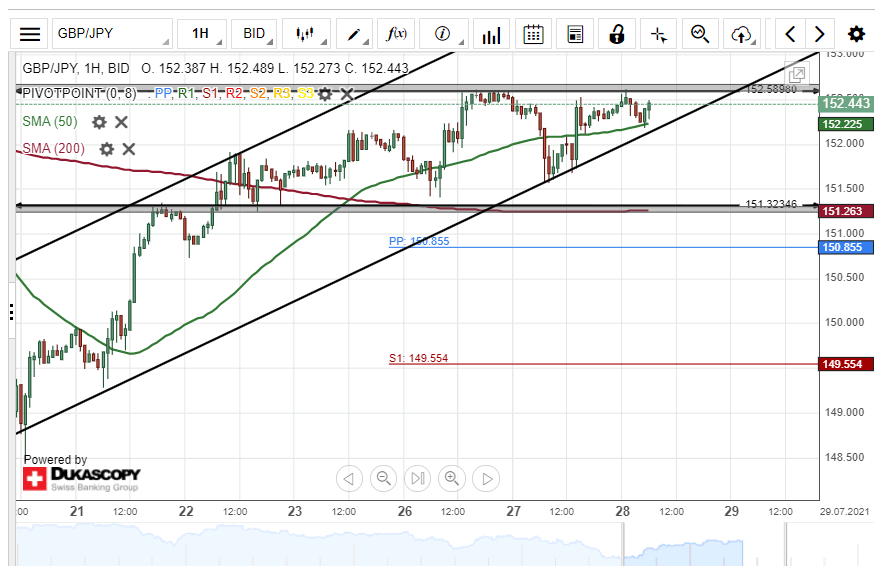
GBP/JPY Potential Target At 153.50
On Tuesday, the British Pound edged higher by 84 pips or 0.55% against the Japanese Yen. The exchange rate tested the resistance level at 152.68 during Tuesday's trading session.
The currency pair could continue to surge in an ascending channel pattern during the following trading session. The potential target for the GBP/JPY pair will be near the weekly resistance level at 153.25.
However, bullish traders might still encounter resistance at 152.58 within Wednesday's trading session.