

Sample Category Title
GBP/USD Daily Outlook
Daily Pivots: (S1) 1.3758; (P) 1.3796; (R1) 1.3855; More....
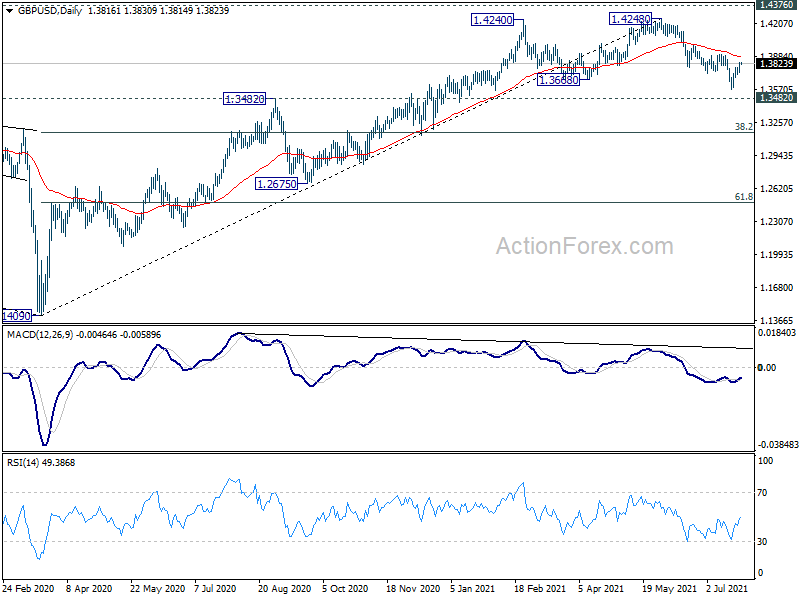
GBP/USD rises further today as rebound from 1.3570 extends. Focus is now on 1.3908 resistance. Firm break there will argue that fall from 1.4248 has completed. Intraday bias will be turned back to the upside for retesting this high. On the downside, below 1.3719 minor support will turn bias to the downside for 1.3570. Break there will resume the fall from 1.4248 to 1.3482 resistance turned support first.
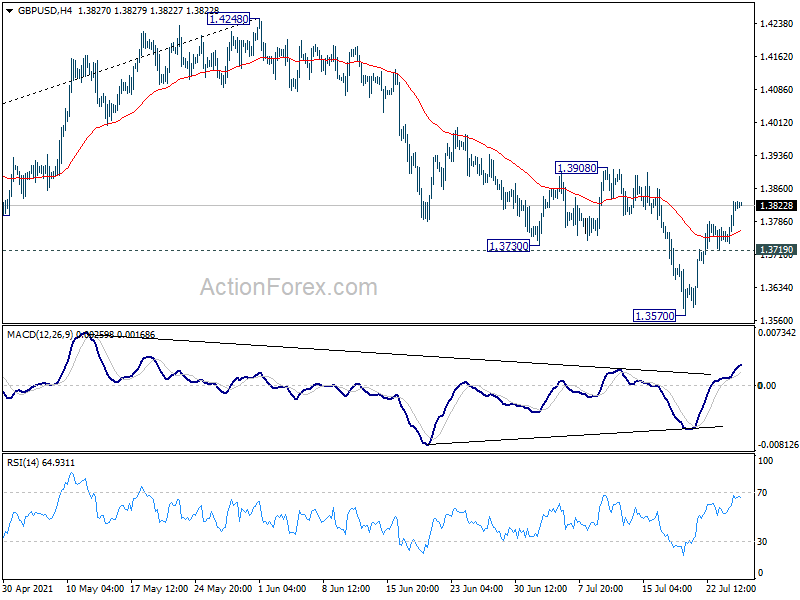
In the bigger picture, as long as 1.3482 resistance turned support holds, up trend from 1.1409 should still continue. Decisive break of 1.4376 resistance will carry larger bullish implications. However, firm break of 1.3482 support will argue that the rise from 1.1409 has completed. GBP/USD would then be seen in another leg of long term range pattern between 1.1409 and 1.4376. Deeper fall could then be seen to 61.8% retracement of 1.1409 to 1.4248 at 1.2493, and even below.
Nasdaq 100 Futures Tilt Higher After Strong Tesla Earnings
US stock futures rose as bond yields declined and after Tesla published strong quarterly results. Futures linked to the Dow Jones rose by 25 points while those tied to the S&P 500 added 10 points. Meanwhile., US 10-year bond yield declined to 1.25% while the 30-year yield declined to 1.90%. At its peak this year, the 10-year rose to 1.776%. Therefore, this decline is a sign that investors are pricing in a lower inflation rate and a relatively dovish Federal Reserve in the near term. The Fed will start its meeting today and deliver its decision tomorrow.
US stocks are also tilting higher after Tesla published strong quarterly results as it overcame higher costs and supply shortages. The company made close to $12 billion in revenue in the second quarter, higher than the median estimate of $11.2 billion. The firm’s gross margin increased to 28.4%, which was substantially higher than in the first quarter. As a result, Tesla’s operating profit rose to more than $1.3 billion while net income rose to $1.4 billion. The earning season will continue this week, with companies like Ecolab, Archer-Daniels-Midland, Waste Management, Raytheon, Pulte Group, Microsoft, Amazon, and AMD set to publish.
Bitcoin retreated from a six-year high during the overnight session as investors took profit. The coin’s price declined to $36,920 from this week’s high of almost $40,000. Other altcoins like Ether, Cardano, and Ripple have also retreated. Bitcoin rose sharply during the weekend after bullish comments from people like Elon Musk and Cathie Wood. Speaking at the B Word conference, he said that he remained bullish on Bitcoin and that SpaceX had also bought some coins. Amazon also confirmed that it was looking at the crypto industry. Its adoption would incentivize other firms to start accepting it. Later today, Bitcoin, US dollar and stocks will react to the latest US consumer confidence data.
ETHUSD
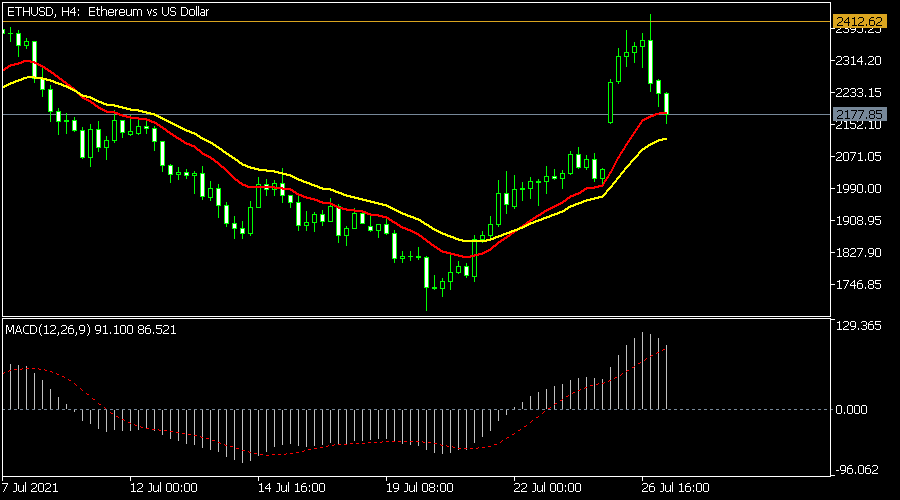
The ETHUSD pair declined to 2,170, which was lower than this week’s high of 2,433. On the 4 hour chart, the pair is forming a cup and handle pattern. It is now at the handle section of this pattern. Also, it has moved to the 25-day and 15-day moving averages while the MACD is above the neutral level. Therefore, the pair will likely resume the upward trend later this week. A bullish breakout will be confirmed when the price rises above this week’s high at 2,433.
NDX100
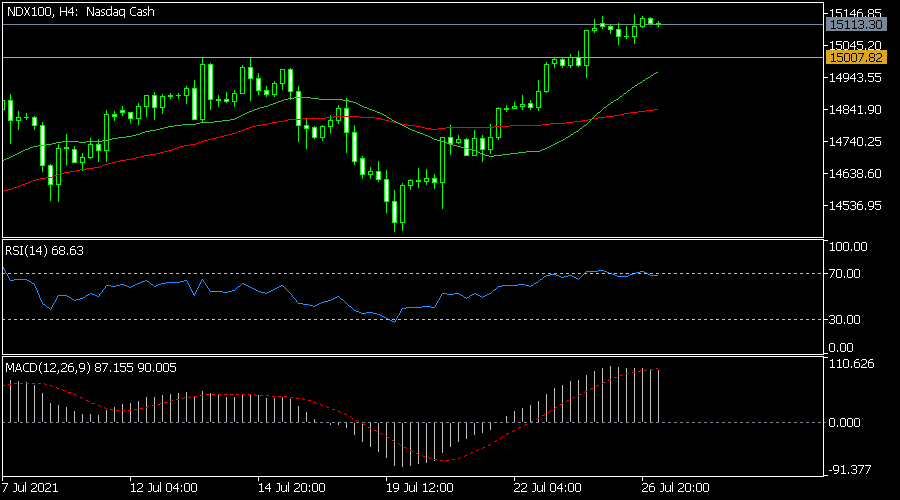
The Nasdaq 100 index is hovering near its all-time high after the strong quarterly results by Tesla. It is trading at $15,113, which was slightly below the all-time high of $15,143. On the 4 hour chart, the index has moved above the short and long-term moving averages while the RSI and MACD have continued rising. The price is also above the important resistance at $15,000, which was highest on July 14. Therefore, the index will likely maintain an upward momentum as earning season continues.
EURUSD
The EURUSD continued its consolidation phase ahead of the latest consumer confidence and FOMC decision data. The pair is trading at 1.1803, which was along the upper side of the falling wedge pattern. The MACD and the RSI have also tilted upwards modestly. The pair will likely remain in this range and then break out higher after the FOMC decision.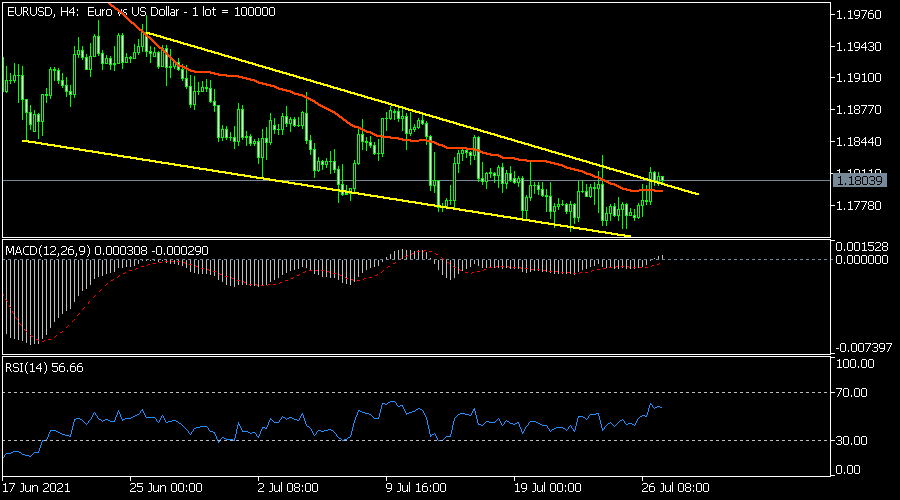
USD/CHF Daily Outlook
Daily Pivots: (S1) 0.9137; (P) 0.9170; (R1) 0.9191; More....
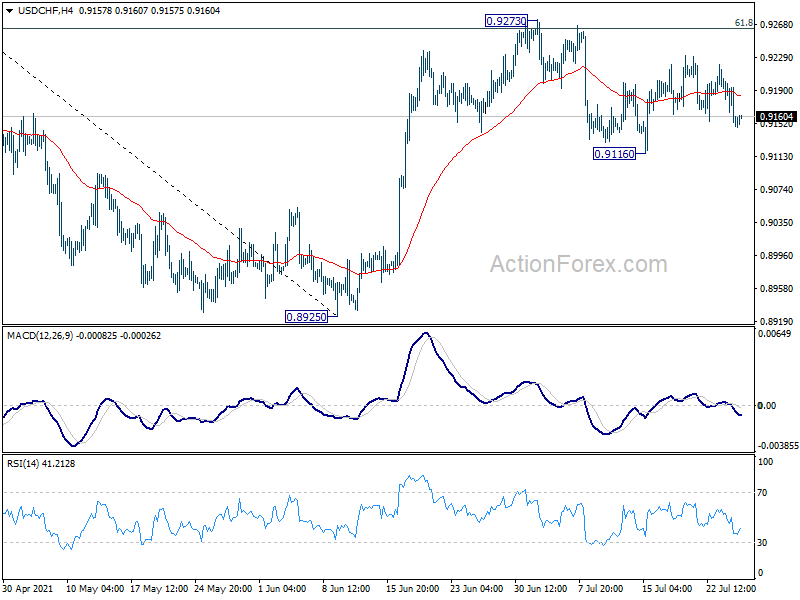
USD/CHF is staying in range of 0.9116/9273 and intraday bias remains neutral for the moment. On the downside, break of 0.9116 support will affirm the case that rebound from 0.8925 has completed at 0.9273. Deeper fall would then be seen back to retest 0.8925 low. On the upside, however, break of 0.9273 and sustained trading above 61.8% retracement of 0.9471 to 0.8925 at 0.9262 will target 0.9471 resistance next.
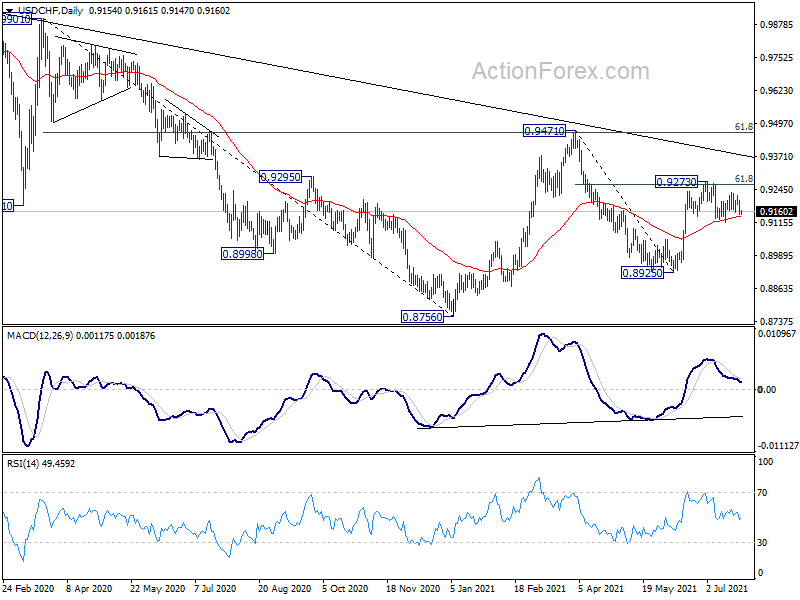
In the bigger picture, medium term outlook is currently neutral with focus on 0.9471 resistance. Sustained break there will indicate completion of whole decline from 1.0342 (2016 high). Medium term outlook will be turned bullish for a test on 1.0342 high. But, rejection by 0.9471 again will revive bearishness for another fall through 0.8756 low.
BTCUSD Still Bullish
Technical analysis
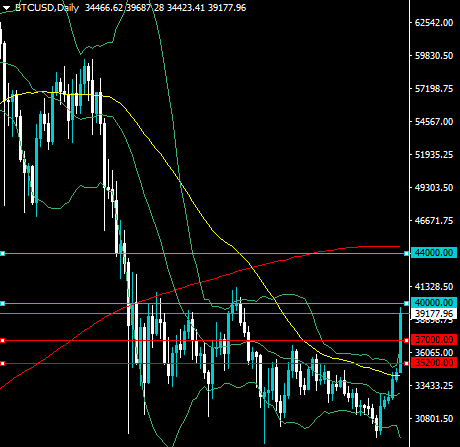
The BTCUSD pair has staged a breakout above the upper daily Bollinger Band. Daily Bollinger Band breakouts can lead to powerful one-way directional breakout.
Price is now above the 50-day moving average, with bulls now increasingly likely to target the BTCUSD pair’s 200-day moving average, around the $44,000 level.
What the possible outcomes are
In our most likely scenario, the BTCUSD pair breaks above the $40,000 level and then heads towards its key 200-day moving average.
Alternatively, the BTCUSD pair may pullback towards the upper daily Bollinger Band around the $35,200 level, and then start to advance its 200-day moving average.
Key levels
Support $37,000 $35,200
Resistance $40,000 $44,000
NZDUSD Very Bullish
Technical analysis
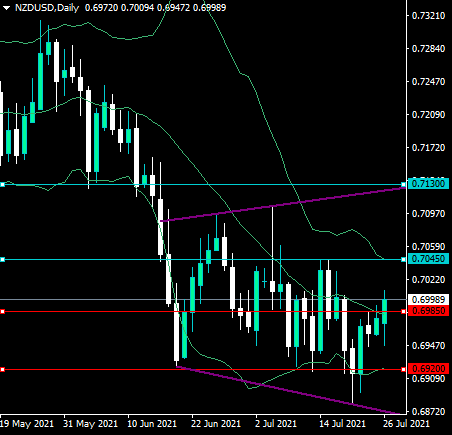
The NZDUSD pair has broken above the psychological 0.7000 level and the mid-line of the upper daily Bollinger Band, which is now located around the 0.6985 support area.
Bulls could be preparing to take the NZDUSD pair towards the top of a broadening wedge or megaphone style pattern, around the 0.7120 resistance level.
What the possible outcomes are
In our most likely scenario, the NZDUSD pair will rally towards the top of the broadening wedge pattern, around the 0.7120 level before staging a meaningful price correction.
Alternatively, the NZDUSD could test the mid-line of the Bollinger Band before rallying towards the top of the broadening wedge pattern.
Key levels
Support 0.6985 0.6920
Resistance 0.7045 0.7130
GBPUSD Bullish Bias
Technical analysis
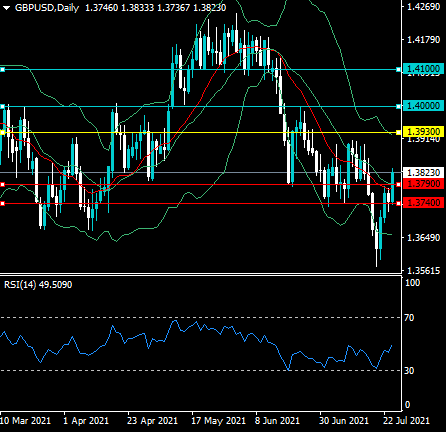
The GBPUSD pair has broken above the mid-line of the daily Bollinger Band and could start to target the upper Bollinger Band, around the 1.3930 resistance level.
Bullish MACD price divergence extends until the 1.4000 resistance level, while the daily RSI indicator is rising and is close to crossing above the 50 reading needed for a buy signal.
What the possible outcomes are
In our most likely scenario, the GBPUSD pair will rally towards the 1.3930 and 1.4000 level over the medium-term before a correction takes place..
Alternatively, the GBPUSD pair corrects back towards the mid-line on the Bollinger Band indicator, around the 1.3790 support region before rally again.
Key levels
Support 1.3790 1.3740
Resistance 1.3930 1.4000
XAUUSD Is Probably Bearish
Technical analysis
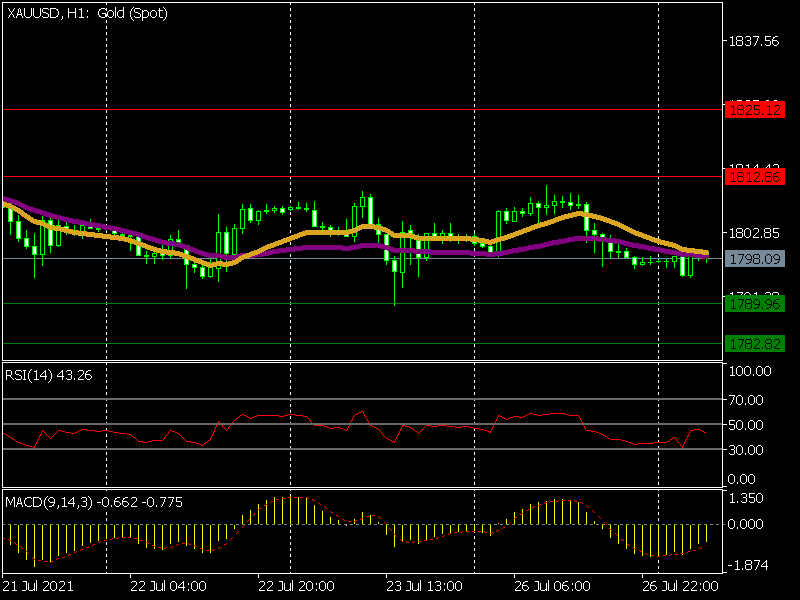
The EMA(100) is higher than the EMA(50), which is advantageous for bears
These lines cross, which is favourable for opening an order
The MACD is below 0, with the signal line pointing up
The RSI is below 50.
What the possible outcomes are
XAUUSD is defending 1,800 for the third consecutive day. As the investors are cautious about opening new positions, the pair is under pressure before the FOMC outcome. The near-term picture is still bearish.
At the moment, the price may decline toward the first support level of 1,789.96. Beneath lies the second support level of 1,782.82.
If bulls defend the support level of 1,789.96, the price may reverse towards the resistance level of 1,812.86. A breakout of that level can push the price higher towards 1,825.12.
Key levels
Support 1,789.96 1,782.82
Resistance 1,812.86 1,825.12
Elliott Wave View: GBPJPY Ended Correction
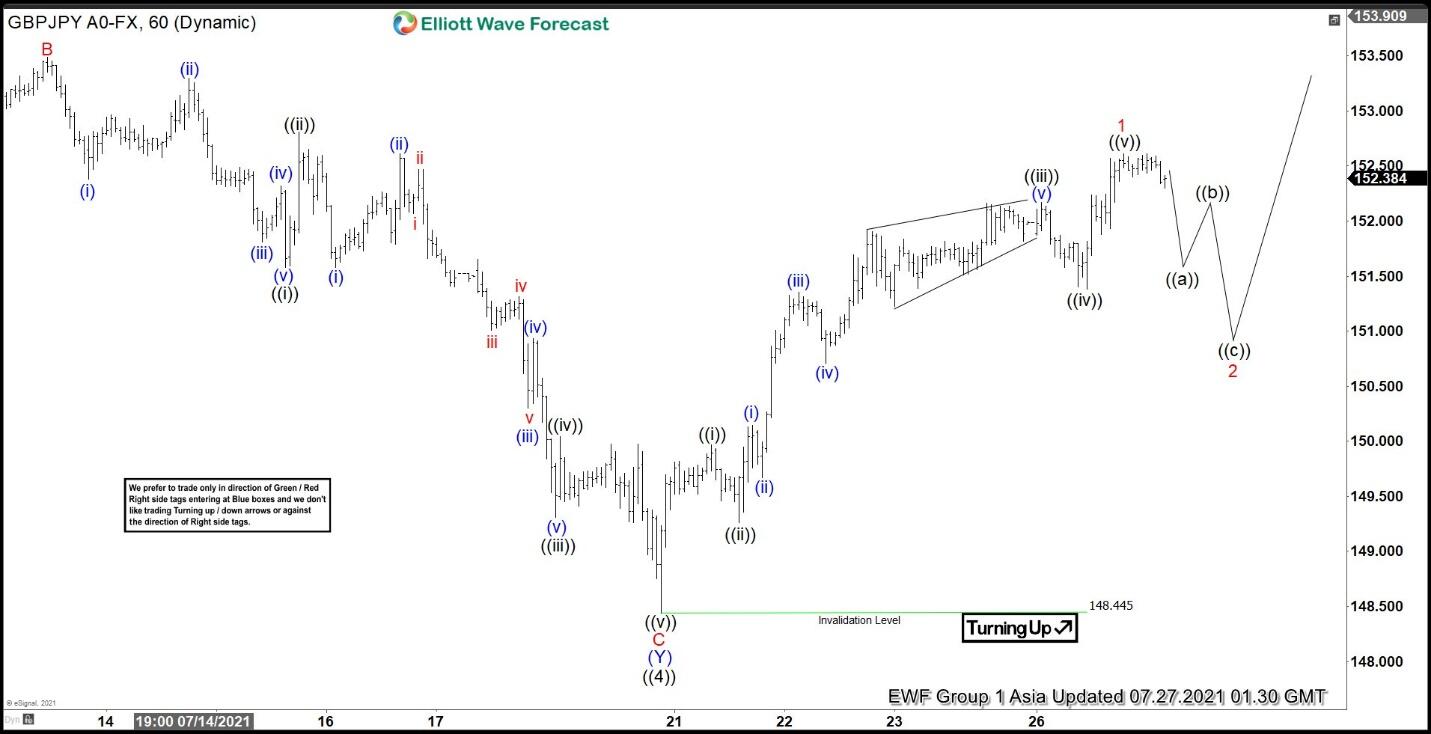
Short Term Elliott Wave in GBPJPY suggests that the correction from May 27, 2021 peak has ended in wave ((4)) at 148.44. The internal subdivision of wave ((4)) took the form of a double three Elliott Wave structure. Down from wave ((3)) peak on May 27, wave (W) ended at 151.32 and rally in wave (X) ended at 155.15. Final leg lower wave (Y) ended at 148.46 which should complete wave ((4)). The pair has started wave ((5)) higher but still needs to break above wave ((3)) at 156.07 to rule out a larger double correction.
Up from wave ((4)), wave ((i)) ended at 149.96 and pullback in wave ((ii)) ended at 149.26. Pair resumes rally higher in wave ((iii)) towards 152.16, and pullback in wave ((iv)) ended at 151.38. Expect final leg higher wave ((v)) of 1 to end soon. Afterwards, it should pullback in wave 2 to correct the entire rally from July 20 low before the rally resumes in wave 3. Near term, as far as wave ((4)) low pivot at 148.44 remains intact, expect dips to find support in 3, 7, or 11 swing for further upside.
GBPJPY 60 Minutes Elliott Wave Chart
GBP/USD Could Gain Traction Above 1.3850
Key Highlights
- GBP/USD started an upside correction from the 1.3570 region.
- A key bearish trend line is in place with resistance near 1.3830 on the 4-hours chart.
- EUR/USD must clear 1.1820 and 1.1850 for a decent upward move.
- AUD/USD and NZD/USD are showing signs of a fresh recovery.
GBP/USD Technical Analysis
The British pound extended its decline below 1.3650 before it found support against the US Dollar. GBP/USD tested the 1.3570 zone and it recently started a steady recovery.
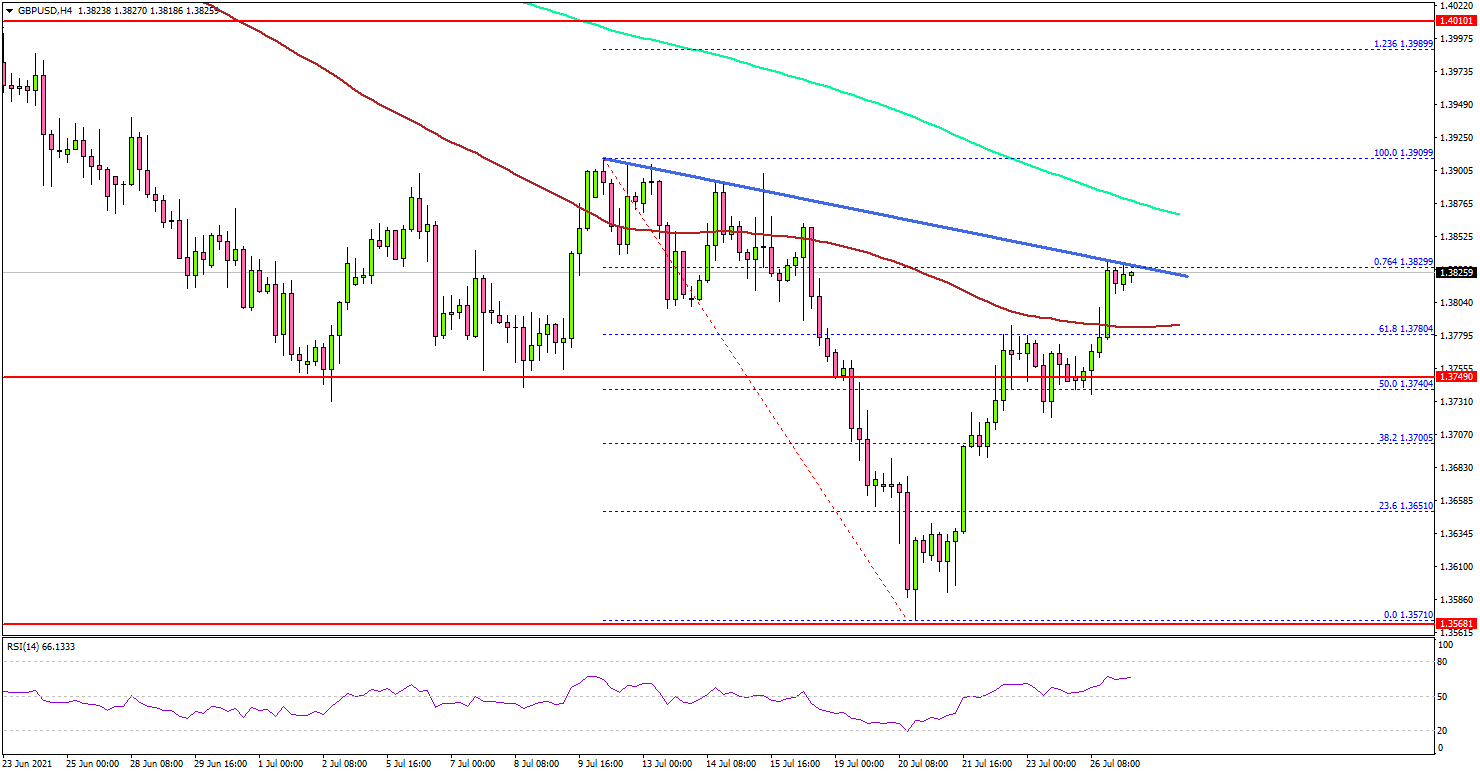
Looking at the 4-hours chart, the pair traded as low as 1.3571 and settled well below the 200 simple moving average (green, 4-hours). Recently, it started a strong recovery wave above the 1.3650 resistance.
There was a clear break above the 50% Fib retracement level of the key decline from the 1.3909 swing high to 1.3571 low. The pair even climbed above the 1.3800 level and the 100 simple moving average (red, 4-hours).
It tested the 76.4% Fib retracement level of the key decline from the 1.3909 swing high to 1.3571 low. There is also a key bearish trend line in place with resistance near 1.3830 on the same chart.
If GBP/USD settles above 1.3850 and the 200 simple moving average (green, 4-hours), it could accelerate higher. The next major resistance is near the 1.4000 level.
If not, there could be a fresh decline below the 1.3800 level. An initial support is near the 1.3780 level. The next major support is near the 1.3745 level.
Looking at EUR/USD, the pair could start a steady increase if there is a clear break above the 1.1820 and 1.1850 resistance levels.
Economic Releases
- US Durable Goods Orders for June 2021 – Forecast +2.1% versus +2.3% previous.
- US Durable Goods Orders ex Defense for June 2021 – Forecast +1.5% versus +1.7% previous.
Market Morning Briefing: Aussie Has Immediate Resistance At 0.74
STOCKS
Dow has broken above 35100 and will be bullish to test 36000 while this break sustains. DAX and Nikkei have room to move up within their 15300-15800 and 27000-29500 range respectively. Shanghai has tumbled below 3500 but has strong support at 3400 which can hold and keep the broader uptrend intact. Sensex and Nifty hovers at the upper end of their 52000-53200 and 15600-15900 range respectively. We expect them to break their ranges on the upside and see a fresh rally. The outcome of the US Federal Reserve meeting tomorrow will be crucial to watch. Any hint on stimulus tapering could trigger sell-off/corrective fall in equities. We will have to wait and watch.
Dow (35144.31, +82.76, +0.24%) has broken above 35100 as expected. While this break sustains, our bullish view is intact of seeing a rise to 36000 and higher levels in the coming days. 34000 can itself be a good support now and then the deeper one is at 33000.
DAX (15618.98, −50.31, -0.32%) oscillates around 15600 and has room to move up towards 15800 in the near-term. The 15300-15800 range remains intact. We expect DAX to break this range on the upside and rise to 16000-16200 eventually going forward.
Nikkei (27977.07, +143.78, +0.52%) is moving up within the 27000-29500 range. A strong rise past 28000 can take it to the upper end of its range. The bias is bullish to see an upside break above 29500 and see a rise to 31000 and higher levels over the medium-term. As mentioned yesterday, only a break below 27000 will turn the outlook bearish to see 26000 on the downside.
Shanghai (3463.76, −3.69, -0.11%) tumbled to a low of 3424.74 yesterday and has bounced from there. It can consolidate in a range of 3400-3500 for some time. 3400 is a strong support while above which the long-term view is bullish to see a break above 3625 and a rise to 3700-3800. Only a break below 3400 will negate the bullish view.
Sensex (52852.27, -123.53, -0.23%) has come-off from the high of 53103.42 yesterday. The 52000-53200 range remains intact for now. We expect Sensex to break 53200 and rise to 54000 and higher levels going forward. In case if 53200 continues to hold, the sideways range can continue for some more time and the expected rise to 54000 will get delayed.
Nifty (15824.45, −31.60, -0.20%) is retaining its 15600-15900 range for now and is stuck in a narrow range of 15800-15900 within it. We retain our bullish view of seeing an upside breakout of this range above 15900 and see a fresh rise to 16000-16200 in the coming weeks.
COMMODITIES
Crude prices trade higher today with Brent having scope to test 75-76 while WTI has resistance at 74 from where rejection is expected in the near to medium term. Gold and Silver have dipped today and could fall to supports of 1780 and 25 but it would be important to see if the respective supports hold and produce a bounce back to higher levels or pave way for a break on the downside. Copper has surged well and if the rise continues, we may expect the rise to extend towards 4.80.
Brent (74.82) and WTI (72.11) both have risen well today. Brent can rise towards 75-76 while WTI can rise towards 74 before again coming off from there in the near term. Failure to fall from expected levels would be strongly bullish for a possible extension towards $78-80 in the longer run. For now watch price action near mentioned resistances.
Gold (1796) has fallen sharply within 1820-1780 range that we have been mentioning over the last few days. A test of 1780 looks possible over the next few sessions but we need to watch price action closely to see if it manages to bounce from 1780 or decides to break on the downside which would be indicative of a strong bearishness for the longer run. For now, 1780 is an important support.
Silver (25.18) has dipped today but we look for a range of 25-26 to hold in the near term. Any break below 25 would take it sharply lower towards 24-23 in the longer run. Watch price action near 25 closely.
Copper (4.6070) has surged to 4.60 in line with our expectations. If copper continues to rise, breaking above 4.60, then near term view is bullish to see a test of 4.80 levels.
FOREX
Dollar Index trades near immediate support at 92.60/50 which needs to break for the index to head lower, else a bounce back to 93-93.30 looks possible while the support holds. Euro has risen above 1.18 and could be headed towards 1.1850 if the Dollar Index falls from current levels. Aussie and Pound look bullish for the very near term but has their respective resistances which could soon produce rejection. EURJPY can face rejection at 130.5 and head towards 129. USDCNY has fallen from 6.4872 and can hold within 6.49/50-6.46/45 in the near term. USDINR can break below 74.40 to head towards 74.20 or lower.
Dollar Index (92.60) trades just above immediate support at 92.50 and needs to bounce back from here to keep the 92.50-93.30 rage intact for now. Failure to bounce from 92.50 can take it down to 92 slowly in the near term. We need a break on either side of the 92.50-93.30 region to decide on further direction.
Euro (1.1802) has moved above 1.18 instead of breaking below 1.1770 to test 1.1750 mentioned yesterday. This is positive for the Euro and could take it up towards 1.1850. Thereafter, a break above 1.1850 will be needed to indicate further bullishness for the medium term. Watch for a possible rise in Euro in the near term.
EURJPY (130.09) is likely to face rejection from 130.50 and fall back towards 129.50 in the near term. Broader range of 130.50-128.50 is likely to hold for some more time.
Dollar-Yen (110.32) may hold within 110.80-110.00 for the very near term while downside support is seen near 109.50-109.00.
Aussie (0.7378) has immediate resistance at 0.74 and while that holds, Aussie can again head lower towards 0.73 in the near term. A narrow range of 0.74-0.73 holds for now.
Pound (1.3821) has bounced well breaking above 1.38. It can rise further to test 1.3850-1.39 in the near term; 1.39 being a crucial resistance that could produce a fall back towards 1.38. Immediate view is bullish towards 1.39.
USDCNY (6.4751) has dipped from 6.4872, unable to break above 6.49. This could keep the broad range of 6.49/50-6.46/45 active for some more time until we see a sharp break on either side to give clarity on further direction. Immediate view is to see a sideways range.
USDINR (74.4225) held above 74.40 yesterday but could not sustain to see a sharp bounce on the upside. Today as Euro and Chinese Yuan trade strong against the US Dollar, it is positive for Rupee. USDINR may break below 74.40 today and head towards 74.30/20 on the downside. Immediate view is bearish for USDINR on a break below 74.40. NDF currently quotes at 74.32.
INTEREST RATES
The US Treasury yields are inching up ahead of the US Federal Reserve meeting outcome tomorrow. Any hint of stimulus tapering could trigger a sharp rise in the yields. The outcome of the Fed meeting tomorrow could be a key trigger in setting the direction of the move going forward. The German yields remain lower and have room to dip further within their current downtrend. The 10Yr GOI sustains above 6.2% with muted trading and the 5Yr GOI looks mixed and can oscillate in a broad range.
The US 2Yr (0.19%), 5Yr (0.72%), 10Yr (1.28%) and 30Yr (1.94%) Treasury yields have moved up slightly. Our view of seeing a corrective bounce to 2.1%-2.2% (30Yr) and 1.45%-1.5% (10Yr) remains intact. Supports are at 1.9% (30Yr) and 1.2% and 1.1% (10Yr).
The German 2Yr (-0.74%), 5Yr (-0.71%), 10Yr (-0.42%) and 30Yr (0.06%) continues to trade stable and lower and keeps the bearish view intact. There is room within the current fall to test -0.45%/-0.50% (10Yr) and 0%/-0.05% (30Yr) on the downside. Thereafter a corrective bounce to -0.30%/-0.25% (10Yr) and 0.10% (30Yr) is possible before the broader downtrend resumes again.
The 10Yr GoI (6.2255%) sustains above 6.2% amid muted trading and keeps the chances alive of seeing 6.3%-6.32% on the upside. The 5Yr GOI (5.6809%) is stuck in a narrow range of 5.66%-5.7% over the last few days. We expect it to oscillate in a broad range of 5.64%-5.72% for some time.