Sample Category Title
BoE Vlieghe: Appropriate to keep current stimulus in place for several quarters at least
BoE MPC member Gertjan Vlieghe reiterated in a speech that the current inflation peak is "likely to be temporary". The supply bottlenecks and base effects are "set to wane next year".
Also, the UK is "not out of the woods yet" in terms of the virus and the impact of the economy. He added that most recent data indicated that economy remains "an average recession away from full employment". The delta variant is "still causing health and economic damage".
Also, various government support schemes are "coming to an end", he said, "I would want to see how the economy copes with that, before adding monetary tightening on top of fiscal tightening".
Hence, he said, "it will remain appropriate to keep the current monetary stimulus in place for several quarters at least, and probably longer". "When tightening does become appropriate, I suspect not much of it will be needed, given the low level of the neutral rate."
EUR/JPY Surges As Yen Weakens
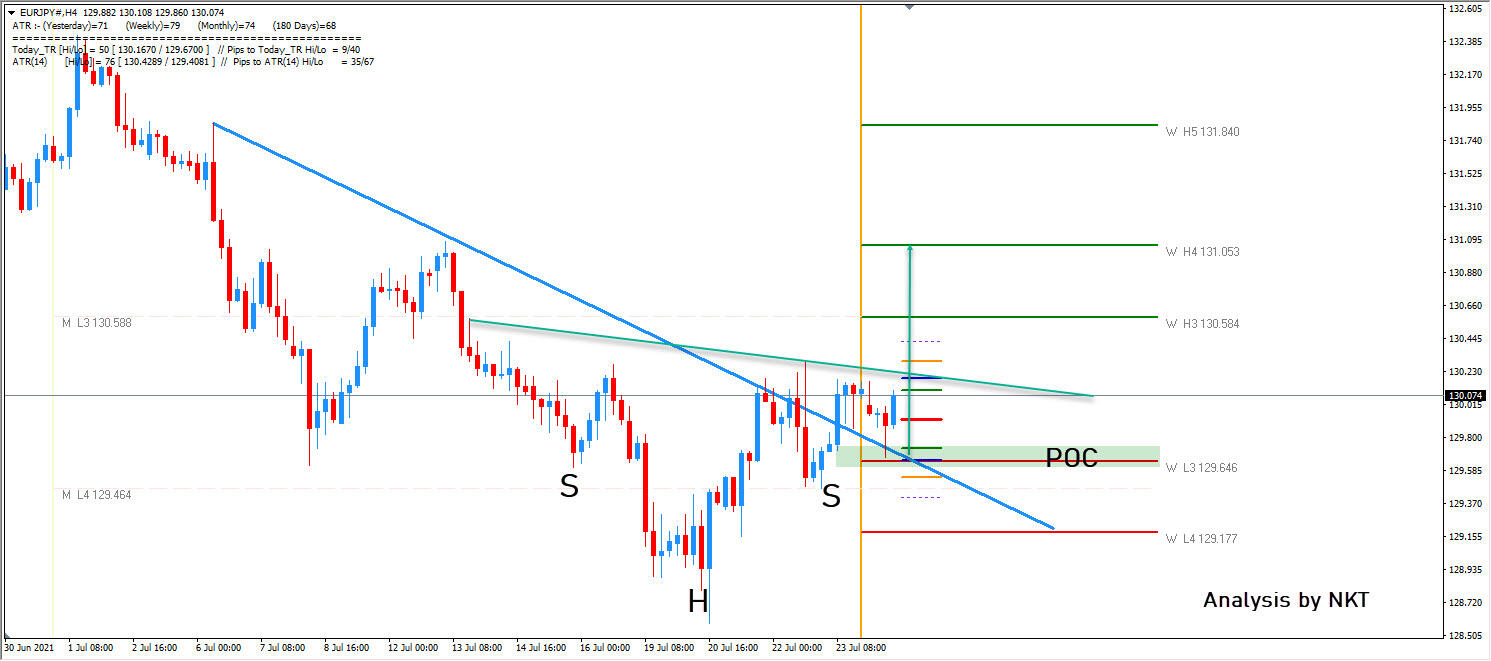
EUR/JPY is trying to breakout above the W L3 which became a support. We could see further strength if the neckline breaks.
The POC is a bouncing zone. 129.65-75 where buyers are. Look for a trend line break and continuation of the move. Targets are 130.42, 130.58 and potentially 131.05. Only if the price breaks below 129.65 we could see a move down which will be a sign of Yen strength.
EUR/AUD Decline Could Continue
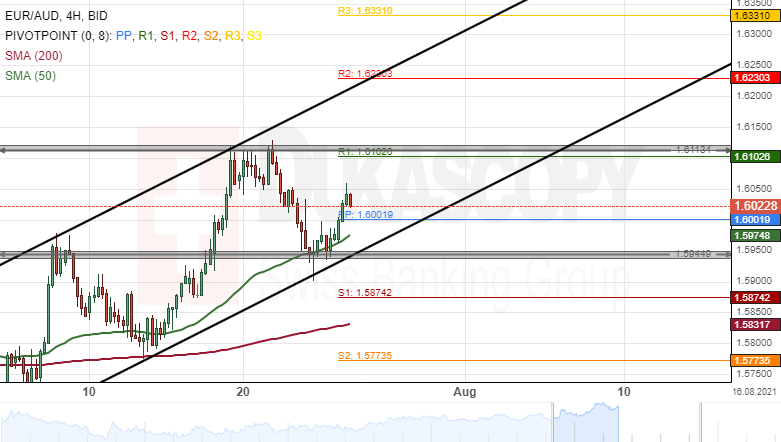
The common European currency declined by 1.10% against the Australian Dollar last week. The currency pair tested a support level formed by the 50– period simple moving average at 1.5965 during last week's trading sessions.
All things being equal, bears could continue to drive the exchange rate lower during this week's trading sessions. The potential target for sellers will be near the 1.5700 level.
However, the 50– period SMA near the 1.5960 area could still provide support for the EUR/AUD currency exchange rate this week.
EUR/CAD Breakout Could Occur
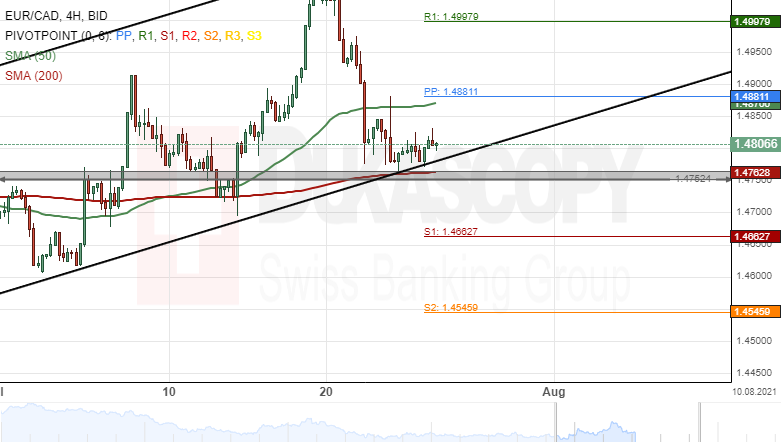
The Eurozone single currency fell by 2.02% against the Canadian Dollar last week. The decline was stopped by the 200– period simple moving average at 1.4762 during last week's trading sessions.
Currently, the exchange rate is trading near the lower boundary of an ascending channel pattern and could be set for a breakout.
If the breakout occurs, a decline towards the 1.4600 level could be expected this week.
However, if the channel pattern holds, buyers might drive the EUR/CAD currency exchange rate higher during the following trading sessions.
EUR/USD Analysis: Support Zone Holds
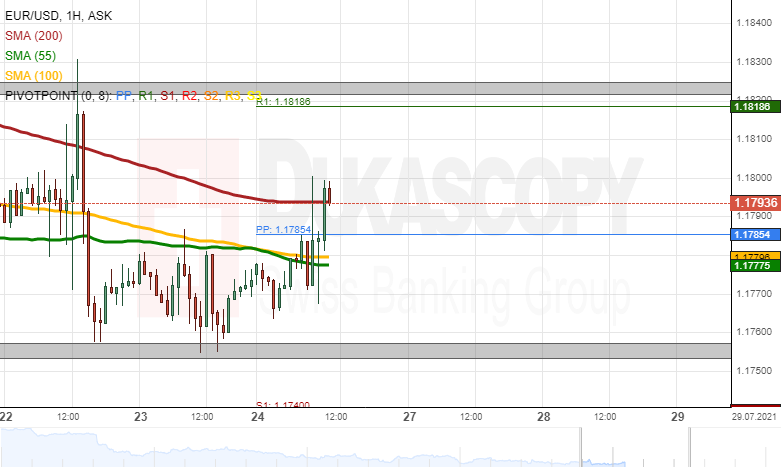
The support of the zone above the 1.1750 mark has held and caused a recovery of the EUR/USD currency exchange rate. By the middle of Monday's European trading hours, the pair had reached the resistance of the 1.1800 mark.
In the case that the surge would continue, the currency exchange rate might reach for the resistance of the weekly R1 simple pivot point at 1.1819 and the late July high level zone above the 1.1820 level.
On the other hand, a potential decline would look for support in the 55 and 100-hour simple moving averages near 1.1775 and afterwards, the support zone near 1.1750.
GBP/USD Analysis: Breaks Pattern
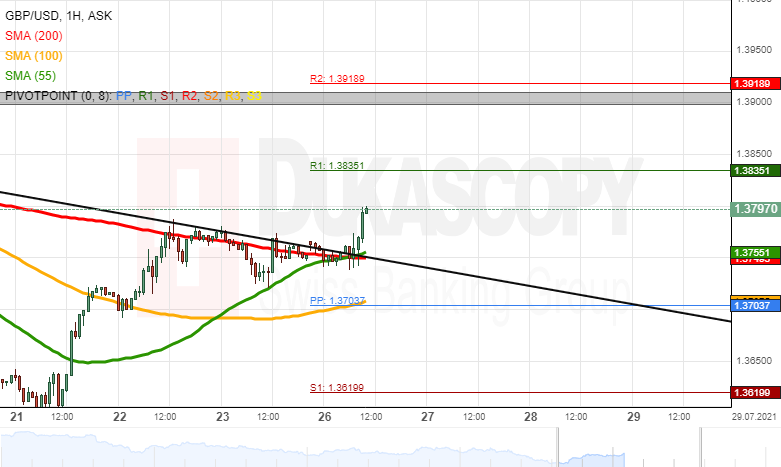
On Monday morning, the GBP/USD currency exchange rate broke the large scale channel down pattern, which had guided the rate since the start of July.
In the near term future, the surge of the rate could reach for the resistance of the 1.3800 mark, which provided both resistance and support throughout July. Afterwards, the weekly R1 simple pivot point at 1.3835 could provide resistance.
Meanwhile, a decline could find support in the combination of the 55 and 200-hour simple moving averages near 1.3750.
USD/JPY Analysis: Finds Support In SMA
On Monday morning, the yellow metal traded above the 1,800.00 level. Meanwhile, support was being provided by the combination of the 100-hour simple moving average and the 1,805.00 level. Resistance was being found in the 1,810.00 level and the 200-hour simple moving average.
If the rate breaks resistance near 1,810.00, the price of the metal could test the upper trend line of a channel down pattern near 1,813.00. Afterwards, the bullion could reach for the late July high level at 1,825.00.
On the other hand, a decline of the metal would most likely find support in the 1,800.00 level and the 55-hour simple moving average.
Gold Analysis: Reaches Above 1,800.00
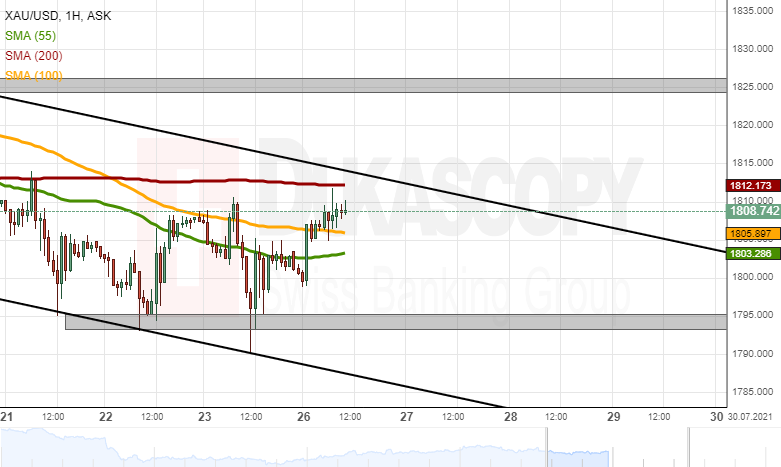
On Monday morning, the yellow metal traded above the 1,800.00 level. Meanwhile, support was being provided by the combination of the 100-hour simple moving average and the 1,805.00 level. Resistance was being found in the 1,810.00 level and the 200-hour simple moving average.
If the rate breaks resistance near 1,810.00, the price of the metal could test the upper trend line of a channel down pattern near 1,813.00. Afterwards, the bullion could reach for the late July high level at 1,825.00.
On the other hand, a decline of the metal would most likely find support in the 1,800.00 level and the 55-hour simple moving average.
USD Remains At 3 ½ Month Highs
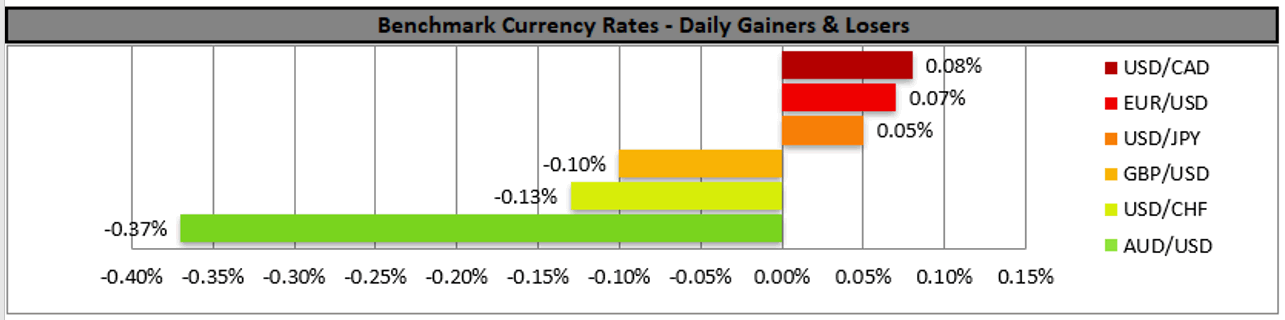
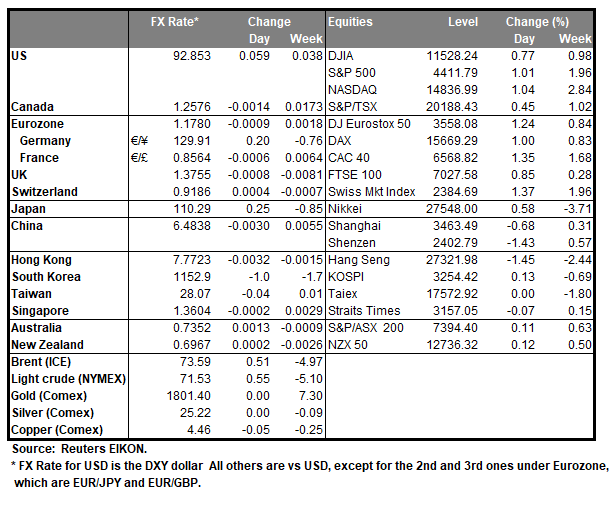
The greenback remained near three and a half month high levels against the common currency in a tight range bound movement as the attention of the financial markets focus is on the release of the Fed’s interest rate decision on Wednesday. The pound weakened against the USD and the EUR on Friday, as July’s preliminary PMI readings showed an unexpected slowdown of economic activity for the month of July spreading disappointment, despite retail sales for June accelerating. The AUD weakened on Friday despite the global risk sentiment improving somewhat, as the ongoing lockdown measures applied for nearly half of Australia’s population tended to weigh on the Australian currency, while also Iron Ore prices fell sharply adding to the worries of Aussie traders. US equities rebounded and ended the week higher on Friday with all three main stock indexes reaching new record highs also supported by the earnings season especially in the tech sector. Gold prices remained rather stable albeit inched higher on Monday, maybe getting some support buy dropping US Treasury yields and rising worries for the Delta variant of Covid.
EUR/USD remained in a rather tight range bound motion just below the 1.1785 (R1) resistance line. We tend to maintain a bias for a sideways motion, given the pair’s movement since the 19th of the month as well as the RSI indicator which remains near the reading of 50, implying a rather indecisive market. Should a selling interest be displayed by the market, we may see the pair breaking the 1.1695 (S1) support line and aim for lower grounds. On the other hand, should buyers take over the initiative over the pair’s direction, we may see the pair breaking the 1.1785 (R1) resistance line and aim if not breach the 1.1885 (R2) resistance level.
AUD/USD retreated on Friday aiming for the 0.7335 (S1) support line. We tend to maintain a bearish outlook for the pair as long as it remains below the downward trendline since the 6th of July. Also note that the RSI indicator below our 4-hour chart is between the reading of 50 and 30, which may imply that the bears may have a slight advantage. Should the bears actually continue to guide the pair’s direction, we may see it breaking the 0.7335 (S1) line and aim for the 0.7265 (S2) support level. If the bulls take over, we may see the pair breaking the downward trendline, the 0.7400 (R1) resistance line and aim for the 0.7465 (R2) level.
Other economic highlights today and the following Asian session:
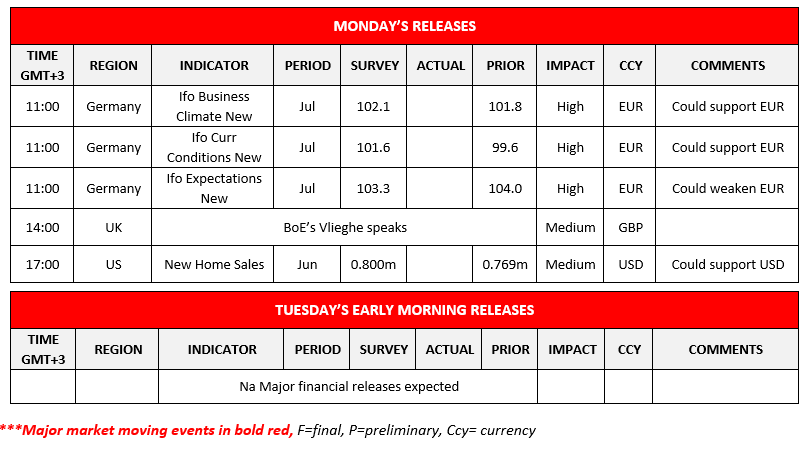
Today we get during the European session Germany’s Ifo indicators for July, while in the American session we get the US new home sales figure for June. On the monetary front we note the planned speech of BoE’s Vlieghe near the end of the European session.
As for the rest of the week
On Tuesday, we get UK’s CBI Distributive trades for July, UK the US durable goods orders for June and the US Consumer Confidence for July. On Wednesday, BoJ is to release the summary of opinions for its last meeting and we get Australia’s CPI rates for Q2, Germany’s GfK Consumer Sentiment for August, Canada’s inflation rates, while in the US the Fed is to release its interest rate decision. On Thursday, we get UK‘s Nationwide house prices for July, Sweden‘s GDP rate for Q2, Eurozone‘s economic sentiment for July, Germany‘s preliminary HICP rate for July, and from the US the GDP advance rate as well as the weekly initial jobless claims figure. On Friday, we get Japan‘s preliminary industrial output for June, France‘s preliminary GDP rate for Q2, Germany’s preliminary GDP rate for Q2, France’s preliminary CPI (EU Normalised) rate for July, Switzerland’s KOF indicator for July, and Eurozone’s preliminary HICP and GDP rates for July and GDP respectively.
EUR/USD H4 Chart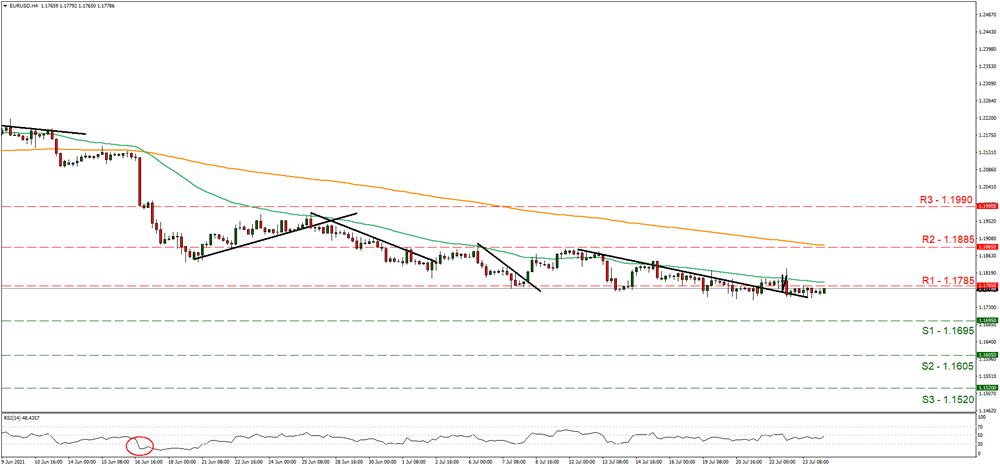
Support: 1.1695 (S1), 1.1605 (S2), 1.1520 (S3)
Resistance: 1.1785 (R1), 1.1885 (R2), 1.1990 (R3)
AUD/USD H4 Chart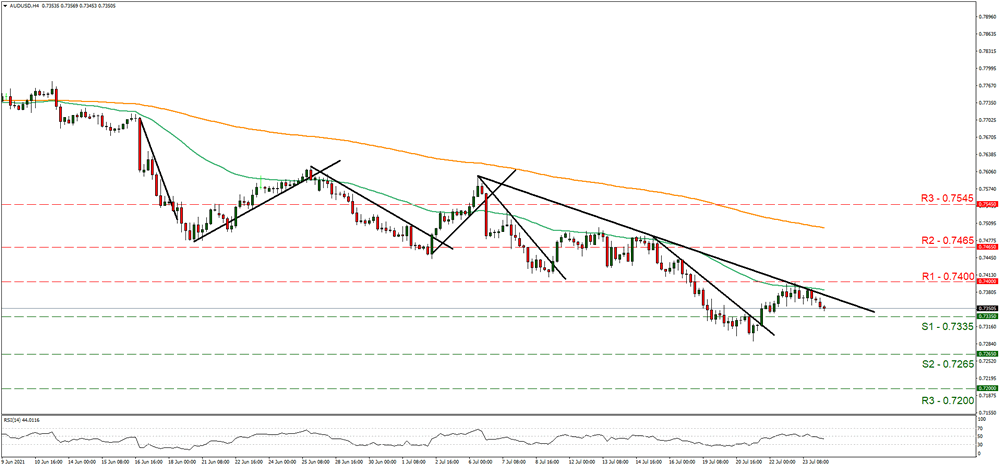
Support: 0.7335 (S1), 0.7265 (S2), 0.7200 (S3)
Resistance: 0.7400 (R1), 0.7465 (R2), 0.7545 (R3)
The Analytical Overview Of The Main Currency Pairs
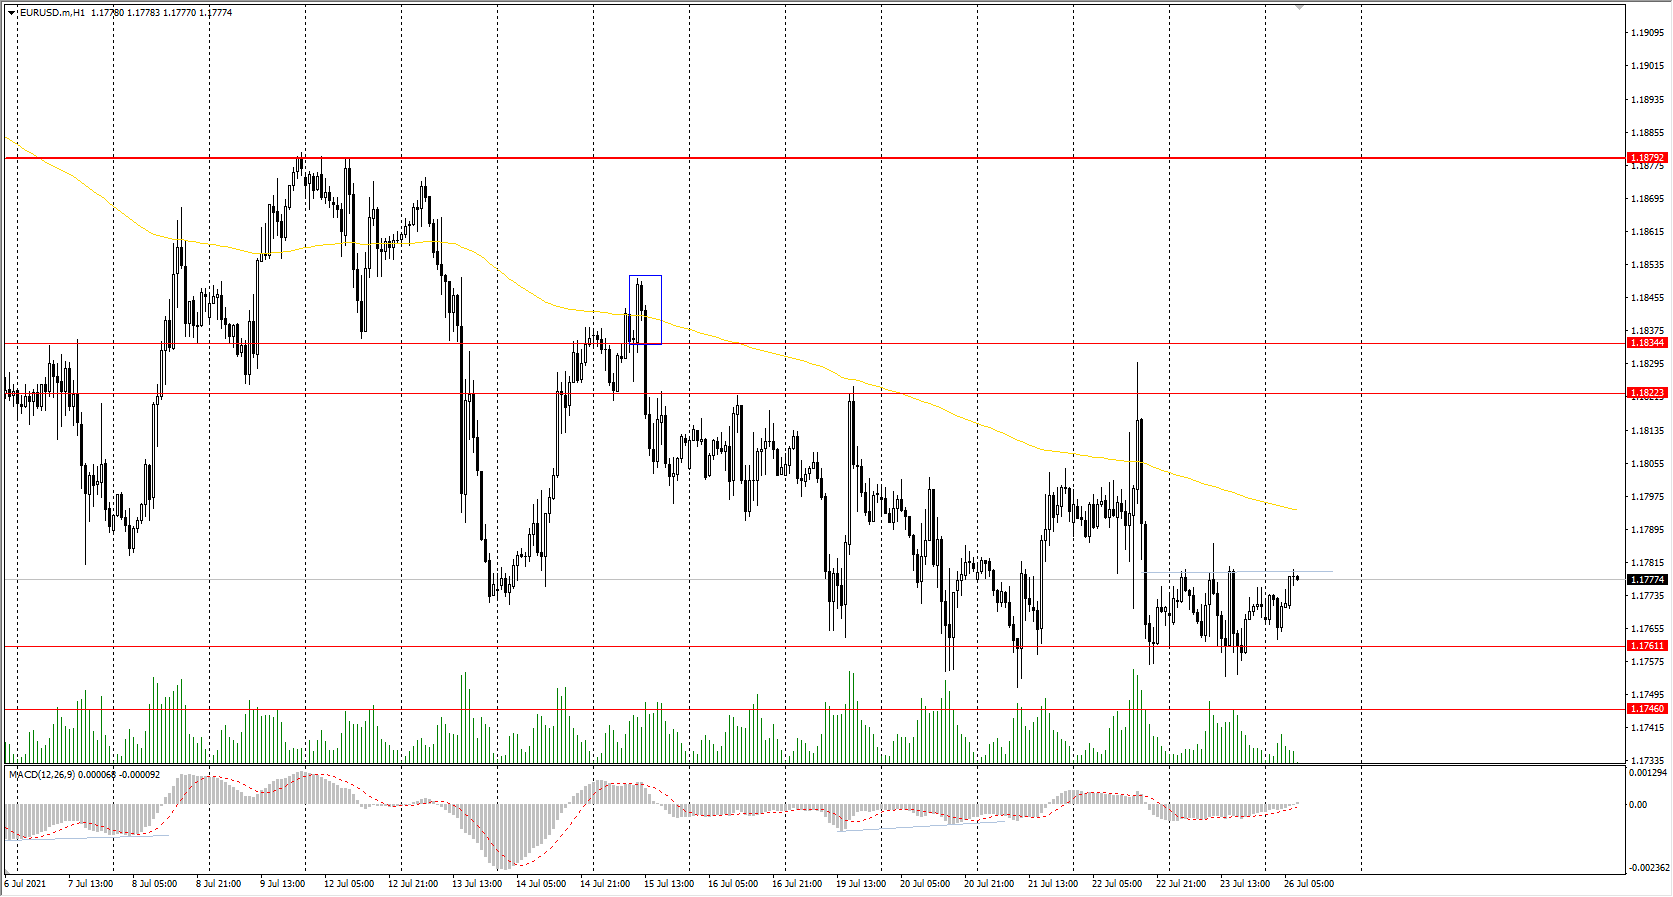
The EUR/USD currency pair
Technical indicators of the currency pair:
Prev Open: 1.1769
Prev Close: 1.1771
% chg. over the last day: +0.02%
Compared to Friday, the situation on the EUR/USD currency pair has not changed. Last week, the ECB hinted at a longer period of monetary support, as a new wave of the coronavirus pandemic could pose a risk to eurozone economic recovery. But Friday's business activity (PMI) data showed a positive growth trend, jumping to the highest level since June 2006.
Trading recommendations
Support levels: 1.1761, 1.1746, 1.1609
Resistance levels: 1.1822, 1.1834, 1.1879, 1.1934, 1.1969
From the technical point of view, the trend is still bearish. Now the price is trading in a narrow range within a broader 1.1761-1.1823 price range. The negative situation for the European currency remains unchanged, but short-term upward movements are not excluded. In such market conditions, traders should look for the sell positions from the resistance levels. Buy positions can be considered only on the intraday timeframes after the price breaks through the narrow range upwards.
Alternative scenario: if the price breaks through the 1.1879 resistance level and fixes above, the general uptrend is likely to be resumed.
News feed for 2021.07.26:
- Germany Ifo Business Climate Index (m/m) at 11:00 (GMT+3);
- US New Home Sales (m/m) at 17:00 (GMT+3).
The GBP/USD currency pair
Technical indicators of the currency pair:
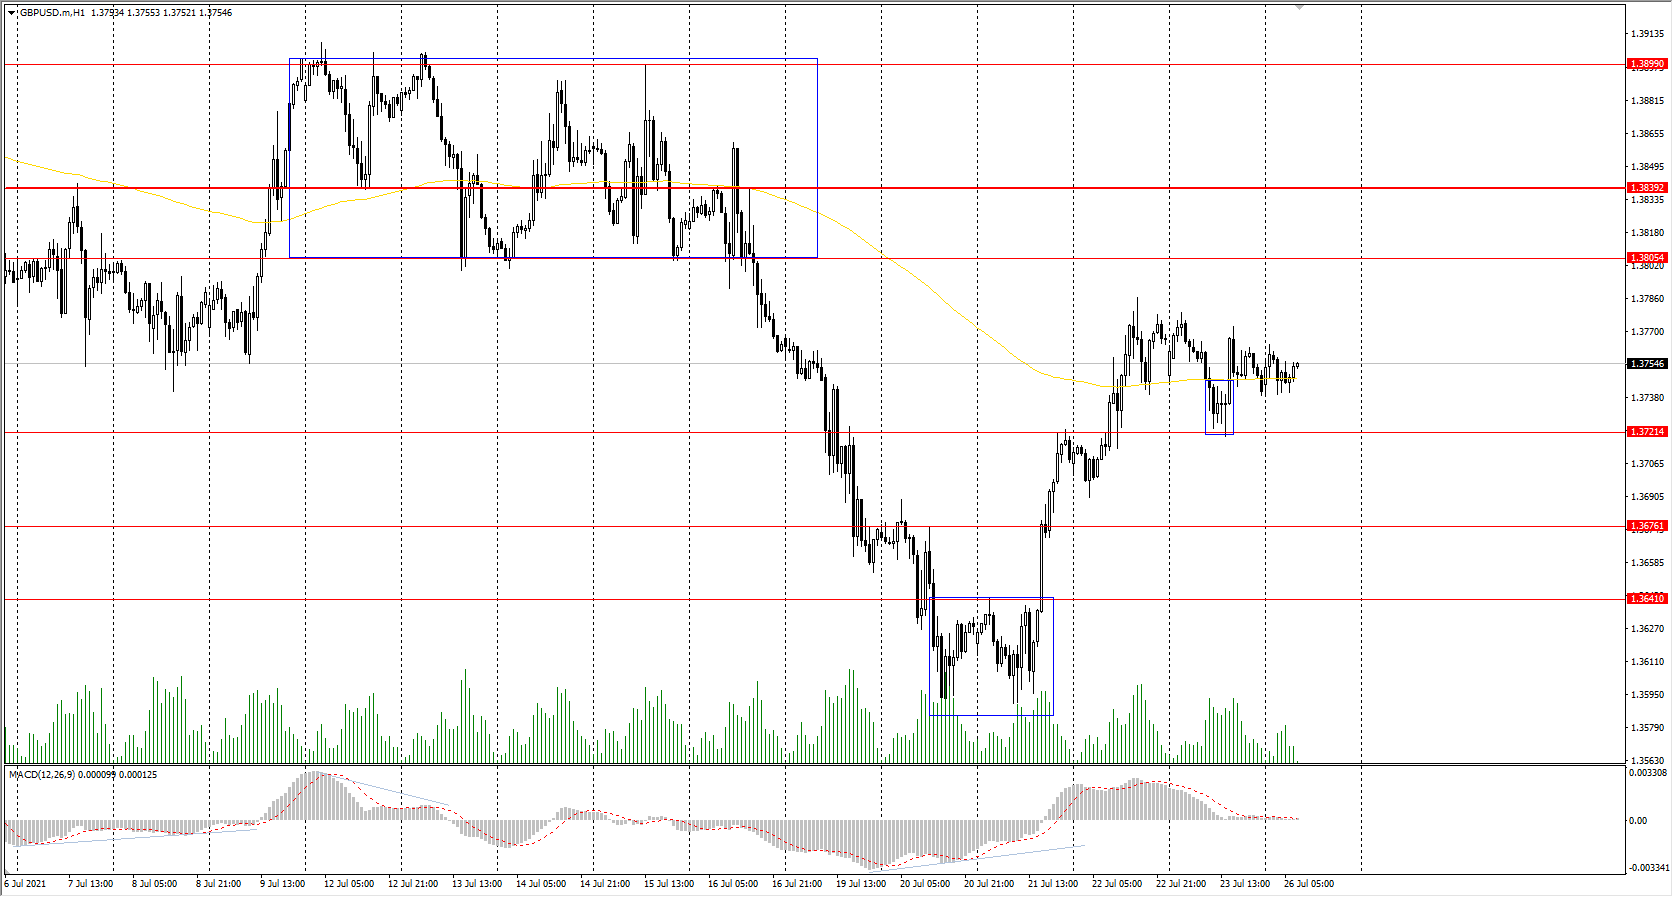
Prev Open: 1.3749
Prev Close: 1.3741
% chg. over the last day: +0.06%
The British pound looks more confident than the euro. But due to the rapid spread of the delta strain in the UK and across Europe, economic growth forecasts for July are expected to be weak as more people are forced to self-isolate in accordance with government regulations. Because of a growing shortage of supermarket goods in the UK, food retail staff won’t be quarantined for ten days if someone has been in close contact with the infected person.
Trading recommendations
Support levels: 1.3721, 1.3676 ,1.3641, 1.3614, 1.3525
Resistance levels: 1.3805, 1.3899, 1.3923, 1.4002, 1.4075, 1.4101
The trend on the GBP/USD currency pair is downward on the H1 timeframe. But buyers are still able to keep the course from falling. The MACD indicator has become inactive. Under such market conditions, traders are better to look for both sell deals from the resistance levels within the trend and buy deals from the support levels, but only on the intraday timeframes and with short targets.
Alternative scenario: if the price breaks through the 1.3839 resistance level and consolidates above, the bearish scenario is likely to be canceled.
The USD/JPY currency pair
Technical indicators of the currency pair:
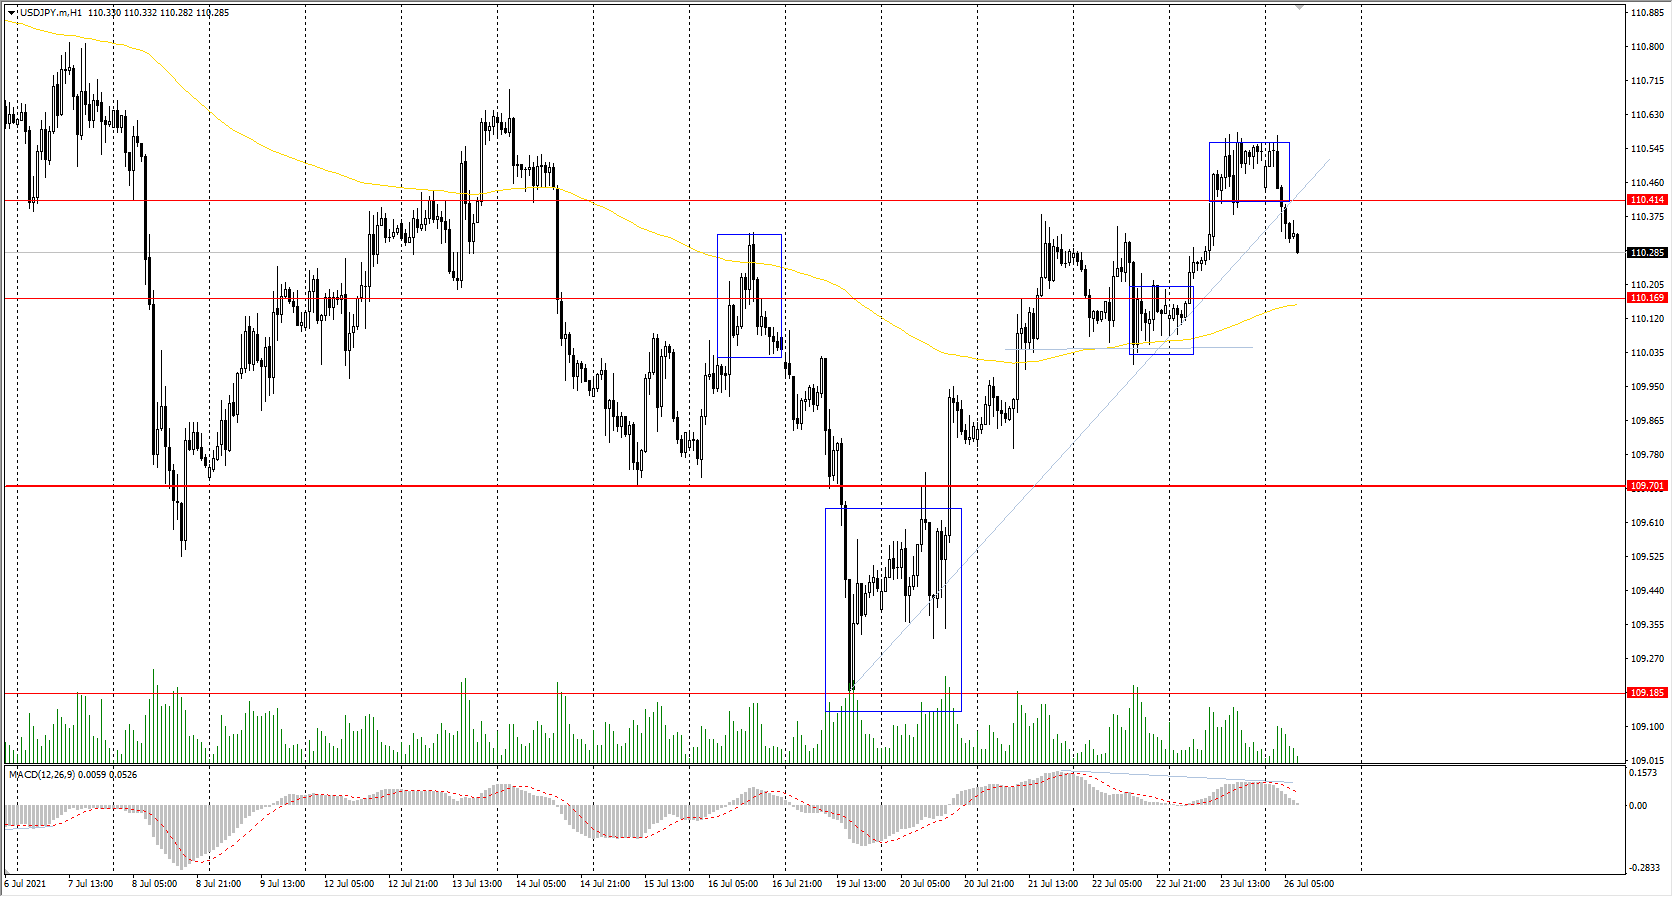
Prev Open: 110.12
Prev Close: 110.54
% chg. over the last day: +0.38%
The manufacturing activity of Japan showed the weakest growth over the past five months in July as the country is faced with serious challenges because of COVID-19 cases, which are forcing the government to extend restrictions and hinder economic recovery. Meanwhile, the services sector of Japan declined even more sharply in July. The stronger contraction in this sector came on the back of stronger declines in production, new orders, and new export orders.
Trading recommendations
Support levels: 110.17, 109.70, 109.19, 108.65
Resistance levels: 110.41, 110.73, 111.06, 111.48, 110.73, 112.18
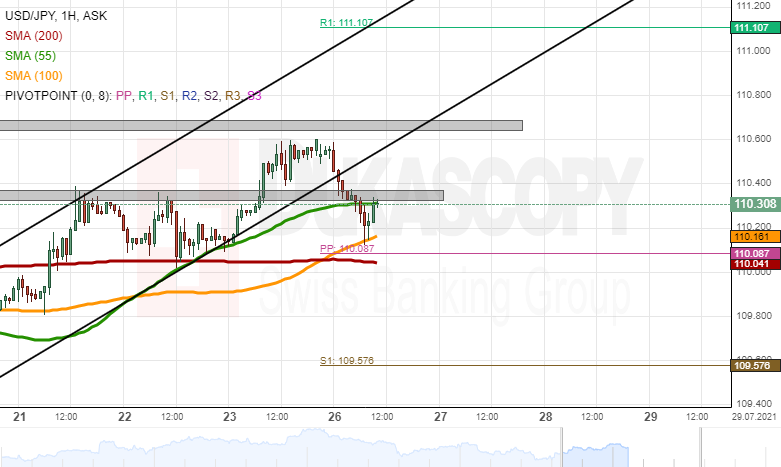
In terms of technical analysis, the situation has become uncertain. On the one hand, the price broke through the priority change level on Friday. On the other hand, the price failed to consolidate higher and returned back under the level. Traders are better to consider intraday trading now. For buy positions, it's better to wait for a pullback to the nearest support level. Sell positions should be considered only from resistance levels and with short targets.
Alternative scenario: if the price falls below 109.70, the downtrend is likely to be resumed.
The USD/CAD currency pair
Technical indicators of the currency pair:
Prev Open: 1.2562
Prev Close: 1.2560
% chg. over the last day: -0.01%
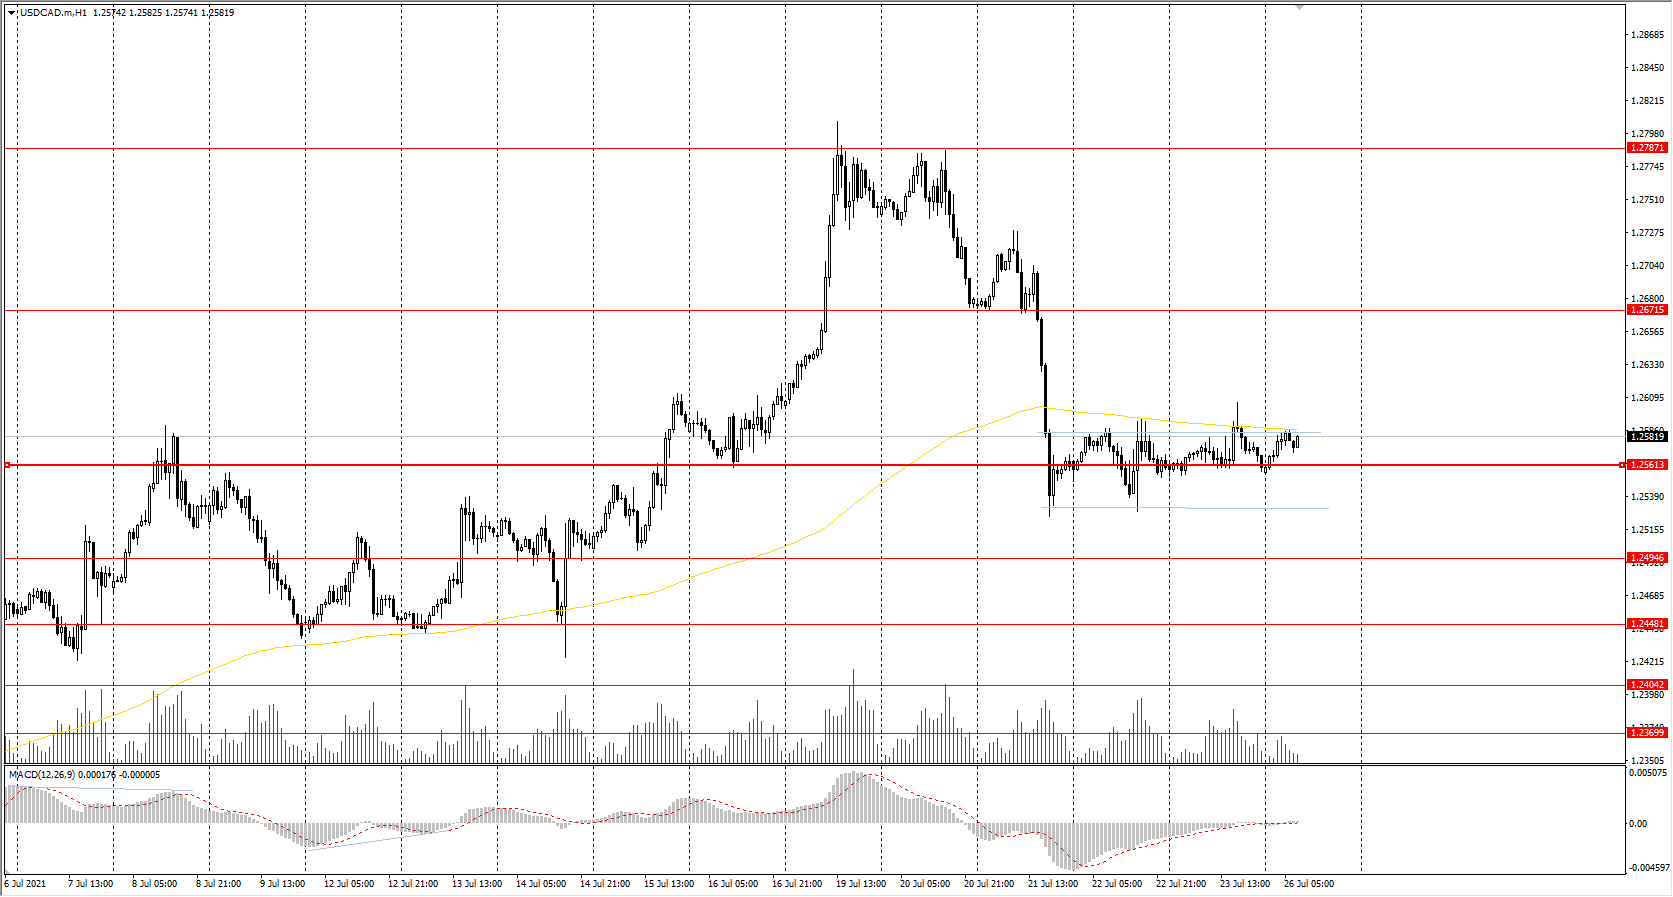
The situation with the USD/CAD currency pair has not changed. The Canadian dollar is a commodity currency and is highly dependent on oil price movements. Oil is now trading in the narrow price corridor, causing a consolidation on the USD/CAD currency pair. Analysts expect a short-term downward correction of oil, which will lead to an increase in USD/CAD quotes. Statistical Department of Canada released the data on retail sales on Friday. In May, receipts fell by 2.1% due to the COVID-19 shutdown, but sales increased by 4.4% as restrictions in the country were weakened. Also, the Federal agency reported on creating 230,700 new jobs for June.
Trading recommendations
Support levels: 1.2561, 1.2519, 1.2448, 1.2404, 1.2347, 1.2312
Resistance levels: 1.2671, 1.2787, 1,2951
Technically, the trend remains bullish. But the price is trading right at the priority change level. The MACD indicator is inactive. Traders are better to play it safe and take action only after the price moves to one side of the narrow price range.
Alternative scenario: if the price breaks through the 1.2561 support level and fixes below, the downtrend is likely to be resumed.