Sample Category Title
Daily Tecnical Analysis
EUR/USD
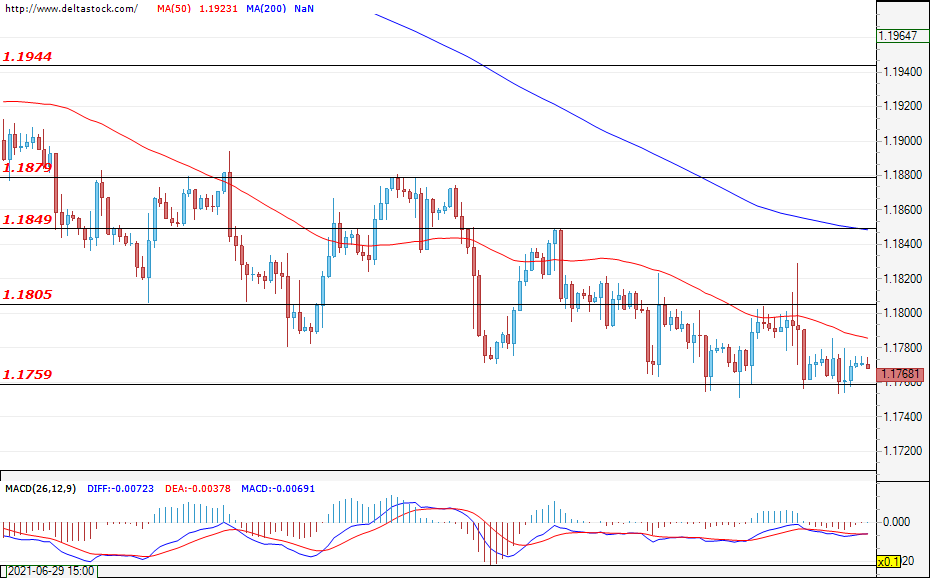
Current level - 1.1768
Last week, neither the bears nor the bulls gained enough momentum to successfully violate either border of the range between 1.1759 and 1.1805. During the early hours of today`s trading, the pair is hovering just above the level at 1.1759 and a new test is the most probable scenario. A breach here would strengthen the negative expectations for the future path of the EUR/USD and would easily deepen the sell-off towards the support level at 1.1717. The first target for the buyers is still the level of 1.1805, followed by the resistance zone at 1.1850. This week, investors’ attention will be focused on the consumer confidence data for the U.S. (Tuesday; 14:00 GMT), the announcement of the Fed’s Interest Rate Decision (Wednesday; 18:00 GMT), and the data for the unemployment claims (Thursday; 12:30 GMT).
| Resistance | Support | ||
| intraday | intraweek | intraday | intraweek |
| 1.1805 | 1.1879 | 1.1760 | 1.1690 |
| 1.1849 | 1.1944 | 1.1717 | 1.1600 |
USD/JPY
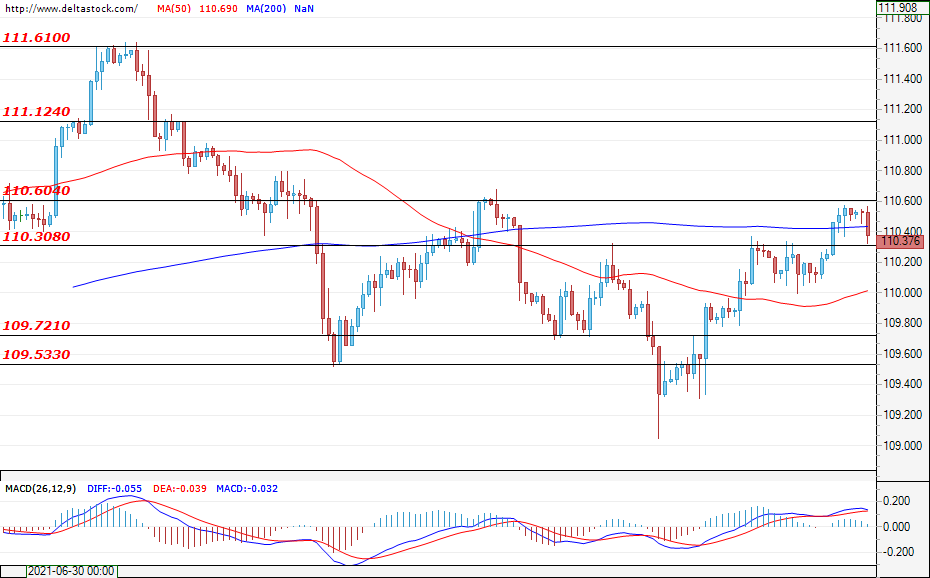
Current level - 110.37
The recovery of the greenback against the yen continues and the currency pair has breached the resistance zone at 110.30. If the bulls continue to prevail, a successful test of the important target at 110.60 would easily pave the way for USD/JPY towards the level of 111.12 and would strengthen the positive expectations of the market participants. In the other direction, if the currency pair does not hold its positions above the mentioned level at 110.30 and a corrective phase develops, the drop should be limited to the support level at 109.72.
| Resistance | Support | ||
| intraday | intraweek | intraday | intraweek |
| 110.60 | 111.12 | 110.30 | 109.53 |
| 111.12 | 111.61 | 109.72 | 108.55 |
GBP/USD
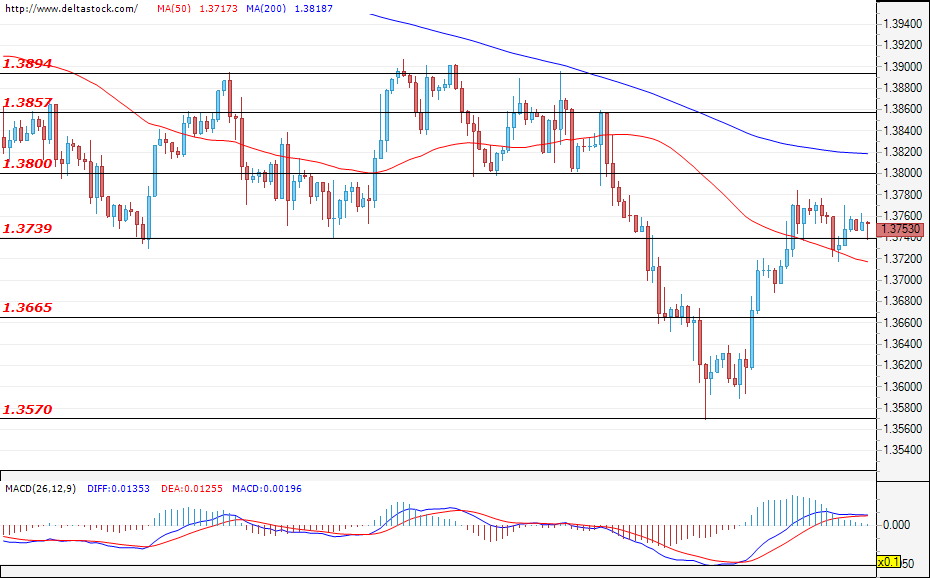
Current level - 1.3753
The Sterling recovered some of its recent losses against the dollar and the Cable is consolidating above the resistance zone at 1.3739. A successful violation of the next target at 1.3800 could easily lead to new gains and would help the bulls return the pair back to the range between 1.3800 and 1.3894. If the bears re-enter the market, we could witness a sell-off towards the support zone at 1.3665, where a breach could end the positive retracement phase and target the lows at 1.3570.
| Resistance | Support | ||
| intraday | intraweek | intraday | intraweek |
| 1.3800 | 1.3857 | 1.3739 | 1.3570 |
| 1.3857 | 1.3894 | 1.3665 | 1.3450 |
EUR/CHF Daily Outlook
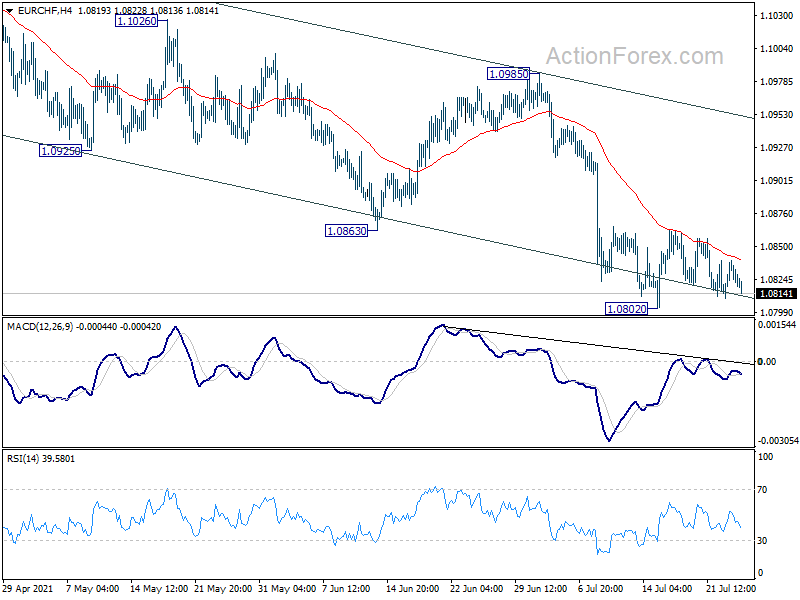
Daily Pivots: (S1) 1.0814; (P) 1.0827; (R1) 1.0839; More....
Intraday bias in EUR/CHF remains neutral at this point and consolidation from 1.0802 could extend. But overall near term outlook will stay bearish as long as 1.0985 resistance holds, even in case of strong rebound. On the downside, break of 1.0802 will resume the decline from 1.1149 to 1.0737 cluster support next.
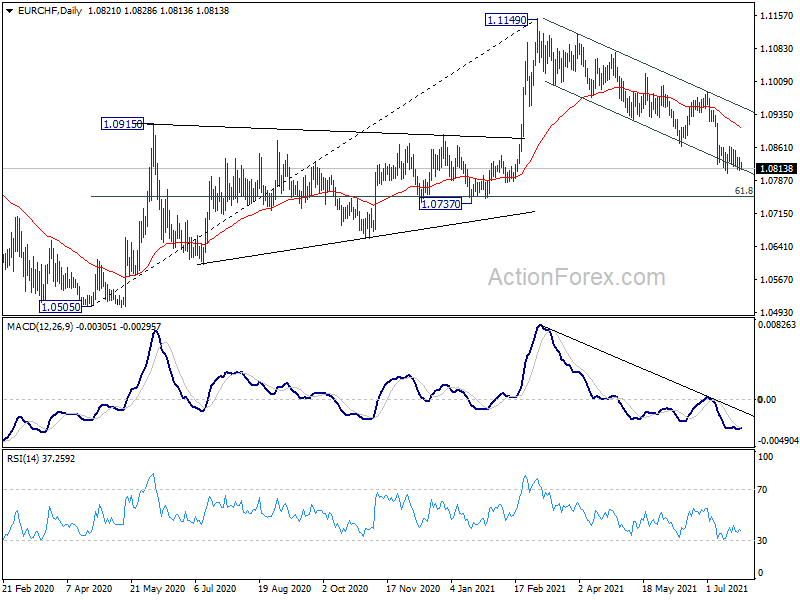
In the bigger picture, current development argues that rebound from 1.0505 (2020 low) might be completed with three waves up to 1.1149 already, after hitting 1.1078 long term fibonacci level. On the downside, sustained trading below 55 week EMA (now at 1.0880) will affirm this bearish case. Further break of 1.0737 cluster support (61.8% retracement of 1.0505 to 1.1149 at 1.0751) will bring retest of 1.0505 low.
USD/CAD Daily Outlook
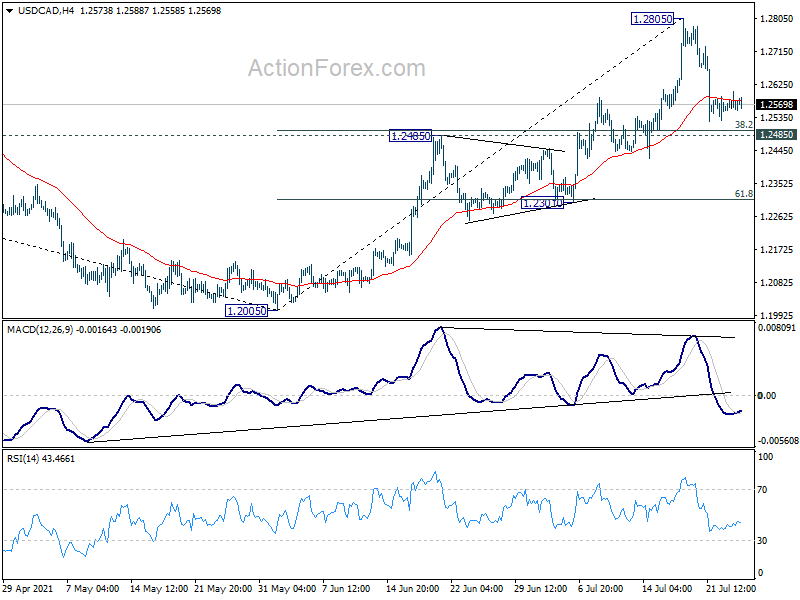
Daily Pivots: (S1) 1.2546; (P) 1.2576; (R1) 1.2598; More...
Intraday bias in USD/CAD remains neutral at this point, and more consolidations could be seen. Further rally is still expected as long as 1.2485 resistance turned support holds. On the upside, break of 1.2805 will extend the rise from 1.2005 to 1.3022 medium term fibonacci level next. On the downside, however, break of 1.2485 will bring deeper fall back to next cluster support at 1.2301 (61.8% retracement of 1.2005 to 1.2805 at 1.2311).
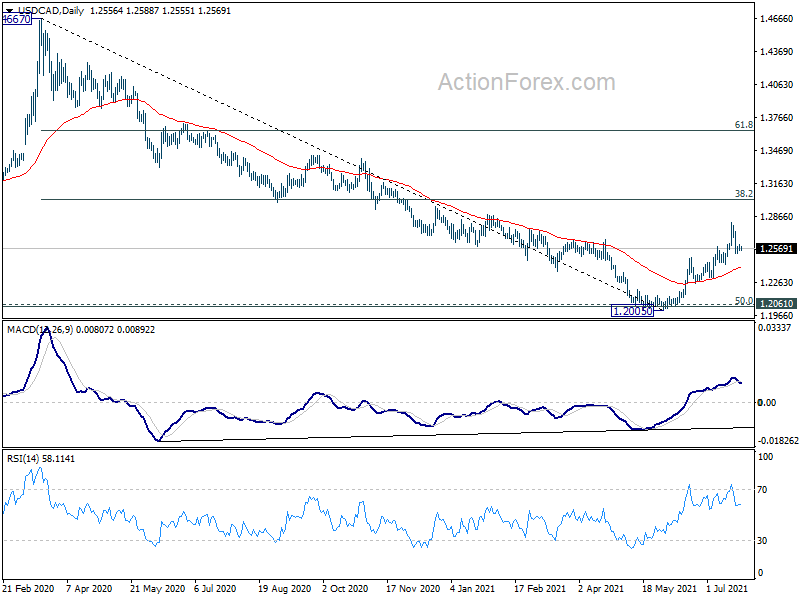
In the bigger picture, fall from 1.4667 is seen as the third leg of the corrective pattern from 1.4689 (2016 high). It should have completed after hitting 1.2061 (2017 low) and 50% retracement of 0.9406 to 1.4689 at 1.2048. Sustained break of 38.2% retracement of 1.4667 to 1.2005 at 1.3022 will pave the way to 61.8% retracement at 1.3650 and above. Overall, medium term outlook remains neutral at worst with 1.2048/61 support zone intact.
AUD/USD Daily Report
Daily Pivots: (S1) 0.7349; (P) 0.7371; (R1) 0.7384; More...
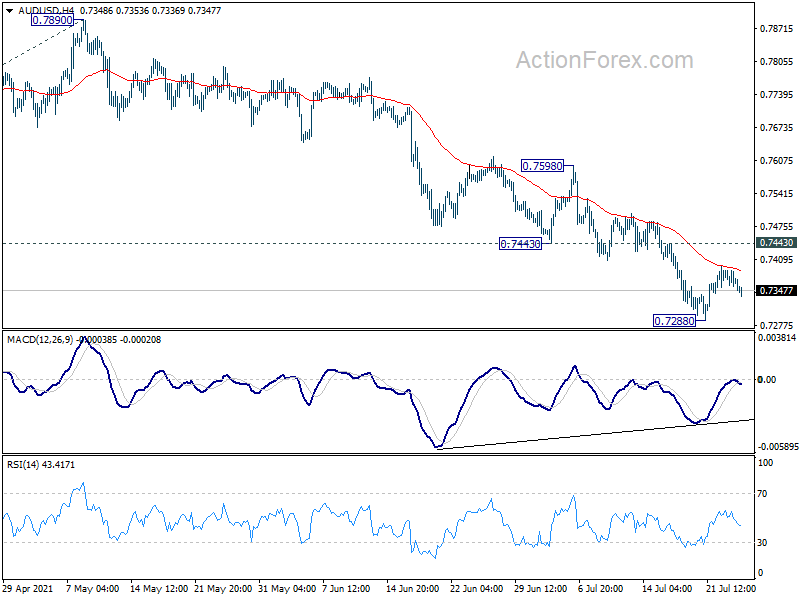
Intraday bias in AUD/USD remains neutral for some more consolidation above 0.7288 temporary low. Further fall is expected as long as 0.7443 support turned resistance holds. On the downside, break of 0.7288 will resume the whole decline from 0.8006 to 161.8% projection of 0.8006 to 0.7530 from 0.7890 at 0.7120 next. On the upside, break of 0.7443 will indicate short term bottoming, and bring stronger rebound to 0.7530 support turned resistance instead.
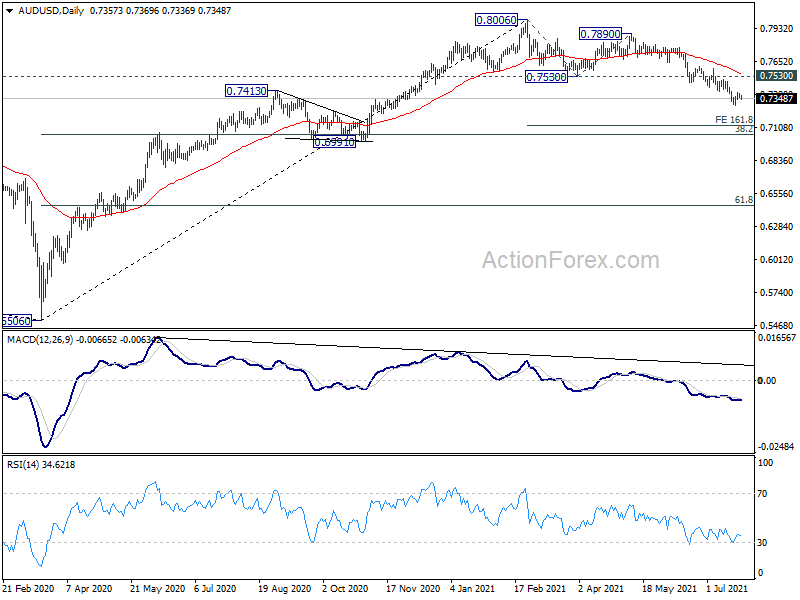
In the bigger picture, rise from 0.5506 medium term bottom could have completed at 0.8006, after failing 0.8135 key resistance. Correction from there could target 0.6991 cluster support (38.2% retracement of 0.5506 to 0.8006 at 0.7051). We'd look for strong support from there to bring rebound. However, sustained break of this level would argue that the whole medium term trend has indeed reversed.
Gold Still Flirts With 1,800, Neutral Outlook
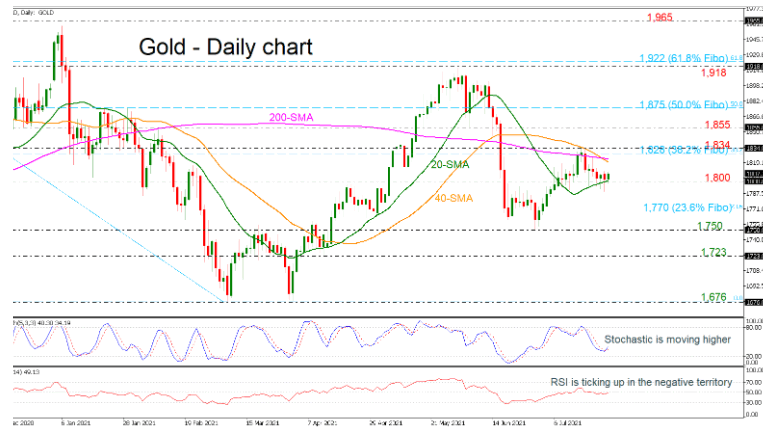
Gold prices are flirting with the 1,800 psychological level and the 20-day simple moving average (SMA), which are acting as strong support zones. The stochastic oscillator is ticking higher above the oversold area, creating a bullish cross within the %K and %D lines. Moreover, the RSI indicator is edging marginally up near the neutral threshold of 50.
If the price remains above the 1,800 round number, it could open the door for the immediate resistance lines such as the 40- and 100-day SMAs at 1,819 and 1,823 respectively, before the bulls visit the 38.2% Fibonacci retracement level of the down leg 2,074.89-1,676 at 1,828. Slightly higher, the 1,834 resistance is positioned ahead of 1,855. Steeper increases could move the market until the 50.0% Fibonacci of 1,875.
In the negative scenario, a successful attempt below 1,800 could open the way for more negative pressures towards the 23.6% Fibonacci of 1,770 before hitting the 1,750 support. Below that, the 1,723 barrier, registered in April 13, may halt bearish actions.
To sum up, the yellow metal has been in a neutral-to-bearish bias in the short-term timeframe as it holds between the SMAs and fails to improve any positive moves.
GBPJPY Neutral Bias
Technical analysis
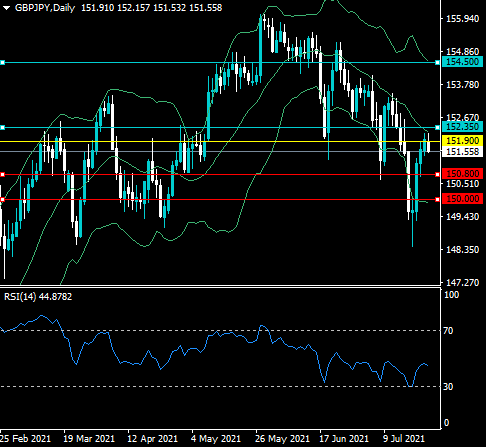
The GBJPY pair is struggling to move above the mid-line of the daily Bollinger Band. Failure to move above the mid-band could cause a downside technical correction.
The daily time frame also shows the RSI indicator is still bearish on the daily time frame, meaning that the GBPJPY pair may not yet be ready to rally.
What the possible outcomes are
In our most likely scenario, the GBPJPY pair fails to move above the mid-line of the daily Bollinger Band indicator and falls back towards at least the 150.00 level.
Alternatively, the GBJPY pair may above the mid-line of the daily Bollinger Band and start to advance towards the upper daily Bollinger Band, which is located around the 154.50
Key levels
Support 150.80 150.00
Resistance 152.35 154.50
CADJPY Negative Bias
Technical analysis
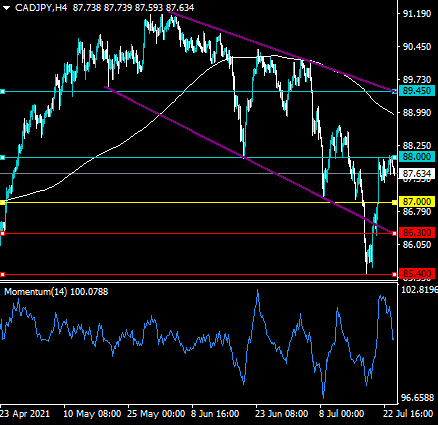
The CADJPY pair has formed negative price divergence on the Momentum indicator across the four-hour time frame during its recent recovery.
The four time frame continues to shows that the CADJPY pair is trading inside a large broadening descending wedge pattern. Seller may be preparing for another key technical test towards the bottom of the wedge.
What the possible outcomes are
In our most likely scenario, the CADJPY pair stages a final technical test back towards the bottom of mentioned descending broadening wedge pattern, and then starts to rally.
Alternatively, the CADJPY pair may rally towards the top of the broadening wedge pattern, around the 89.45 level, before staging a technical correction to the downside.
Key levels
Support 86.30 85.40
Resistance 88.00 89.45
EUR/USD Daily Outlook
Daily Pivots: (S1) 1.1754; (P) 1.1770; (R1) 1.1786; More...
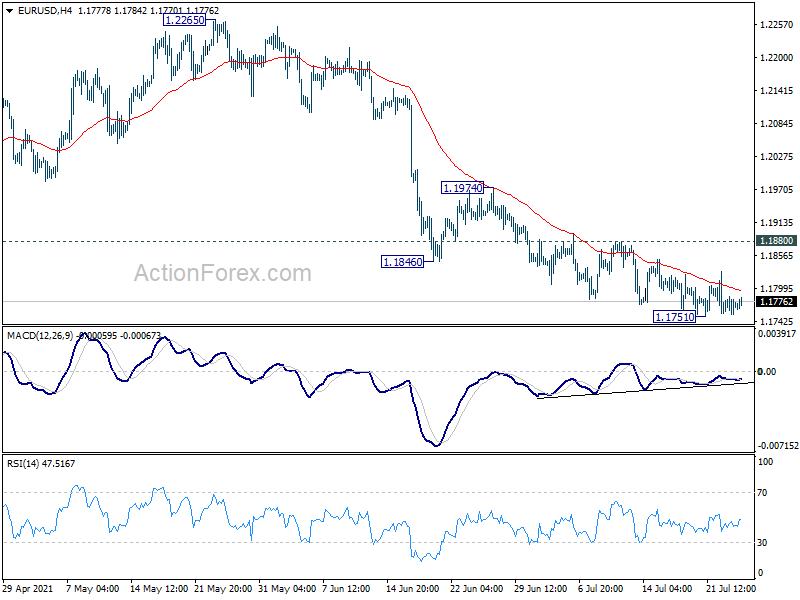
Intraday bias in EUR/USD remains neutral at this point. Break of 1.1751 will resume the fall from 1.2265, as the third leg of correction from 1.2348, to 1.1703 support. However, on the upside, break of 1.1880 will indicate short term bottoming and turn bias back to the upside for stronger rebound to 1.1974 resistance first.
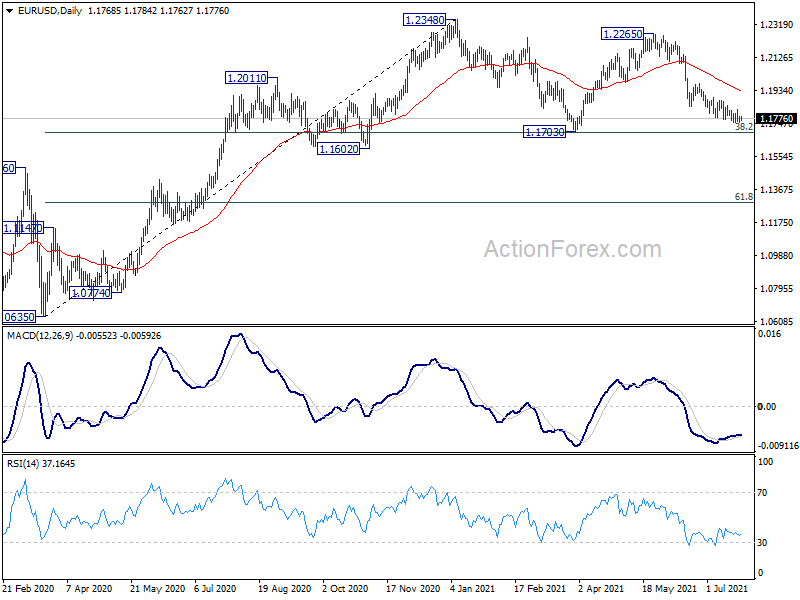
In the bigger picture, rise from 1.0635 is seen as the third leg of the pattern from 1.0339 (2017 low). Further rally could be seen to cluster resistance at 1.2555 next, (38.2% retracement of 1.6039 to 1.0339 at 1.2516). This will remain the favored case as long as 1.1602 support holds. Reaction from 1.2555 should reveal underlying long term momentum in the pair. However sustained break of 1.1602 will argue that the rise from 1.0635 is over, and turn medium term outlook bearish again.
GBP/USD Daily Outlook
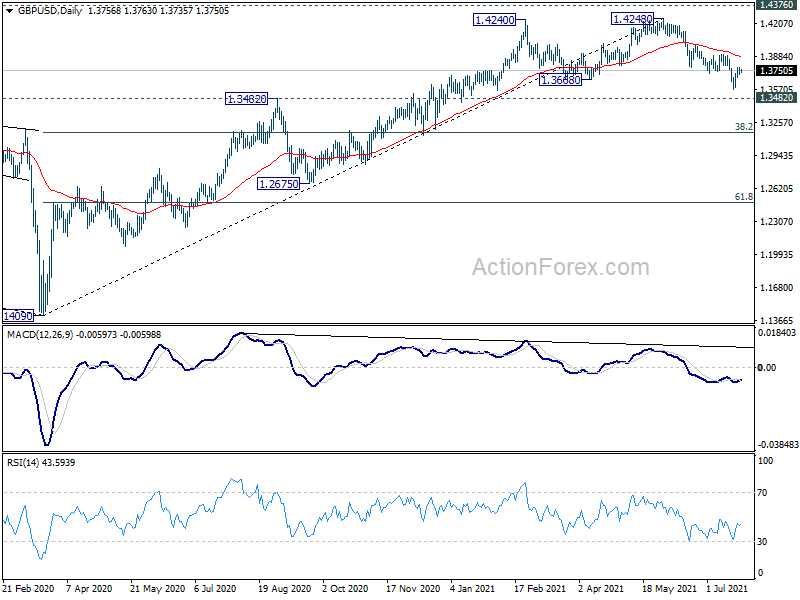
Daily Pivots: (S1) 1.3718; (P) 1.3749; (R1) 1.3778; More....
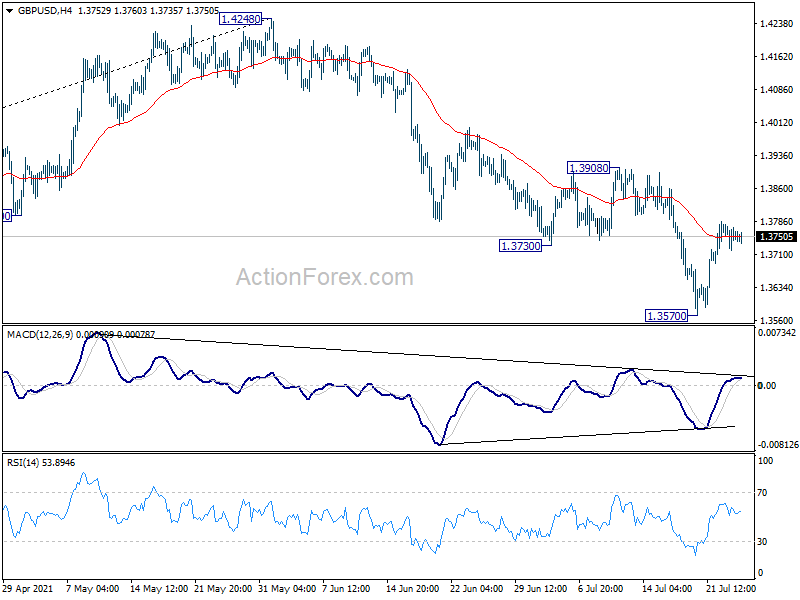
Intraday bias in GBP/USD remains neutral for the moment and more sideway trading could be seen. Still, deeper fall is expected as long as 1.3908 resistance holds. On the downside, break of 1.3570 will resume the fall from 1.4248 to 1.3482 resistance turned support first. Decisive break there will target 38.2% retracement of 1.1409 to 1.4248 at 1.3164. On the upside, break of 1.3908 resistance will turn bias back to the upside for retesting 1.4248 high instead.
In the bigger picture, as long as 1.3482 resistance turned support holds, up trend from 1.1409 should still continue. Decisive break of 1.4376 resistance will carry larger bullish implications. However, firm break of 1.3482 support will argue that the rise from 1.1409 has completed. GBP/USD would then be seen in another leg of long term range pattern between 1.1409 and 1.4376. Deeper fall could then be seen to 61.8% retracement of 1.1409 to 1.4248 at 1.2493, and even below.
USD/JPY Daily Outlook
Daily Pivots: (S1) 110.23; (P) 110.41; (R1) 110.73; More...
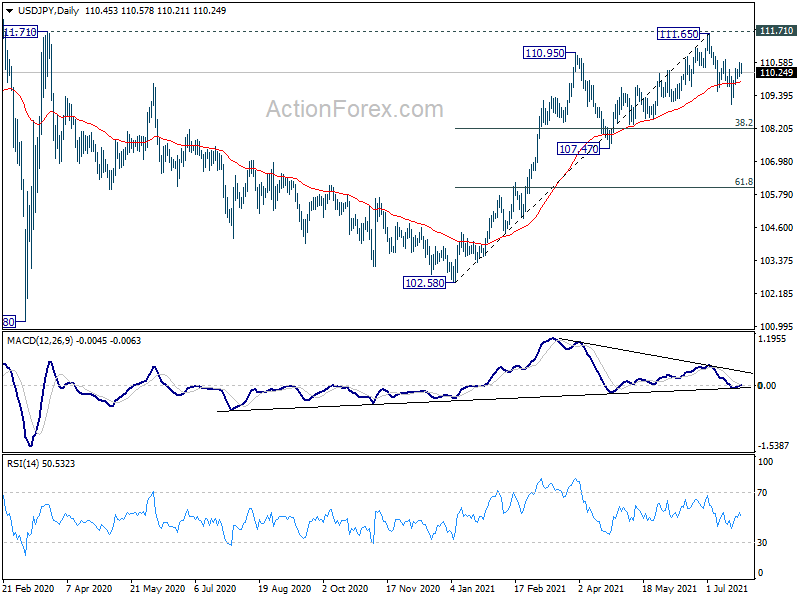
Intraday bias in USD/JPY is turned neutral with today's retreat first. Another rise is in favor as long as 110.00 minor support holds. Above 110.58 will resume the rebound from 109.05 to retest 111.65 high. However, on the downside, break of 110.00 will turn bias back to the downside for 109.05. Break will resume the fall from 111.65 to 38.2% retracement of 102.58 to 111.65 at 108.18.
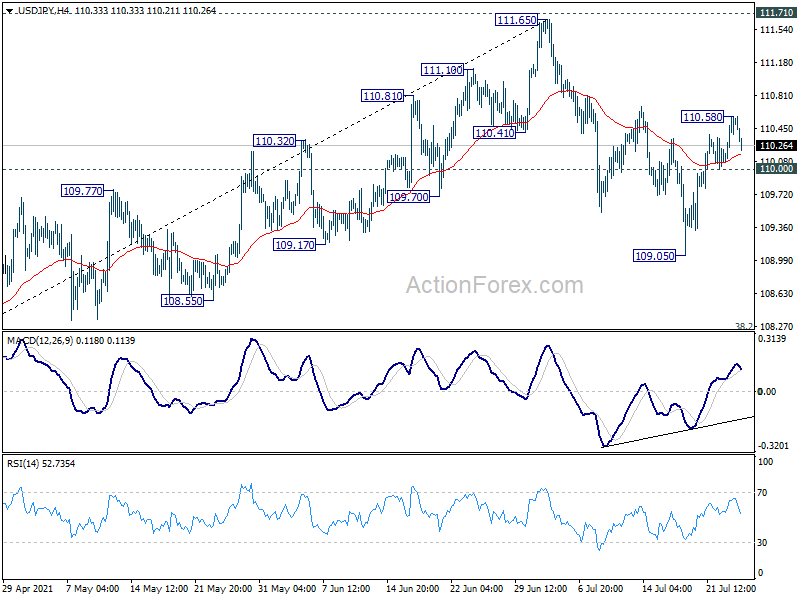
In the bigger picture, medium term outlook is staying neutral with 111.71 resistance intact. The pattern from 101.18 could still extend with another falling leg. Sustained trading below 55 day EMA will bring deeper fall to 107.47 support and below. For now, outlook won't turn bullish as long as 111.71 resistance holds, even in case of strong rebound.