

Sample Category Title
Safe Haven Flows Support USD
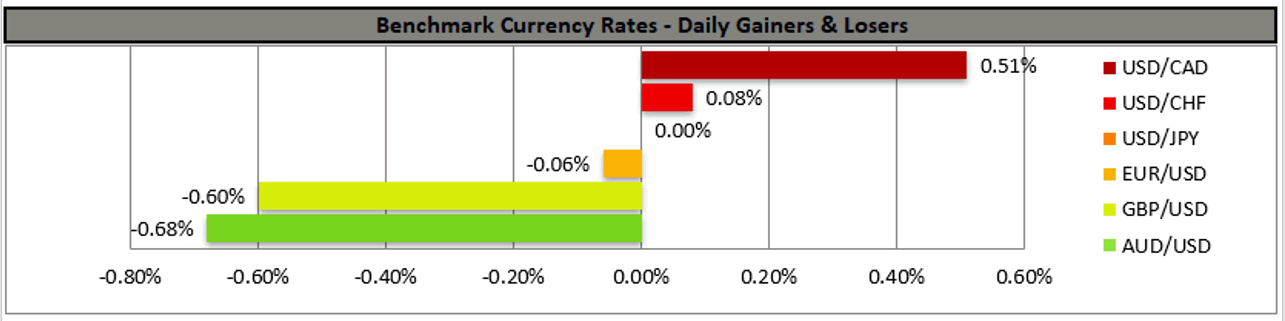
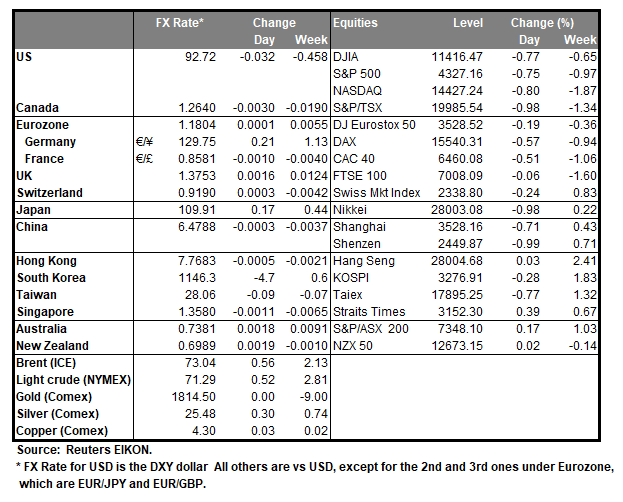
USD remained at rather high levels on Friday, as the spreading of the Covid 19 is globally threatening the recovery of the economy making market participants nervous and turning them to safe haven instruments such as the USD and JPY. The number of daily infections is on the rise and is alarming from northern American across Europe and Asia and as reported by Reuters the global seven-day average has reached new highs since May. The pound retreated on Friday against USD,EUR, JPY and CHF, as the UK is reaching “Freedom Day” dropping mandatory social distancing measures while at the same time Covid cases are on the rise in the UK due to the Delta variant, intensifying worries for a possible backlash. The Japanese currency remained rather stable against the USD, as safe haven flows tended to drive its bid higher while the Olympics are to start at the end of the week without spectators and lockdown measures intensify in the country of the rising sun. US stockmarkets dropped on Friday despite earnings season being on and US retail sales accelerating more than expected implying a rather smooth economic recovery, as a risk off sentiment swept through the market. The price of gold tended to stabilise during today’s Asian session, after a steep drop on Friday which was caused by a strengthening of the USD , while US yields seem to remain at rather low levels, polishing the shiny metal’s value. WTI prices seem to be dropping during today’s Asian session as ministers at the OPEC+ group are reported to have agreed to boost oil production levels from August onwards and the deal may weaken oil prices.
The USD index rose on Friday yet seems to find resistance at the 92.75 (R1) resistance line. We tend to maintain a bias for a sideways motion for the Dollar and for it to change in favour of a bullish outlook we would require a clear breaking of the 92.75 (R1) line. Please note that the RSI indicator below our 4-hour chart is above the reading of 50, implying a slight advantage of the bulls. Should the bulls take over we may see the index breaking the 92.75 (R1) resistance line and aim for the 93.45 (R2) level. If the bears take over the index’s direction, we may see it breaking the 92.30 (S1) support line and aim for the 91.75 (S2) level.
Cable seems about to abandon its sideways motion and on Friday moved lower aiming of the 1.3670 (S1) support line. We would require more consecutive lower peaks and troughs though, before switching our bias for a sideways motion. Please note that the RSI indicator below our 4-hour chart is near the reading of 30 reminding us of the presence of the bears for the pair. If the selling interest for cable is extended the pair could break the 1.3670 (S1) support line and aim for the 1.3525 (S2) level. If buyers are in control of the pair’s direction, we may see GBP/USD breaking the 1.3845 (R1) resistance line and aim for the 1.3990 (R2) level.
Other economic highlights today and the following Asian session:
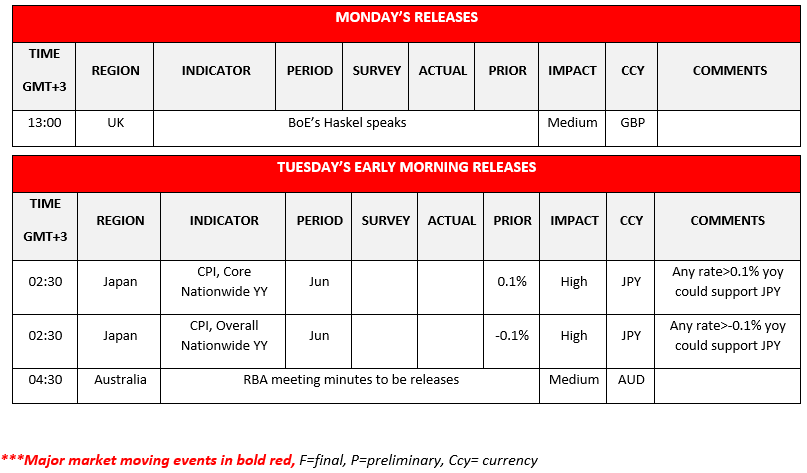
Today we have a rather empty calendar, yet we highlight for JPY traders Japan’s CPI rates for June during tomorrow’s Asian session. On the monetary front, today BoE’s Haskel is scheduled to speak, while RBA releases the minutes of its latest meeting during tomorrow’s Asian session.
As for the rest of the week
On Tuesday, we get the US building permits and house starts for June. On Wednesday, we get from Japan the trade data for June and Australia’s preliminary retail sales growth rate for June. On Thursday, we get from France the business climate for July, UK‘s CBI trends for orders, ECB‘s interest rate decision, the US weekly initial jobless claims figure and Eurozone‘s preliminary consumer confidence for July. On Friday, we get Australia‘s France‘s ,UK‘s, Germany‘s, Eurozone‘s and US preliminary Markit PMI figures for July, as well as UK‘s retail sales for June and Canada‘s retail sales for May.
USD Index H4 Chart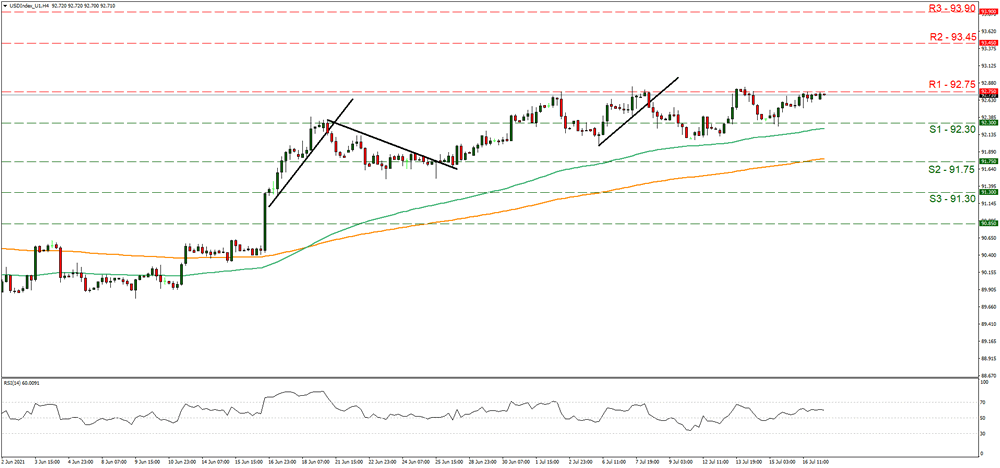
Support: 92.30 (S1), 91.75 (S2), 91.30 (S3)
Resistance: 92.75 (R1), 93.45 (R2), 93.90 (R3)
GBP/USD H4 Chart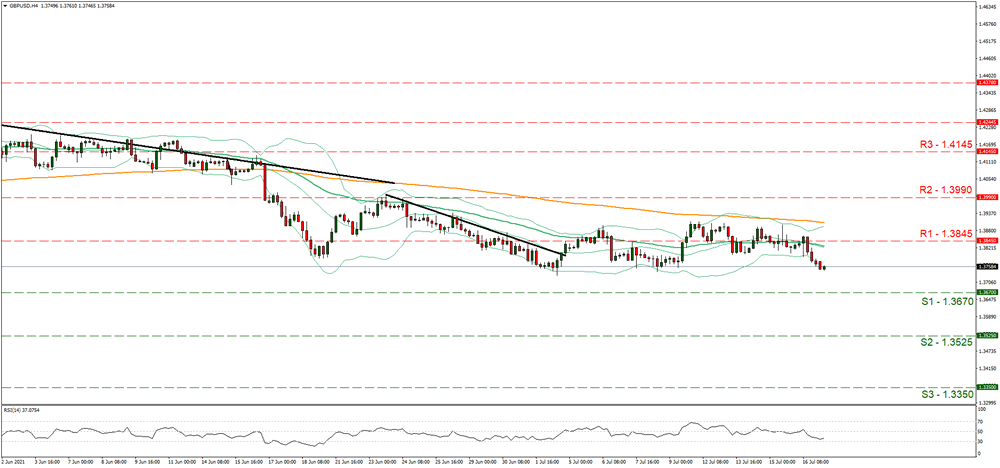
Support: 1.3670 (S1), 1.3525 (S2), 1.3350 (S3)
Resistance: 1.3845 (R1), 1.3990 (R2), 1.4145 (R3)
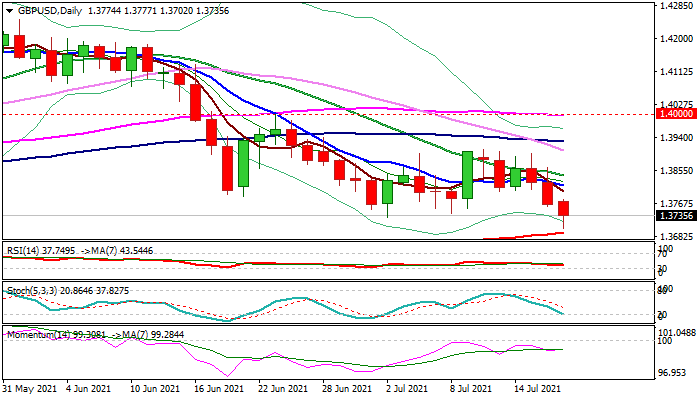
GBP/USD Outlook: Cable Hits 11-Week Low, Pressures 200DMA Support
Cable extends weakness into third straight day (down nearly 0.5% in Asia / early Europe on Monday) and pressures strong 1.3700 support zone (round-figure / 200DMA).
Last week’s break below the triangle and today’s extension below former low at 1.3731 (July 2) is bearish signal.
Daily techs maintain bearish momentum, but oversold conditions suggest that bears may face headwinds on approach to 200DMA pivot, which guards a higher base at 1.3670 (Mar/Apr lows).
Upticks should stay below falling 10DMA (1.3816) to keep bearish bias and offer better selling opportunities, but break of 200DMA, 1.3670 base and pivotal Fibo support at 1.3647 (38.2% of 1.2675/1.4249) is required to signal bearish continuation.
Res: 1.3777, 1.3815, 1.3842, 1.3862.
Sup: 1.3692, 1.3670, 1.3647, 1.3600
BoE Haskel: Risk management considerations lean against pre emptive tightening
BoE policymaker Jonathan Haskel said in a speech, "in the immediate term, the risk of a pre emptive monetary tightening curtailing the recovery continues to outweigh the risk of a temporary period of above target inflation. For the foreseeable future, in my view, tight policy isn't the right policy."
He also noted "two headwinds" over the coming months, the "highly transmissible Delta variant" and a "tightening of the fiscal stance". "Against this backdrop, risk management considerations lean against a pre emptive tightening of monetary policy until we can be more sure the economy is recovering in a manner consistent with the sustained achievement of the inflation target," he said.
Bundesbank: German economic rose strongly in Q2, to be even stronger in Q3
Bundesbank said in the latest monthly report, "the German economic output increased strongly again in the second quarter of 2021."
"Provided that there are no significant setbacks with a view to the pandemic and the supply bottlenecks in the industry at least gradually decrease, the overall economic expansion rate is likely to be even stronger in the summer quarter," it added.
Real GDP could finally reach pre-pandemic level again in Q3.
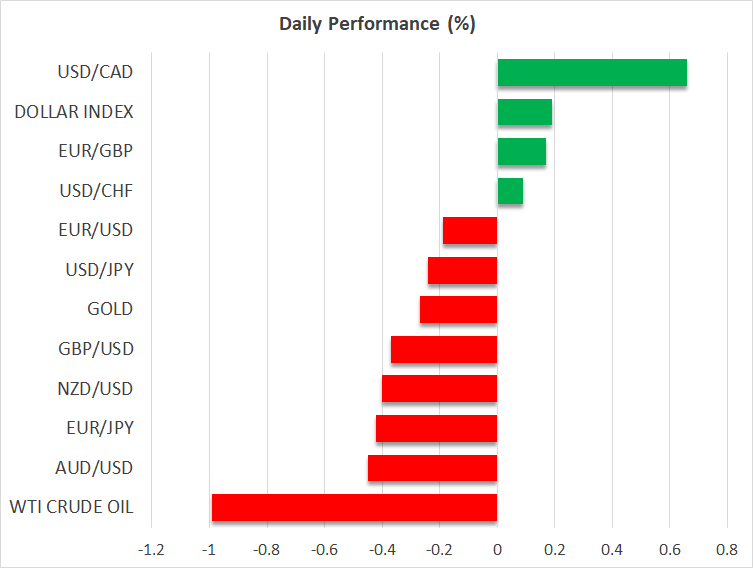
Virus Fears Return To Haunt Markets
- Global stocks lose altitude as investors sense something ominous
- Sterling caught in the storm too, loonie slides with oil after OPEC deal
- Dollar and yen stand tall amid flight to safety, gold not so fortunate
Gloomy mood spreads
The sense of caution that dominated the bond market recently is now spreading over into stocks and currencies, leaving investors puzzled over what's behind all the gloom. The initial spark seemed to be a short squeeze in bonds that hammered yields lower, but with the move persisting and spilling over into other asset classes, it might run deeper.
Markets seem to be grappling with the fear that the virus isn't going away despite widespread vaccinations in the major economies. New and more resilient mutations might be a perpetual phenomenon that wreaks havoc, especially in developing countries, ultimately keeping a lid on the recovery. The overwhelming firepower from governments and central banks was enough to fight the pandemic, but not enough to annihilate it.
Several nations from Asia to Europe to Australia are now fighting a new outbreak as the Delta variant spreads like wildfire. The good news is that hospitalizations remain low in most places. Still, with new cases spiraling, restrictions that hamper economic activity could remain in place for longer.
This has seen investors revert back to their pandemic playbook. Stocks are under selling pressure, with reopening plays getting hit the hardest while mega-cap tech names hold their ground amid hopes that tech heavyweights can bloom in any weather. As we've seen many times during this crisis though, virus worries are self-correcting for equity markets. If the health situation escalates, it simply implies more fiscal and monetary medicine for longer.
Oil lower after OPEC deal, dollar and yen shine
The cautious mood left its marks on oil prices too, which continue to lose ground even after OPEC reached a supply deal. The cartel and its allies finally agreed to increase supply by 2 million barrels a day by year-end, with the United Arab Emirates and a handful of other players being awarded higher production quotas.
On the bright side, the deal adds some certainty and diminishes the risk of a fracture that results in all-out production by some members. However, it also locks in a generous supply increase at a time when the demand outlook is shaky. This could take the shine off oil prices for now, especially if OPEC pushes ahead with plans to restore all its lost output by next year and American shale producers step up their game too.
Across the risk spectrum, the dollar and yen are back in fashion alongside government bonds as investors seek some protection. The greenback got an added boost on Friday after US retail sales overcame expectations, painting a picture of an economy that's booming as consumers have been let loose.
Sterling and gold struggle too
The biggest underperformers in the FX arena today are the commodity currencies, especially the oil-sensitive Canadian dollar. Sterling is also under heavy pressure thanks to its high correlation with stock markets.
Some news that the UK health minister has tested positive for covid likely added fuel to the retreat. The prime minister and the chancellor are also self-isolating, which underscores the government's gamble to open up everything and bet on the vaccines doing the heavy lifting in preventing hospitalizations.
It's a tough day for gold prices too. A stronger US dollar is anathema for bullion, which is priced in dollars and therefore becomes less attractive for foreign investors as the greenback strengthens. The striking part is that real Treasury yields are pinned down near record lows yet gold still can't sustain a rally, which is a bad look.
The economic calendar is empty today but there's an ECB meeting later in the week to keep things exciting, as the earnings season fires up.
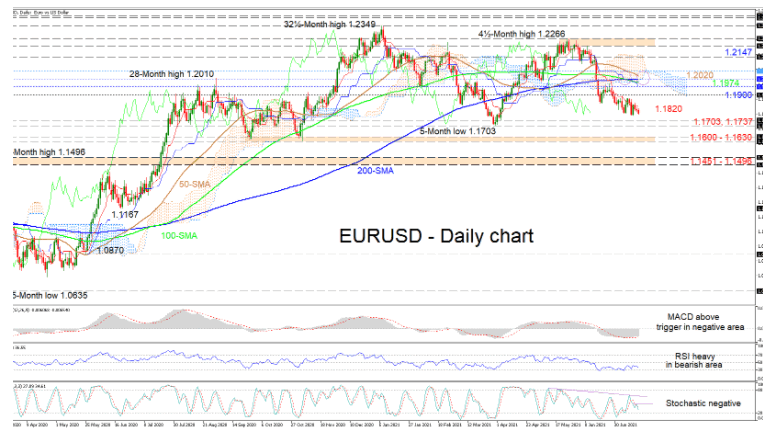
EURUSD Downside Risks Look To Accelerate
EURUSD continues to fade far beneath its simple moving averages (SMAs) heading for the April 5 low of 1.1737 and the adjacent March 31 trough of 1.1703. The diving 50- and 100-day SMAs are endorsing negative price action, and the near completion of a bearish crossover of the 200-day SMA, also by the 50-period SMA, could boost the downward trajectory.
The negative charge and the widening in the Ichimoku lines are indicating that bearish forces are still active, while the short-term oscillators are painting a dampening picture with downside momentum in the lead. The MACD below zero is holding above its flattening red trigger line but looks set to return beneath it, while the RSI is struggling to make headways in the bullish region. The stochastic oscillator has reclaimed a negative bearing, suggesting the bears may be seizing the upper hand.
If the pair maintains the current trajectory, sellers may face critical support from the nearby 1.1737 low and the March 31 trough of 1.1703. Should these obstacles break down, the bears could then turn their focus to the vital support base of 1.1600-1.1630 moulded between the September and November 2020 lows, a breach of which could give credence to negative forces. Should a violation mature beneath this foundation, the price may snowball towards the 1.1451-1.1496 barricade.
If buying orders amplify, friction for buyers could commence from the red Tenkan-sen line at 1.1820 ahead of the important 1.1900 handle. Conquering this, buyers would need to muster a profound upward drive to tackle a significantly reinforced resistance section from the blue Kijun-sen line at 1.1950 until the Ichimoku cloud’s upper surface at 1.2055. Surpassing this congested zone of upside deterrents, the price could pilot towards the June 15 high of 1.2147.
Summarizing, in the short-term timeframe EURUSD is sustaining a neutral-to-bearish tone underneath its SMAs and the 1.1900 mark. Yet, a push above the cloud at 1.2055 may bolster buyers’ belief in a sturdy climb.
Rising US Inflation Supports The Bullish Case For Gold
Last week, two events dominated the price action in financial markets – the US inflation and Fed Chair Powell’s semiannual testimony. Both brought a new perspective to market participants, but summer trading conditions eventually prevailed.
Namely, despite the rising inflation environment and the market-moving statements from the Fed Chair, the market did not move much. It is typical for the market to consolidate during the summer months, and so July and August are known as months with declining volatility.
Rising Inflation – Bullish for Gold and Equities
The US inflation data for the month of June showed inflation surging. It reached 5.4% YoY, much higher than expectations. In fact, inflation in the United States did not reach such levels for at least three decades.
Traders should remember that last year, in August, the Fed shifted its price stability mandate. It moved from targeting 2% to averaging 2% inflation. Therefore, higher inflation above 2% is not quite a concern for the Fed because we do not know what it is the period used for averaging.
In other words, if the Fed considers the last 12 months or more, then inflation is likely to be below the 2% AIT (Average Inflation Targeting) target. Because of that, the semiannual testimony that the Fed Chair held last week was critical for understanding how the Fed views inflation.
Fed Powell admitted that the central bank is surprised by how hot inflation is running, but he reiterated the fact that the Fed views it as transitory. We will find out further down the road if that is true or not.
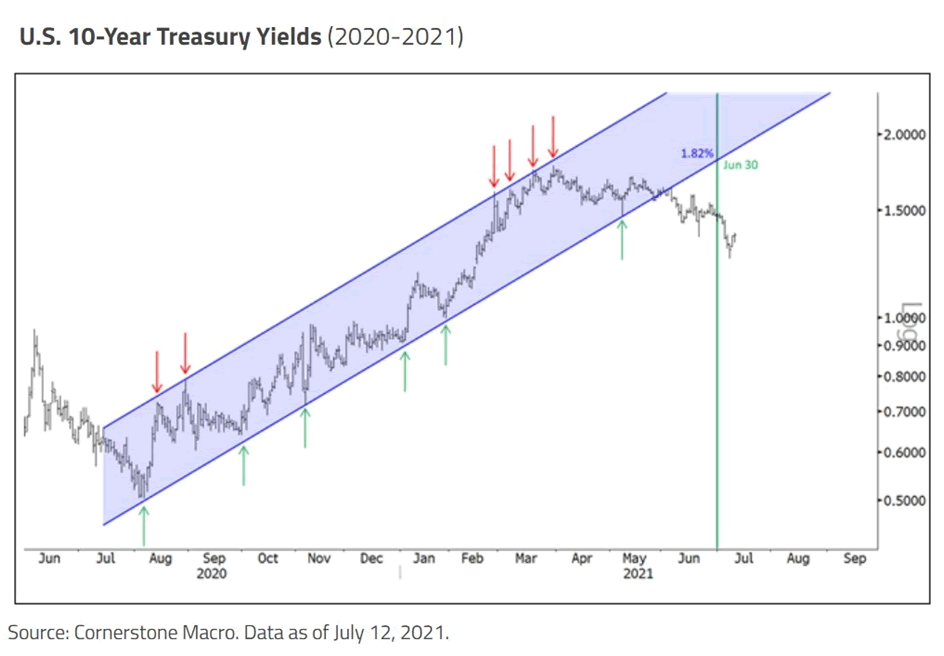
In the meantime, with inflation at 5.4% and the US 10-Year Treasury yield at 1.3%, we talk about a negative 4.1% real yields. Therefore, investors are forced to look for alternatives.
One is gold. Commodities have typically served against higher inflation and this time should be no different. The price of gold, therefore, traded with a bid tone last week, rising from below $1,800 at the time inflation data was released, to over $1,830 before giving back some gains.
Another is the stock market. The US equities have outperformed their peers and keep trading close to their highs. The earnings season started strong, with financial services corporations posting strong earnings for the second quarter. If the trend continues, funds will keep pouring into the stock market.
All in all, rising inflation bodes well for gold and equities. The next thing to monitor is the tapering of the asset purchases from the Fed. It may be announced as soon as the Jackson Hole Symposium in August, if inflation keeps rising.
A look at EUR/CAD and AUD/CAD as Canadian Dollar dives
Canadian Dollar tumbles broadly today as dragged by risk off sentiments, as well as the fall in oil price. WTI is pressing 70 handle after OPEC+ agreed over the weekend to boost production by 400k barrels a day, reversing some of the pandemic production cuts.
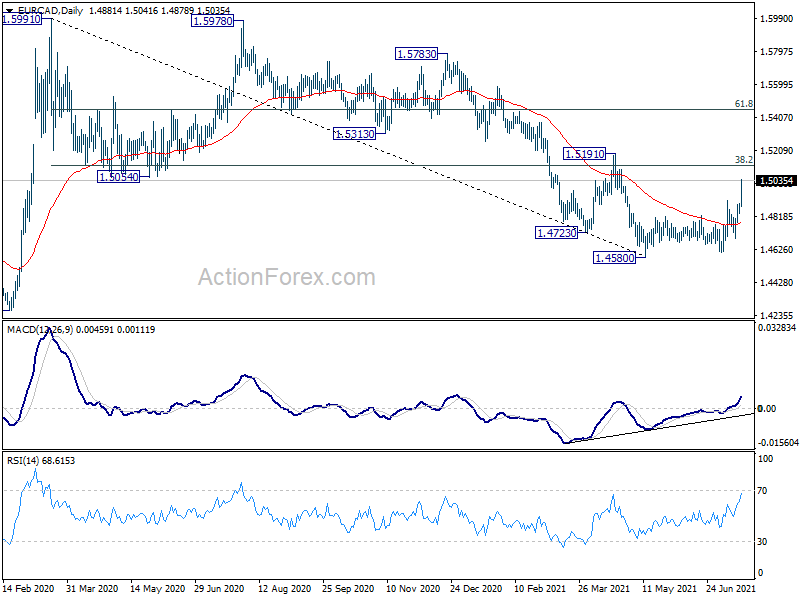
EUR/CAD surges to as high as 1.5041 today as rebound from 1.4580 resumes and accelerates. Current development now suggest that whole pattern from 1.5991 has completed at 1.4580 already, on bullish convergence condition in daily MACD. Next focus is 38.2% retracement of 1.5991 to 1.4580 at 1.5119. Sustained break there will pave the way to 61.8% retracement at 1.5452 and above.
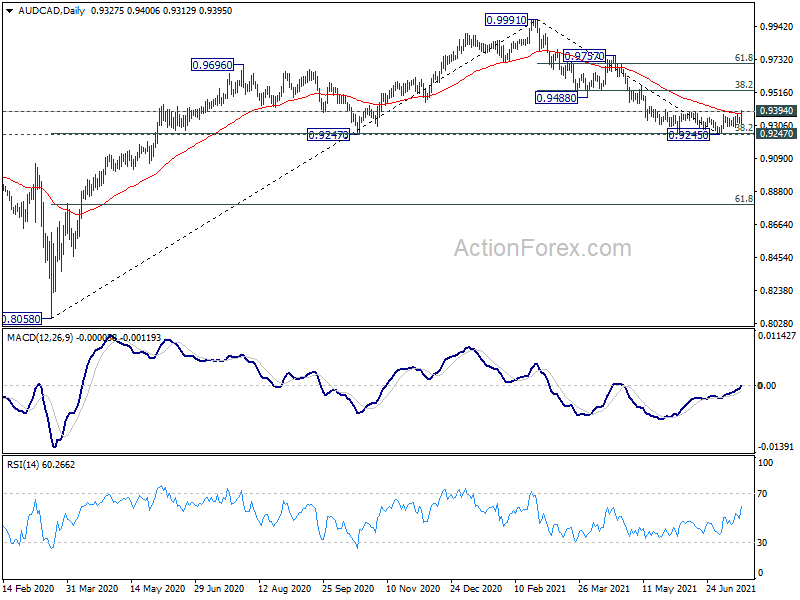
As for AUD/CAD, focus is now on 0.9394 resistance. Firm break there and sustained trading above 55 day EMA confirm short term bottoming at 0.9245. That would also argue that correction form 0.9991 has completed after drawing support from 0.9247 key support level. Stronger rise should then be seen to 38.2% retracement of 0.9991 to 0.9245 at 0.9530, and then 61.8% retracement at 0.9706.
Accelerating Inflation In The US And Rising Delta Strain Cases Continue To Weigh On Financial Markets
On Friday, the US stock indices finished trading in the red zone amid concerns about accelerating inflation. Investors believe that the Fed is unable to control inflation, so even though many major corporations have reported high net profits and revenues due to the economic recovery, the fixation of the previously open positions is still observed in the market. Last week, the Dow Jones decreased by 0.52%, the S&P 500 decreased by 0.97%, and the Nasdaq lost 1.87%. This week is not as eventful as the previous week, but it will be decisive and show whether the market is willing to continue the uptrend by turning a blind eye to high inflation. This week, the decline in stock indices could trigger a wave of sell-offs and the start of a big correction in the US stock market.
The European stock market closed with a slight decline on Friday. At the same time, the decline for the whole week was the worst over the last month. In the past week, the FTSE 100 has fallen by almost 2%, German DAX - by more than 1%, French CAC 40 has lost 1.3%. Despite the rising number of coronavirus cases in the UK per day, the country is lifting almost all remaining restrictions today as ministers believe in a vaccination program. However, British Prime Minister Boris Johnson will go into self-imposed isolation after coming into contact with a man who was infected with COVID-19.
Oil prices are falling amid OPEC+ decision to increase production. Since August, OPEC+ countries will begin to increase oil production by 400,000 barrels per day until the complete winding down of the cuts, which were provided in May 2020. Thus, demand will begin to catch up with supply, so the price increase to $100 per barrel is canceled.
Despite the drop in gold prices on Thursday and Friday, it closed the week at +0.2%. But at the opening of trading on Monday, gold started falling sharply. The reason for the decline is the growth of the Treasury bonds yield (inverse correlation with gold) on the background of the good report on the US retail sales for June.
Asia-Pacific stock indices are now strongly correlated with US indices, so there is also a decrease. Investors' concerns are also associated with the growth of Delta strain cases in the region.
Main market quotes:
- S&P 500 (F) 4,327.16 -32.87 (-0.75%)
- Dow Jones 34,687.85 -299.17 (-0.86%)
- DAX 15,540.31 -89.35 (-0.57%)
- FTSE 100 7,008.09 -3.93 (-0.06%)
- USD Index 92.71 +0.09 (+0.10%)
Oil And Gold Retreat
Oil falls on OPEC+ deal
OPEC+ reached an agreement over the weekend to extend the groupings production deal to the end of 2022 while simultaneously lifting daily production and raising baseline quotas for the group’s heavyweights. Oil prices had edged lower on Friday on virus-driven growth concerns, despite US data, OPEC+ break-up fears. The announcement to increase supply has pushed prices down this morning for most of the morning session.
On Friday, Brent crude fell 0.20% to USD 73.10 a barrel while WTI fell 0.10% to USD 71.45 a barrel. After both fell over 0.50% today after the weekend OPEC+ announcement, both have steadied back and are almost unchanged at USD 73.05 and USD 71.25 a barrel, respectively.
Although the intention to increase production is a short-term negative for oil prices, particularly as it coincides with growth fears sweeping markets this week, in the longer run, the ability of OPEC+ once again to overcome their difference is a positive for prices. If demand falls short of expectations, OPEC+ more than likely has the discipline to modify production targets to support prices as well now, as necessary.
I do not rule out more weakness in the short term, but overall, I believe the worst of oil’s price pullback is now over. On Brent crude, failure of support at USD 72.00 could see a spike to USD 70.00 a barrel. Similarly, a loss of USD 70.00 a barrel by WTI could see it briefly spike to USD 68.00 a barrel.
Gold wobbles
Gold prices fell on Friday as US Retail Sales failed to move US bond yields higher but did strengthen the US dollar. The US dollar appears to be catching a safe-haven bid as well, as virus/growth fears rise, which is also capping gold’s gains.
Gold retreated 0.95% to USD 1812.50 an ounce on Friday and came very close to staging an outside reversal day, which would have been a powerful negative technical indicator. The loss of upside momentum has shifted the risks for gold to the downside. For now, though, and despite the noisy price action, gold remains hemmed in by its 100 and 200 DMAs at USD 1792.00 and USD 1826.00 an ounce, respectively.
A daily close below USD 1790.00 an ounce would signal a deeper correction targeting USD 1750.00. Some short-covering has seen gold rise slightly to USD 1813.00 an ounce in Asia, with investors’ minds regionally clearly focused more on equity markets. However, this is a week for patience, and with momentum shifting on sentiment, investors should respect the 100-and 200-DMAs and avoid getting caught out by whipsaw price action.