Sample Category Title
US Dollar Gets Support From Retail Sales
The US dollar remains firm
The US dollar remained firm once again on Friday, as US Retail Sales kept the inflation story alive, in currency markets at least. The disconnect between US bond yields and the US dollar continued blissfully forward. The US dollar may also now be receiving an element of haven-buying support as concerns over the delta variant virus ratcheted higher.
The dollar index rose 0.16% to 92.72 on Friday, where it remains in Asia today. EUR/USD and GBP/USD continue to trade on the weak side. EUR/USD is at 1.1805 today, not far from support at 1.1700. A dovish potentially ECB on Thursday is capping the single currency, and risks are still weighted towards a fall below 1.1700 before the ECB meeting. A much deeper correction could occur if the ECB goes with a fixed 2.0% inflation target as this would imply more easing to throw on the BOJ-like 15 years of easing so far.
GBP/USD is looking very vulnerable this morning, having fallen 0.50% to 1.3755 on Friday, where it remains today. Rocketing delta-variant cases, just as the UK prepares to reopen today fully, have spooked markets. GBP/USD has support at 1.3740 and then the 200-day moving average (DMA) at 1.3695. The charts suggest a substantial fall to 1.3400 is possible if PM Johnson has moved too quickly. What could go wrong?
AUD/USD sits at 7-month lows today at 0.7390, increasing virus restrictions in New South Wales and Victoria spook markets locally. The Australian dollar’s role as a risk barometer for Asia, in general, is also not helping sentiment today. The AUD/USD can potentially extend losses to near 0.7200, but bears may find short AUD/NZD positions better to play AUD weakness. AUD/NZD staged a massive head and shoulders breakout below 1.0650 on Friday.
USD/Asia has risen by around 0.25% today ex yuan and yen. That is unsurprisingly given the weakening of risk sentiment over the weekend on virus and growth fears. I expect USD/Asia to remain bid this week. Still, the deteriorating confidence is more likely to be reflected here by softening local equities and AUD and NZD weakness as proxies.
A Soggy Start For Asia
Covid fears weighing on Asian markets
Equity markets are front and centre in Asia this morning, as increasing nerves about the delta-variant Covid-19 are sapping recovery hopes across the Asia-Pacific. Of course, you can choose your poison on that front globally, with the US, Europe, and the UK also experiencing rises in cases with populations pushing back on restrictions that seem to increase by the day in APAC.
China has muddied the water more by erecting barriers for China tech IPOs in the US, which appears to be an ongoing process. It’s Hong Kong or bust for your IPO from now on, it seems. Even Treasury Secretary Janet Yellen’s comments in a WSJ article that the US-China trade deal hadn’t been beneficial to American consumers has failed to lift the malaise.
US equities finished on a weak note on Friday despite blockbuster US Retail Sales showing Americans were out shopping. Like the earnings season thus far, last week seemed to be a buy the rumour, sell the fact sort of market. Underlying the weakness, though, are the nagging Covid-19 doubts. For context, given how inclined markets are in this day and age to schizophrenically change direction and sentiment on a 24-hour rolling basis, US equities remain near all-time highs, so let’s all just calm down a bit. Even a ten per cent pullback would change the underlying trend, and the Fed has your back.
In other news, OPEC+ seems to have reached an agreement to increase oil production by 400,000 barrels a day per month until the end of the year. Higher production baselines were given to heavyweights, the UAE, Saudi Arabia, Russia, Kuwait and Iraq, and the entire OPEC+ agreement was extended until the end of 2022. On the one hand, increased production is bearish in the short-term for oil prices, as Covid-19 demand concerns coincide with a speculative market that has filled its boots limit-long. On the other, it is a longer-term positive, as OPEC+ cohesion remains intact, without worries of a member’s production free-for-all. OPEC+ has once again demonstrated the ability to resolves its differences and stay on target.
The week’s data calendar is relatively light, notably in the US, with only weekly Initial Jobless Claims to pique interest. Most attention will be on Covid/inflation/growth concerns so that we can expect plenty of day-trader’s paradise type markets in Wall Street this week. The ECB announces its latest policy decision on Thursday, and for once, I will be watching the outcome. We should gain some more clarity as to whether the ECB’s new strategy entrenches a 2.0% inflation target, which, given they haven’t been there for well over a decade, should be a dovish outcome. Rising virus cases are clouding the demand picture there once again, and I would say that a dovish ECB will be reflected by a weak euro versus everything.
The United Kingdom fully reopens today as well, with all restrictions dropped. Unless you have been pinged by the NHS tracer app and told to isolate. The Prime Minister has asked everyone to show some social discipline, but having lived in London for years, that’s as likely to happen as inflation in Japan. The reopening is occurring as delta-variant cases explode in the UK, and I expect nerves over whether this is the dumbest post-pandemic policy decision ever to cap gains in sterling this week.
The week’s calendar sees China’s latest one and three-year Loan Prime Rate decisions tomorrow in Asia. Despite the recent RRR cut and MLF rollovers, I see no change to the LPR’s although I am now wavering on whether they will be hiked in Q4. Indonesia announces its latest policy decision on Thursday. Bank Indonesia has a slight problem this time around with the country of virus lockdowns and a never-ending delta wave, of which Mrs Halley and I have been recipients. There is room for a rate cut with inflation on the floor, but with ASEAN currencies, including the rupiah, fighting a Covid-19 retreat, I expect BI to remain unchanged to support the currency.
Australian PMIs on Wednesday should remain strong, but with sweeping lockdowns in NSW and Melbourne, any signs of viral infection will not be kind to the AUD or local equities. Some forecasters are now downgrading the growth outlook for the lucky country, and it almost certainly justifies the RBA’s ultra-dovish position. The lucky country will remain lucky, just not as fortunate for now, meaning that the Australian dollar, which is a risk-barometer for Asia anyway, will remain unloved this week.
Holidays will play a part in Asia this week. Much of South-East Asia is closed tomorrow for Eid Al Adha/Hari Raya Haji, including Singapore. Japan markets are closed on Thursday and Friday.
We do have some other data from around the region but in all honesty, the calendar this week is relatively light globally ex the ECB. Day-to-day sentiment will be dominated by news flow across asset classes. In the case of this week, that is dominated by Covid-19, especially in Asia, and its potential impact on the global recovery and inflation. Stand by for some wild swings in intra-day volatility across the world this week.
EUR/USD Outlook: Risk Off Mode Keeps Euro Under Pressure
The Euro holds in red for the third straight day and accelerates below 1.18 handle in early Monday.
Quick spread of the Delta variant of coronavirus sours the sentiment and fuels fresh risk aversion that keeps the Euro under pressure.
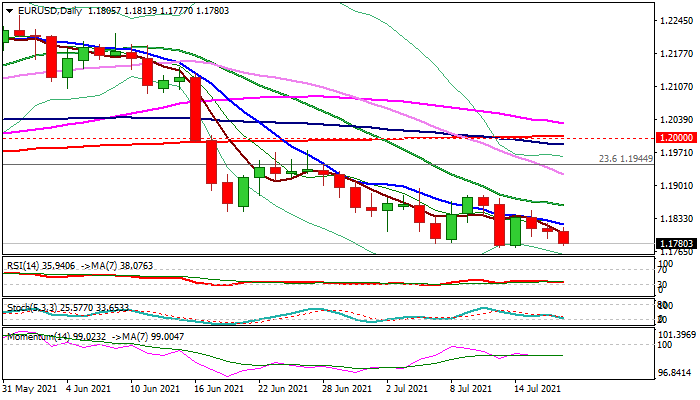
Negative daily studies confirm bearish bias, with last week’s lows (1.1772) being under pressure, with a break here to open the way for a test of key supports at 1.1704/1.1694 (2021 low, posted on Mar 31 / Fibo 38.2% of 1.0635/1.2349 rally).
Rising negative momentum on weekly chart adds to downside risk, as loss of 1.1704/1.1694 triggers would generate major reversal signal.
Falling 10 DMA tracks the action since early June and marks initial resistance at 1.1820, which should cap the upticks.
Only lift above 20DMA (1.1859) and 1.1881 (highs of July 9/12) would sideline bears.
Res: 1.1820, 1.1847, 1.1859, 1.1881.
Sup: 1.1772, 1.1737, 1.1704, 1.1694.
Market’s Anxiety Rises, Dollar Squares Its Shoulders
The markets closed last week with a sell-off, which is developing at the start of the new week's trading. Japan's Nikkei225 is down over 1.3%, and Shanghai's Hang Seng is down about 2%, trading at weekly lows, below the circular level of 10,000.
Short-term investors and traders should still be prepared for the security pull to gain momentum in the near term as overly optimistic expectations have been built into the quotes. The most optimistic scenario rarely materializes, forming the basis for corrective pullbacks.
By the end of last week, the ratio of fell to grown stocks in NYC was above 2 to 1, often interpreted as a near-panic sell-off. However, it is hard to talk about a 0.8% decline in indices that way. Right now, all traders' attention should be on whether we will see another rush of buyers or whether the current bulls have done all they can do.
It is especially frightening those markets are falling with robust macroeconomic data, better-than-expected reports, and assurances from the Fed and other central banks that there is no rush to roll back macroeconomic stimulus. The main reason cited for the pressure is the emergence of more pockets of coronavirus, which risks undermining the return to normalcy.
Technical analysis remains on the side of the bears. A divergence has formed between the charts and the RSI for the key US indices. In addition, the latter is coming down from the overbought area, signaling a corrective pullback.
The currency market is also dominated by a pull into defensive assets. The USDCAD has strengthened at the area of the high since March, gaining methodically since early June. Much of this pair growth was despite heightened gold prices and high oil prices, suggesting a strong pull into the USD on the American market.
The same conclusion comes to mind when looking at AUDUSD, which this morning fell to its lowest values since December. Meanwhile, the flagship currencies - EURUSD, GBPUSD, USDCNH - remain within established ranges.
We have repeatedly noted that the dynamics of the Aussie and the Loonie often lead to market trends. If so, the EURUSD's struggle for 1.1800 may be lost by the single currency already this week. Traders should be patient, though, as the ECB will hold its regular meeting on Thursday, after which the pair can make a final choice about the direction for the coming weeks.
Increased traction in the dollar, linked to market worries rather than US economic expansion, is often accompanied by a sell-off, which we might witness as early as this month.
The Analytical Overview Of The Main Currency Pairs
The EUR/USD currency pair
Technical indicators of the currency pair:
Prev Open: 1.1804
Prev Close: 1.1804
% chg. over the last day: 0.00%
The consumer price index in the European Union remained unchanged in June, and it is a good factor for THE growth of the EUR/USD currency pair since, unlike the US, there is no acceleration of inflation in Europe.
Trading recommendations
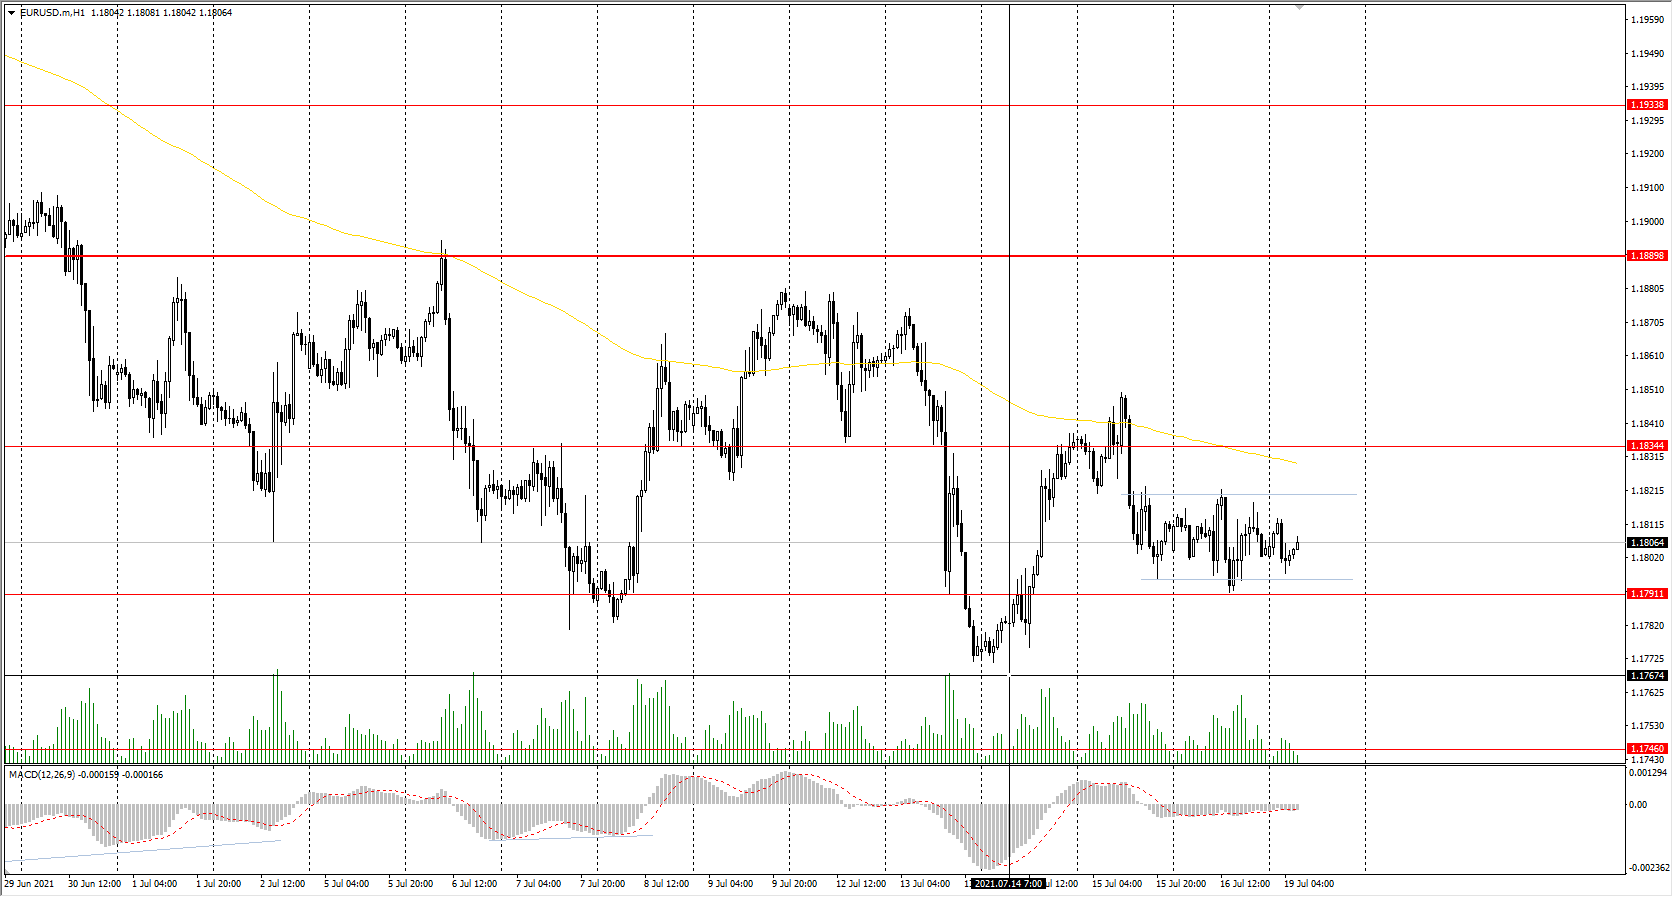
Support levels: 1.1791, 1.1746, 1.1609
Resistance levels: 1.1834, 1.1889, 1.1934, 1.1969
The trend is still bearish. The price is trading in a narrow price range for the second day. The MACD indicator is inactive. Under such market conditions, it is better to consider intraday trading. For sell positions, traders should wait for a pullback to the resistance level. Entries for long positions can be found on support levels, but with short targets since this kind of trading will be against the trend.
Alternative scenario: if the price breaks through the 1.1889 resistance level and fixes above, the general uptrend is likely to be resumed.
The GBP/USD currency pair
Technical indicators of the currency pair:
Prev Open: 1.3820
Prev Close: 1.3764
% chg. over the last day: -0.40%
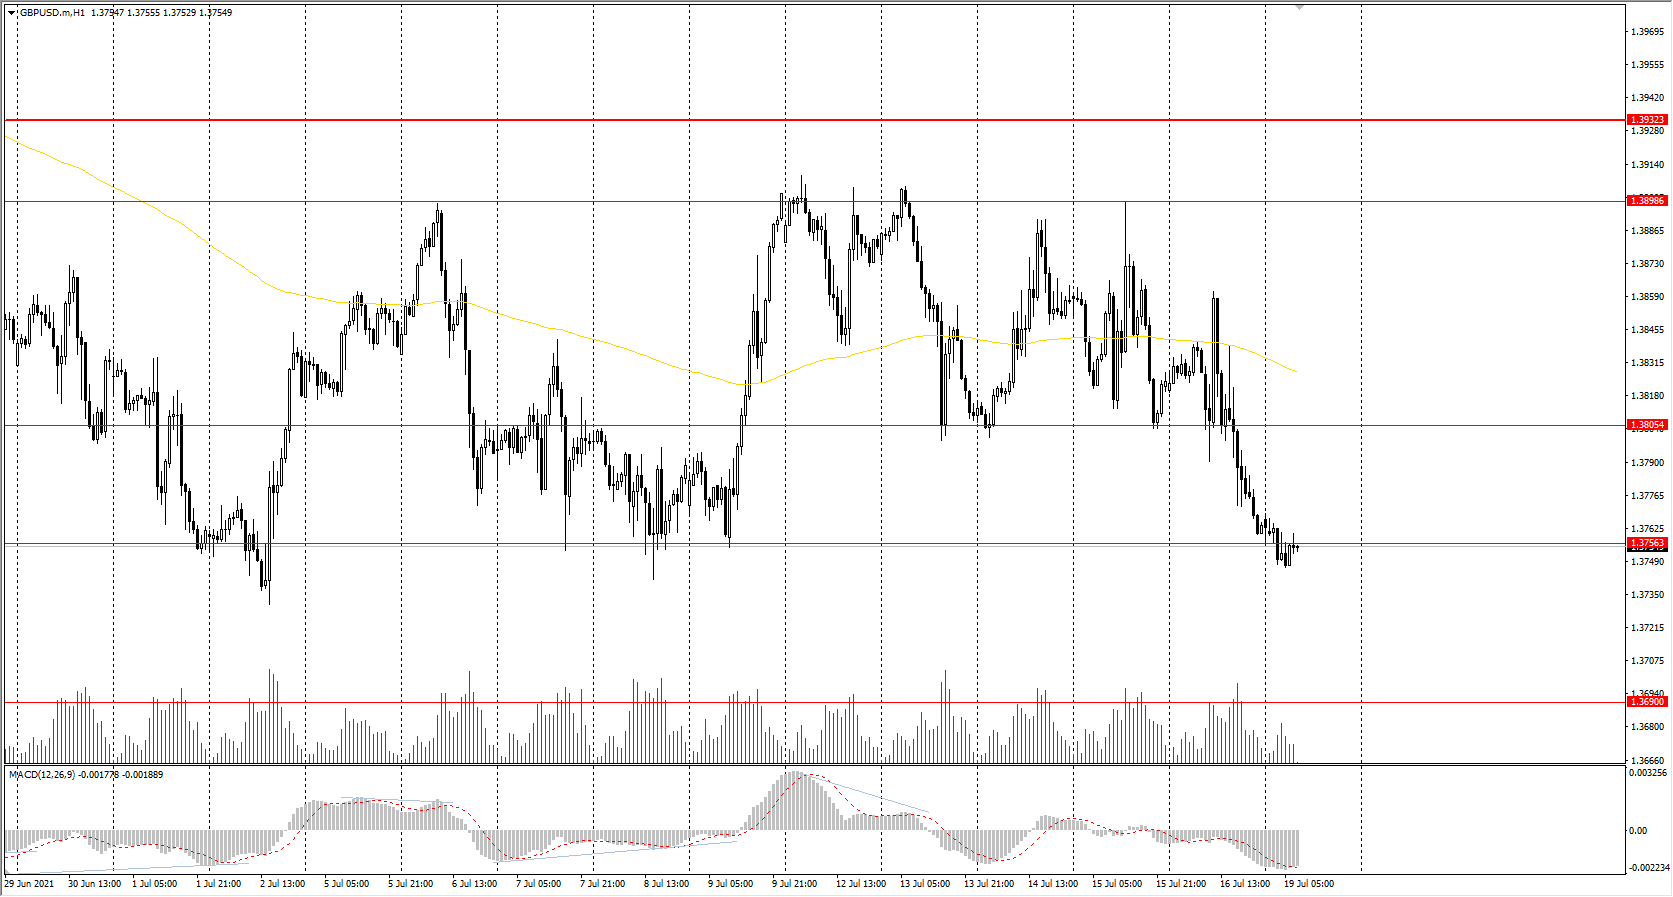
The GBP/USD currency pair fell by 0.4% on Friday. Now the price is trading in a wide range with the borders of 1.3756-1.3899. England removes most of its restrictions this week, so there are no fundamental reasons for the British pound to decrease, but technically everything points to the fact that the fall will continue.
Trading recommendations
Support levels: 1.3756, 1.3690
Resistance levels: 1.3805, 1.3899, 1.3923, 1.4002, 1.4075, 1.4101, 1.4138, 1.4191
The trend of the GBP/USD currency pair is bearish on the H1 timeframe. The MACD indicator went into the negative zone with no signs of reversal. Under such market conditions, it is better to consider intraday trading. For sell positions, traders should wait for a pullback to the resistance level. Entries for long positions can be found on support levels.
Alternative scenario: if the price breaks through the 1.3922 resistance level and consolidates above, the bearish scenario is likely to be canceled.
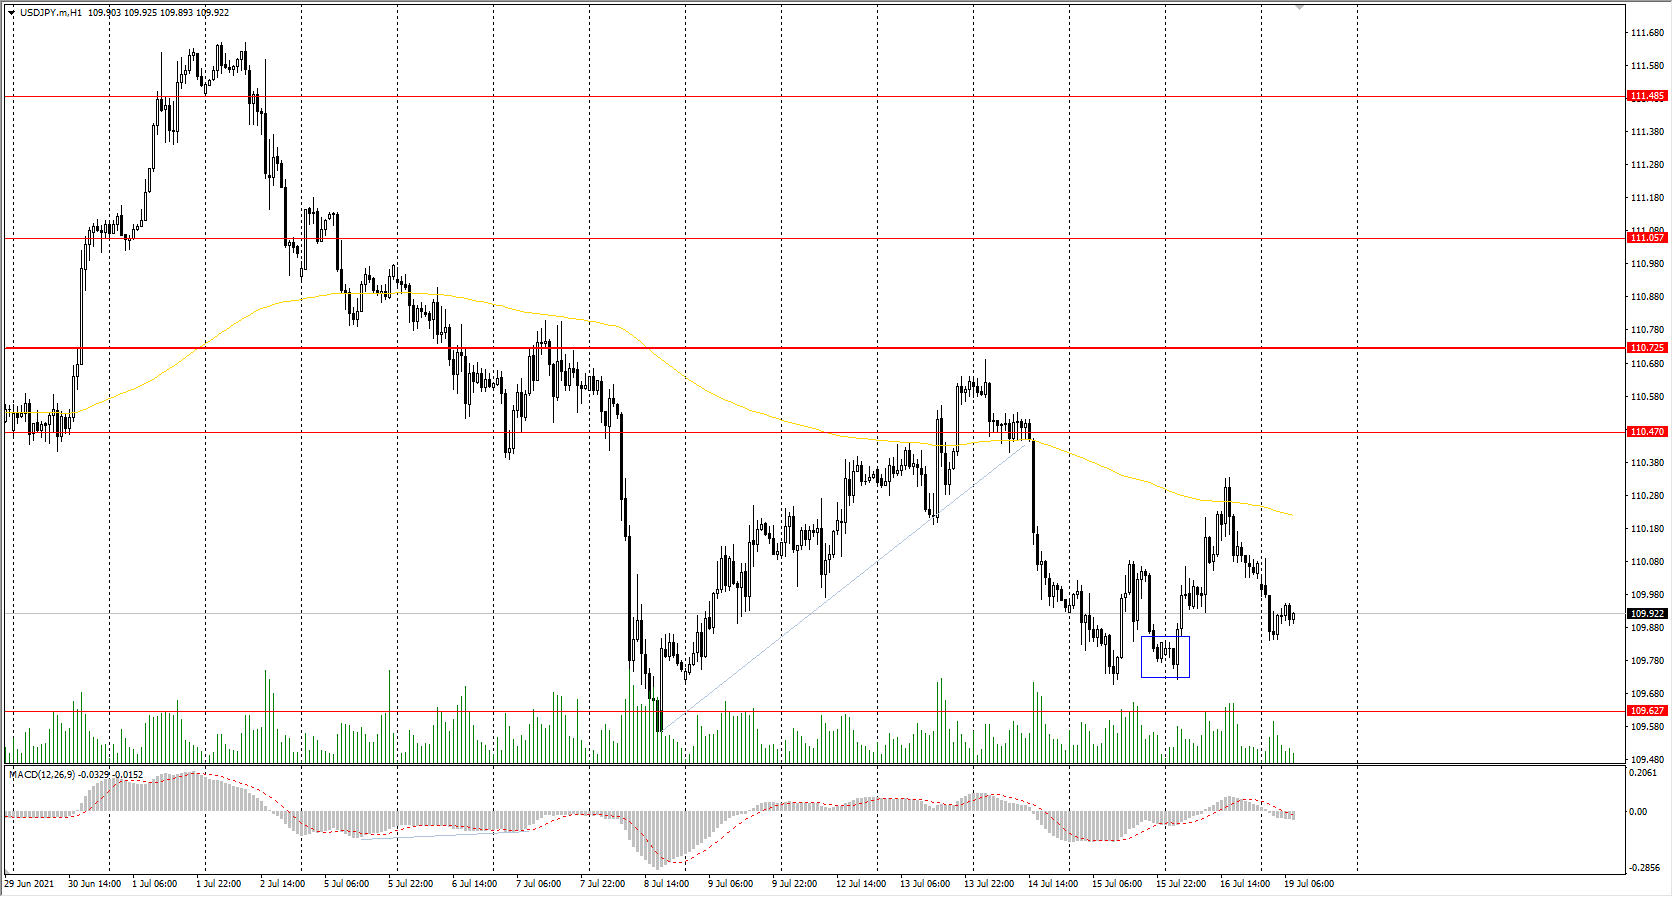
The USD/JPY currency pair
Technical indicators of the currency pair:
Prev Open: 109.80
Prev Close: 110.07
% chg. over the last day: +0.24%
The Bank of Japan reviewed its forecasts for consumer inflation on Friday. It expects the inflation to be at 0.6% (previous value 0.1%) now. The upward change in the forecast is caused by two factors: rising energy prices and uncertainty about the spread of the Delta strain of coronavirus, which could have a negative impact on both domestic and foreign economies.
Trading recommendations
Support levels: 109.63, 109.31
Resistance levels: 110.47, 110.73, 111.06, 111.48, 110.73, 112.18
From the point of view of technical analysis, the situation has not changed. There is a downward trend on the H1 timeframe, as the price is still trading below the priority change level and below the moving average. The MACD indicator has become inactive. Under such market conditions, traders are better to look for sell positions from the resistance levels on intraday timeframes. Buy positions should be considered from support levels, but only with short targets.
Alternative scenario: if the price rises above 110.73, the uptrend is likely to be resumed.
The USD/CAD currency pair
Technical indicators of the currency pair:
Prev Open: 1.2586
Prev Close: 1.2608
% chg. over the last day: +0.17%
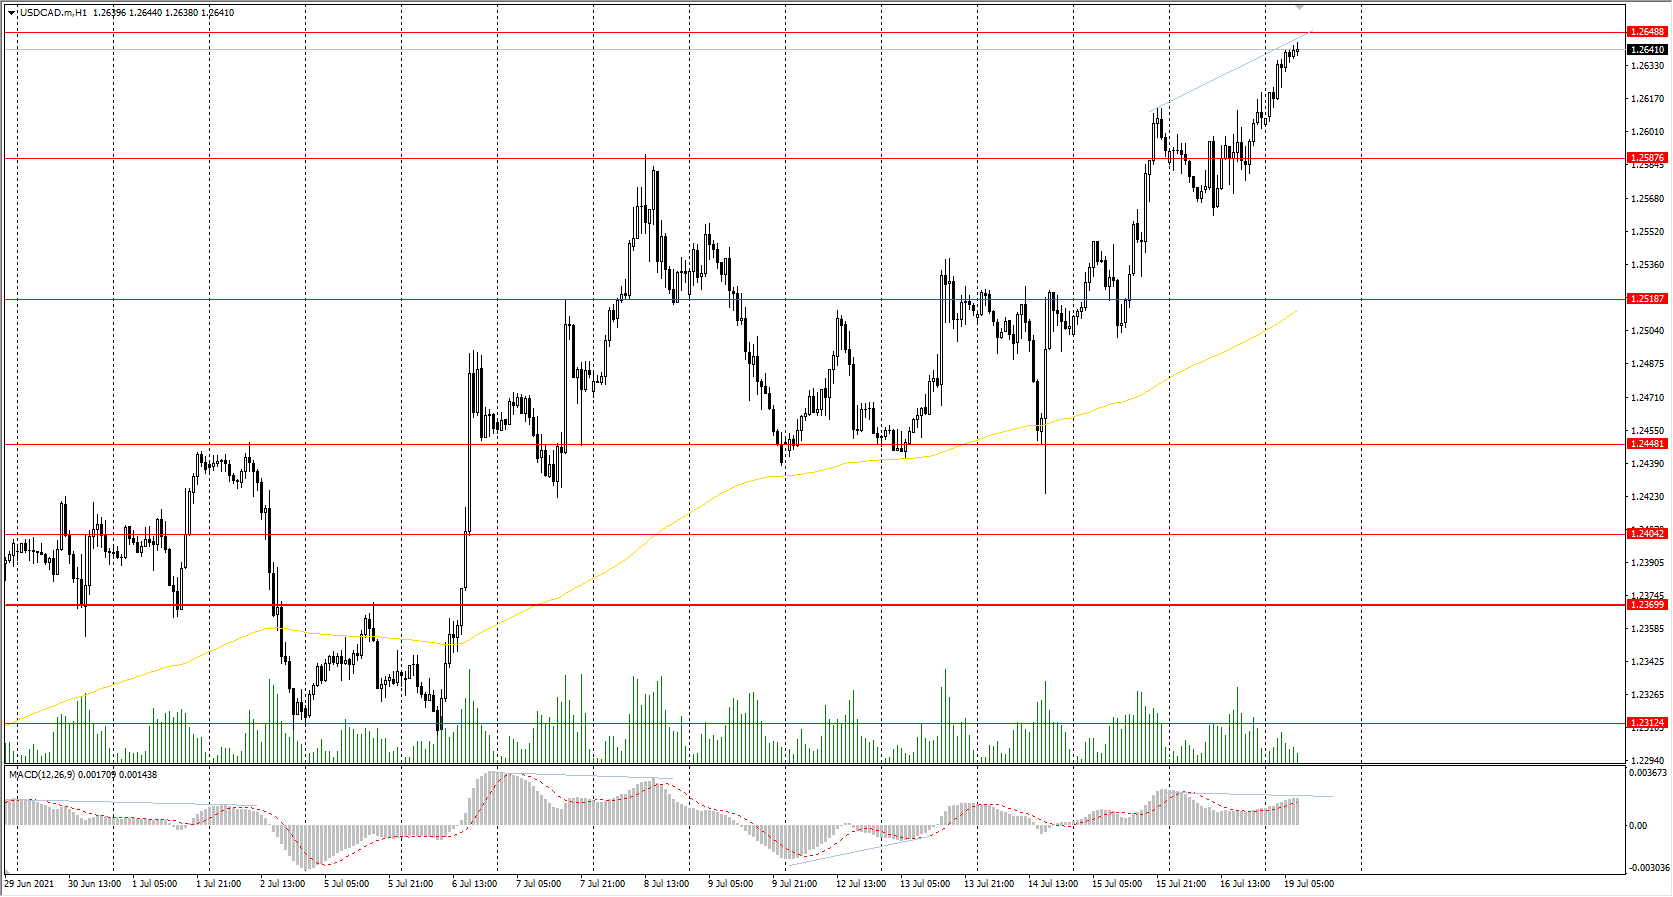
The USD/CAD currency pair added another 0.17% on Friday. The growth was caused by two factors: the dollar index and oil prices. The dollar index is slowly growing, while oil prices are falling, which negatively affects the CAD.
Trading recommendations
Support levels: 1.2587, 1.2519, 1.2448, 1.2404, 1.2347, 1.2312, 1.2260, 1.2190
Resistance levels: 1.2649
Technically, the trend remains bullish. The price is growing, and there isn’t significant resistance from the sellers. The MACD indicator is in the positive zone, but there are already the first signs of reversal in the form of divergence. Under such market conditions, it is better to consider intraday trading. You should look for buy positions from the support levels after a small pullback, as resistance levels are ahead and the price is quite strongly deviated from the midline. Sell positions can be found from the resistance levels, but be very careful, as it will be trading against the main trend.
Alternative scenario: if the price breaks through the 1.2370 support level and fixes below, the downtrend is likely to be resumed.
Daily Tecnical Analysis
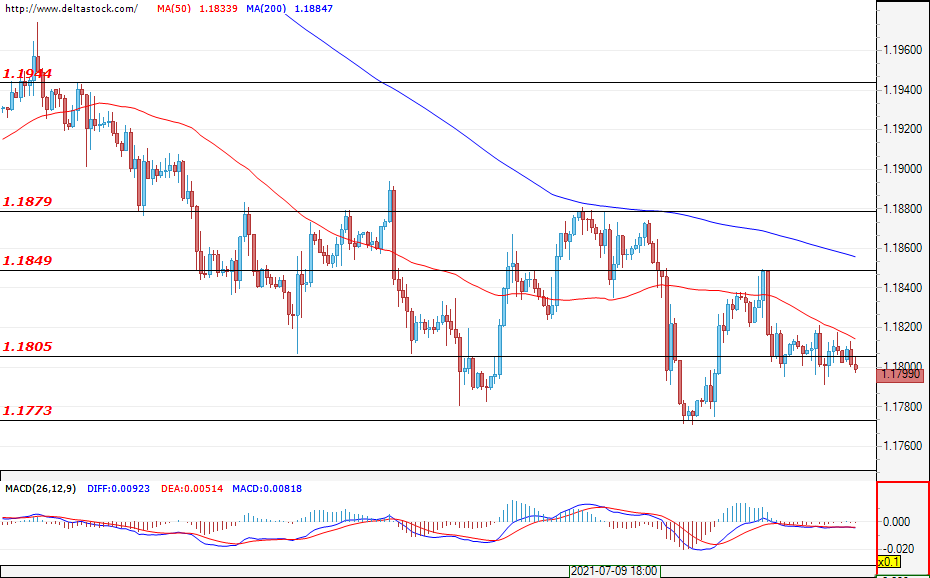
EUR/USD
Current level - 1.1799
The Greenback is holding firmly against the euro and the other global currencies. The possibility of interest rates in the U.S. increasing after the higher-than-expected inflation report strengthened the bearish sentiment for the EUR/USD. At the time of the analysis, the market is consolidating and the bears are expected to re-test the 1.1770 support. If successful, the next targets for them could be the support zones at 1.1690 and at 1.1600. The most significant economic events for this week are scheduled for its second half (Thursday), when the ECB will announce the new interest rates (11:45 GMT) and will give a press conference (12:30 GMT).
| Resistance | Support | ||
| intraday | intraweek | intraday | intraweek |
| 1.1805 | 1.1879 | 1.1770 | 1.1690 |
| 1.1849 | 1.1944 | 1.1717 | 1.1600 |
USD/JPY
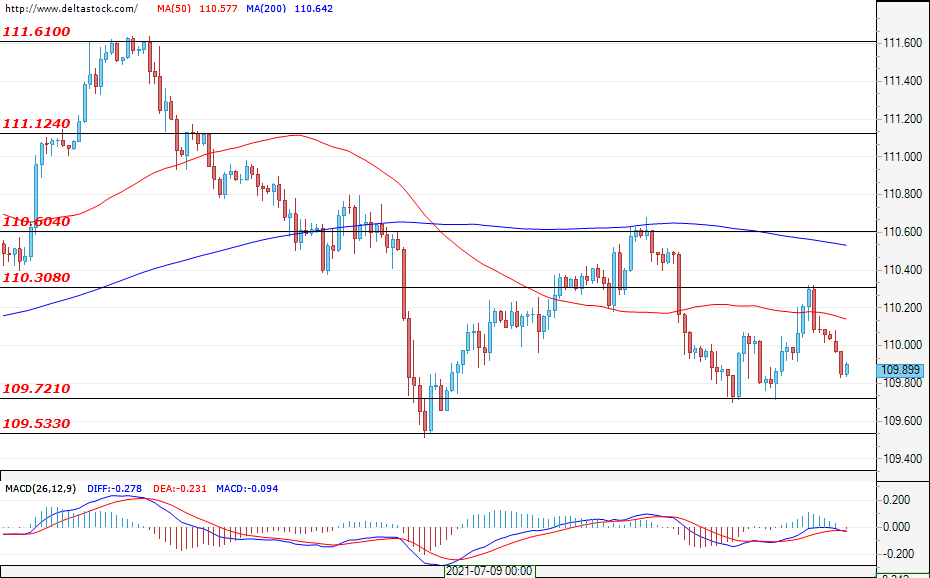
Current level - 109.89
The bears seem to be easing their pressure after initially failing to breach the support at 109.72. It is possible for the market to continue to trade in the range between 109.72 and the resistance at 110.60. If the sell-off resumes and the area between 109.53 and 109.72 is breached, the next target for sellers could be 109.20 or even 108.55.
| Resistance | Support | ||
| intraday | intraweek | intraday | intraweek |
| 110.30 | 111.12 | 109.72 | 109.20 |
| 111.60 | 111.61 | 109.53 | 108.55 |
GBP/USD
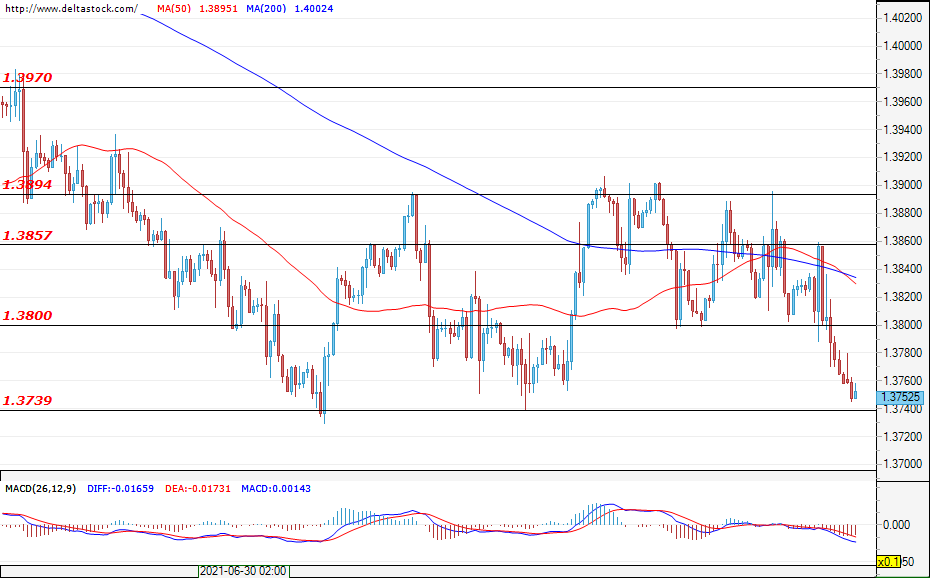
Current level - 1.3752
The currency pair is found just above the 1.3740 support and it is expected to be violated after it endured several previous tests. If the support does not last, the next target for the bears may be the area at around 1.3670. A pullback move towards the resistance of 1.3800 is not excluded, but a change in market sentiment would only occur if prices remain above 1.3857.
| Resistance | Support | ||
| intraday | intraweek | intraday | intraweek |
| 1.3800 | 1.3894 | 1.3740 | 1.3560 |
| 1.3857 | 1.3970 | 1.3670 | 1.3450 |
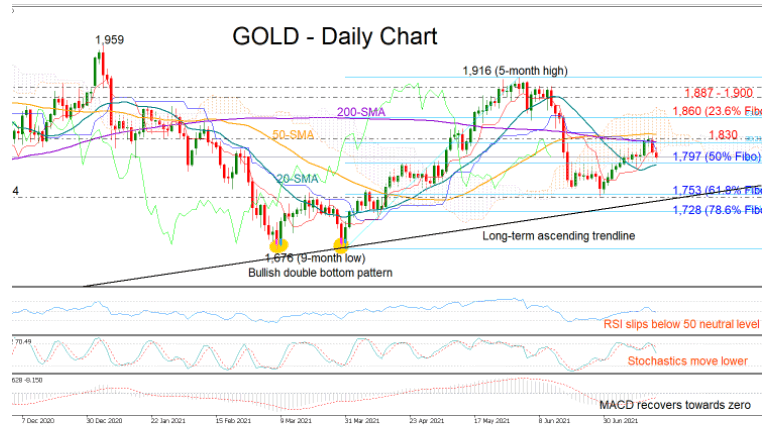
Gold Drags Below 200-SMA, 1,800 In Focus
Gold started the week on a slightly negative note, aiming to extend Friday’s pullback from the 200-day simple moving average (SMA) towards the 1,800 level.
Another downside correction is likely given the weakness in the Stochastics and the bearish reversal in the RSI, which is ready to step back below its 50 neutral level.
On the other hand, the steady recovery in the MACD is creating some speculation about whether any downfall could survive below the 1,800 mark, where the 50% Fibonacci of the 1,676 – 1,916 up leg and the 20-day SMA are also positioned.
Failure to hold above 1,800 could generate a more aggressive decline towards the 61.8% Fibonacci of 1,753, while within breathing distance, the long-term ascending trendline from the 2019 lows could build a stronger floor. If selling pressures persist, the next stop could be the 78.6% Fibonacci of 1,728.
In the positive scenario where the precious metal breaches the wall between its 200- and 50-day SMAs, the next obstacle could emerge around the 23.6% Fibonacci of 1,860. Moving higher, the price may face some consolidation within the 1,887 – 1,900 zone before pushing for fresh highs above 1,916.
Meanwhile in the long-term picture, the downtrend from the 2,079 peak remains valid as long as the price continues to fluctuate below 1,959.
Summarizing, gold is facing a neutral-to-bearish bias in the short-term picture, where a decisive close below 1,800 is expected to give fresh impetus to the latest pullback.
EUR/USD Pressured By SMAS
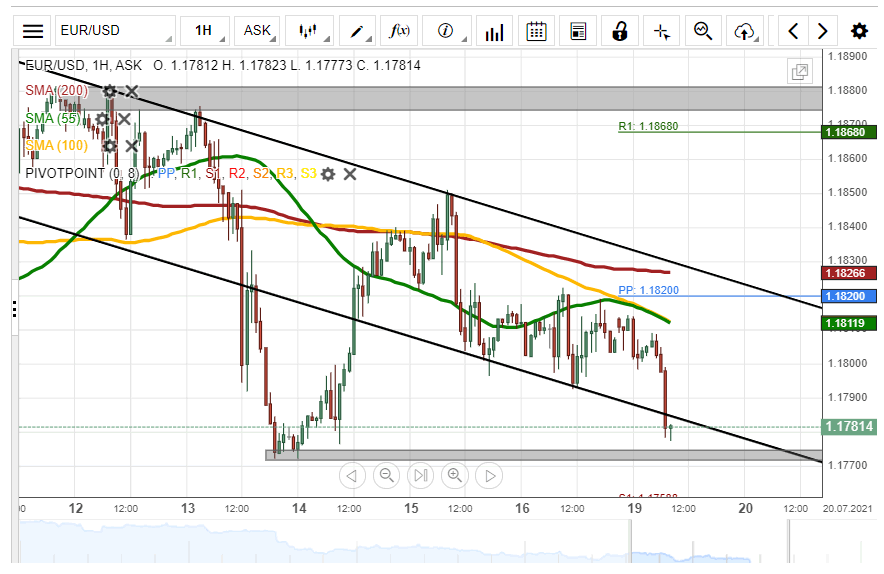
The decline of the EUR/USD currency exchange rate found support at the lower boundary of a descending channel pattern at 1.1790.
In the near term future, if the currency pair surges, it would have to pass the resistance cluster of the 55– and 100– hour simple moving averages near the 1.1815 level.
On the other hand, a passing of the support level formed by the lower line of the channel pattern near 1.1790 would immediately find support in the weekly support level at 1.1758.
GBP/USD Fails To Surpass Resistance
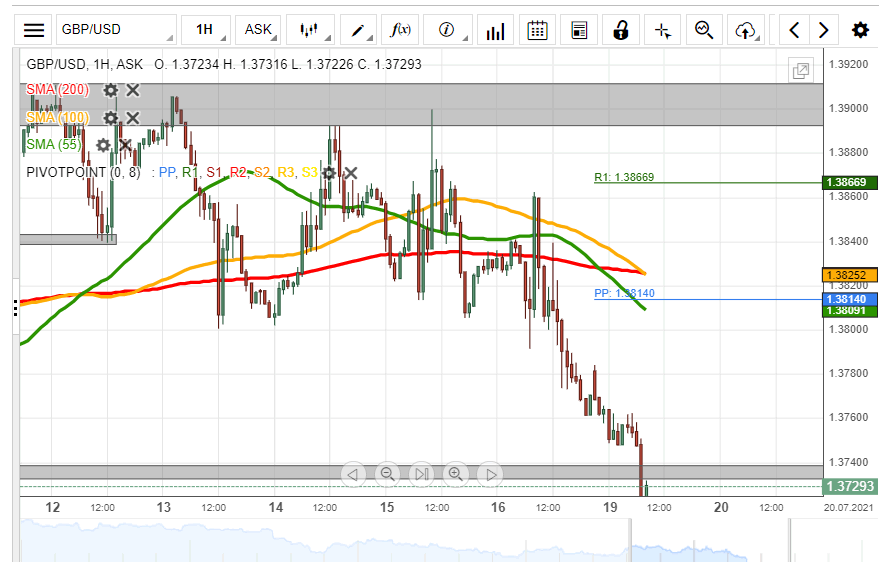
The GBP/USD currency pair failed to surpass the resistance levels formed by the 55-, 100– and 200– hour SMAs on Friday. As a result, the exchange rate fell by 97 pips or 0.70% during Friday's trading session.
In the near future, the currency exchange rate might pass the weekly support level near the 1.3720 mark. In this case scenario, bears could target the 1.3700 level within this session.
On the other hand, the bearish traders might encounter support near the 1.3740 area today.
EUR/USD Daily Outlook
Daily Pivots: (S1) 1.1788; (P) 1.1820; (R1) 1.1843; More...
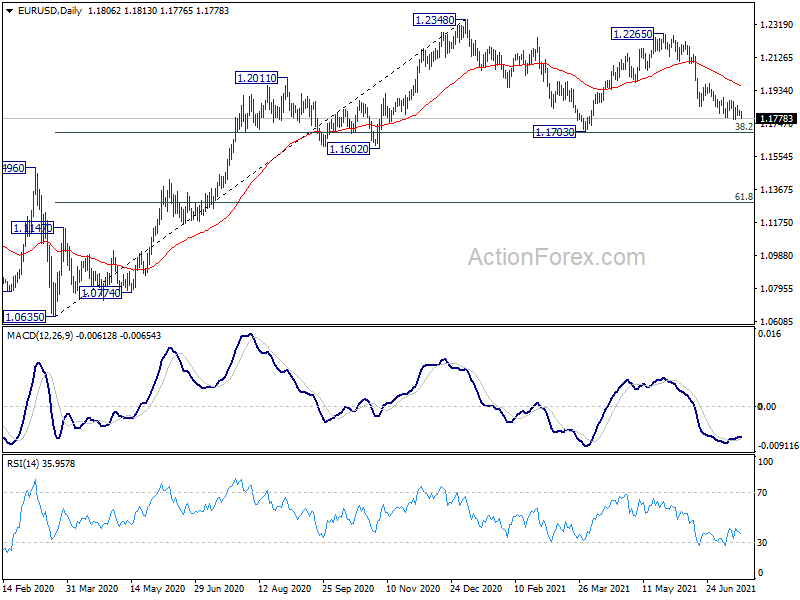
Intraday bias in EUR/USD remains neutral for the moment. On the downside, break of 1.1771 will resume the fall from 1.2265, as the third leg of correction from 1.2348, to 1.1703 support. On the upside, though, break of 1.1880 will indicate short term bottoming and turn bias back to the upside for stronger rebound to 1.1974 resistance first.
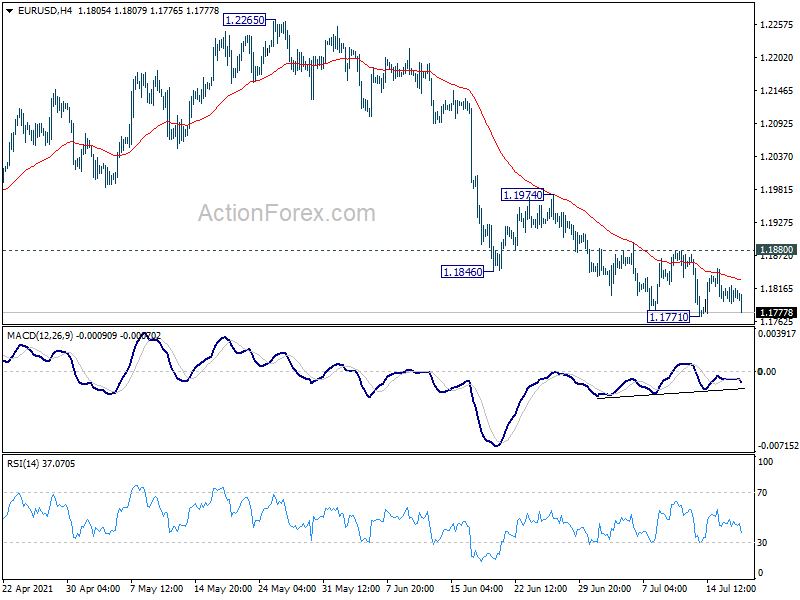
In the bigger picture, rise from 1.0635 is seen as the third leg of the pattern from 1.0339 (2017 low). Further rally could be seen to cluster resistance at 1.2555 next, (38.2% retracement of 1.6039 to 1.0339 at 1.2516). This will remain the favored case as long as 1.1602 support holds. Reaction from 1.2555 should reveal underlying long term momentum in the pair. However sustained break of 1.1602 will argue that the rise from 1.0635 is over, and turn medium term outlook bearish again.