Sample Category Title
GBP/JPY Daily Outlook
Daily Pivots: (S1) 151.10; (P) 151.86; (R1) 152.28; More...
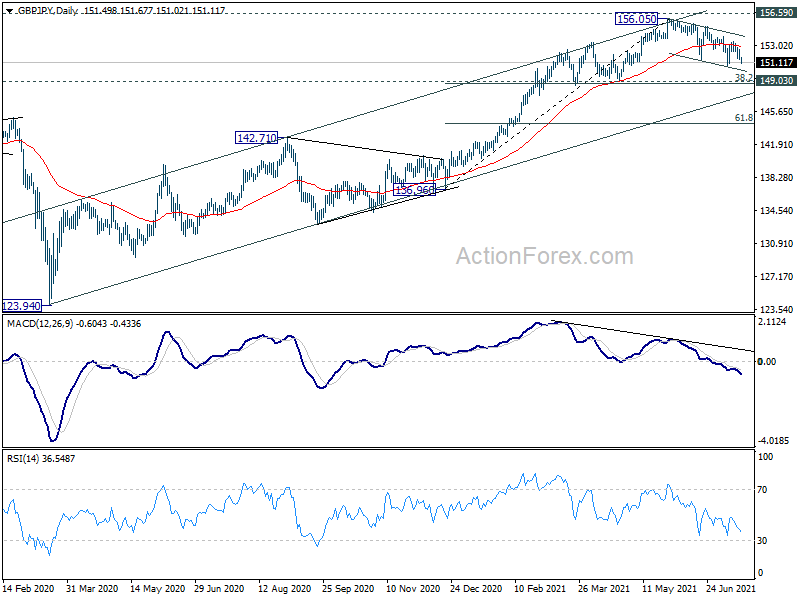
Intraday bias in GBP/JPY remains neutral first. On the downside break of 150.64 will resume the corrective fall from 156.05. We'd look for strong support from 38.2% retracement of 136.96 to 156.05 at 148.75 to bring rebound. On the upside, break of 153.46 will turn bias back to the upside for 155.13/156.05 resistance zone.
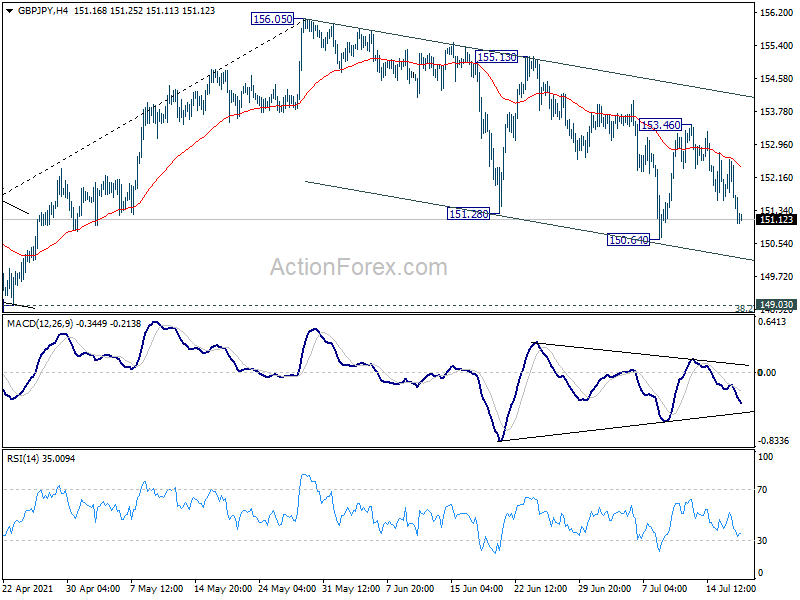
In the bigger picture, rise from 123.94 is seen as the third leg of the pattern from 122.75 (2016 low). Focus remains on 156.59 resistance (2018 high). Sustained break there should confirm long term bullish trend reversal. Next target is 61.8% retracement of 195.86 (2015 high) to 122.75 at 167.93. On the downside, break of 149.03 support is needed to be the first sign of completion of the rise from 123.94. Otherwise, outlook will remain bullish even in case of deep pull back.
OPEC+ Lands Deal To Increase Oil Production
Market movers today
- Today is a very quiet day without any important data releases. This week, we are looking forward to the ECB meeting on Thursday and the preliminary PMIs for July due out on Friday. .
The 60 second overview
OPEC+: On Sunday OPEC+ (OPEC and additional oil-exporting countries including Russia and Kazakhstan) agreed to gradually scale back production cuts implemented as prices tumbled at the outbreak of the pandemic in early spring of last year. The cartel said it targeted the end of 2022 as the end of current in-place cuts. The initial increase in production will add 400,000 barrels per day starting in August rising to 2m barrels at the end of this year, and continuing to increase until the accumulated cuts of 5,8m barrels per day has been revived. A deal has been long overdue with the UAE and Saudi Arabia clashing on multiple occasions in public recently, as UAE have found its production baseline set at a too low level. The oil price has been increasing throughout this year and is currently standing at USD 73 per barrel up from USD 52 at the beginning of the year. The price has been declining somewhat in past days (and this morning) as expectations moved towards a deal.
German polls: Opinion polls out of Germany on Saturday showed only small changes with support rising slightly for the Greens now standing at 18% of the popular vote and CDU/CSU at 28%. The 18% would be enough for the Greens to enter into a coalition with SPD (17%) and FDP (12%). Polling was conducted in part before large floods destroyed multiple towns in the western part of the country.
Equities: Equities are in general lower this morning with tech continuing to underperform. Nikkei is down 1.3% and Hang Seng 1.6%. S&P futures also indicates a weak opening to US markets later in the day and is down 1%. Equity markets have been somewhat under water during the past week as new covid-19 cases are currently growing globally. However, with almost all risk groups being fully vaccinated in the US and Europe, there should be a low correlation between new cases and hospitalisations.
FI: US government bond yields declined only modestly on Friday by 1bp in the 10y segment (10y yield now standing at below 1.30%) and curves flattened further. This morning sees the same trend continue. US retail sales covering the month of June showed a convergence towards a more normal consumption pattern among American households (ie. more service spending and less DIY), however, was not a market mover in rates.
FX: The USD ended last week on a strong footing and with the support from Friday's US retail sales release the greenback ended last week as one of the clear outperformers. In the Scandies, the NOK continues to trade on the back foot which reflects the global investment environment and not domestic news. EUR/SEK has broken above the 10.20 threshold and COVID-19 delta fears have weighed on GBP with EUR/GBP now back above 0.8550.
Credit: In line with European equities, credit remained under pressure on Friday where iTraxx Xover widened 1bp (to 238bp) and Main also widened slightly to close in 47½bp. HY bonds widened 1bp while IG was unchanged.
EUR/JPY Daily Outlook
Daily Pivots: (S1) 129.65; (P) 129.96; (R1) 130.29; More....
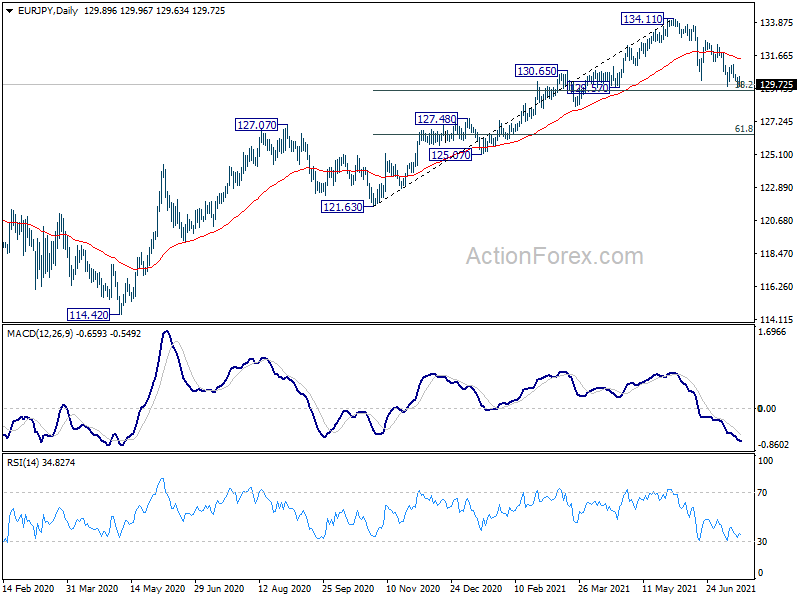
Intraday bias in EUR/JPY remains neutral at this point. On the downside, break of 129.60 will resume the corrective decline from 134.11. We'd look for strong support from 38.2% retracement of 121.63 to 134.11 at 129.34 to bring rebound. On the upside, break of 131.07 resistance will indicate short term bottoming, and bring stronger rebound back to 132.68 resistance first. However, firm break of 129.34 will bring deeper fall back to 127.07 resistance turned support.
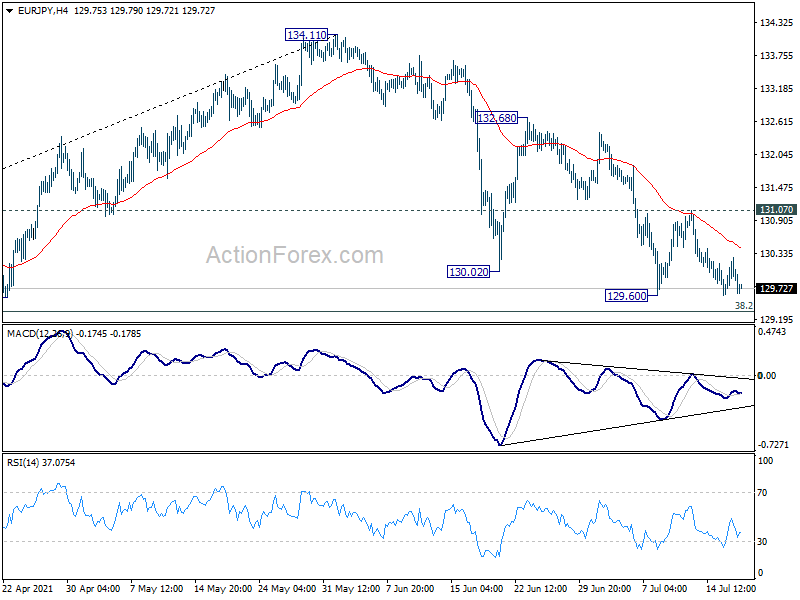
In the bigger picture, rise from 114.42 is seen as a medium term rising leg inside a long term sideway pattern. Next target is 137.49 (2018 high). Decisive break there will open up the possibility that it's indeed resuming the up trend from 94.11 (2012 low). For now, outlook will stay bullish as long as 127.07 resistance turned support holds, in case of pull back.
EUR/CHF Daily Outlook
Daily Pivots: (S1) 1.0840; (P) 1.0853; (R1) 1.0867; More....
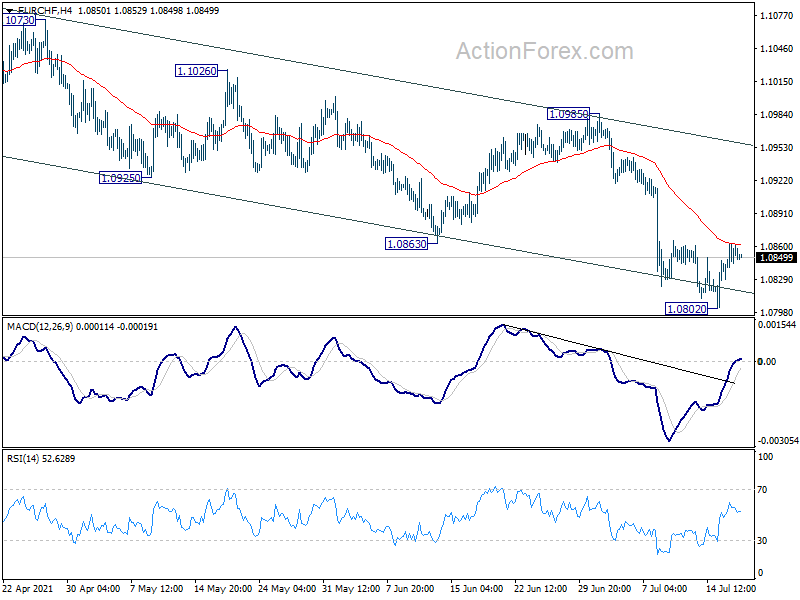
Intraday bias in EUR/CHF remains neutral for consolidation above 1.0802 temporary low first. Outlook will stay bearish as long as 1.0985 resistance holds. On the downside, break of 1.0802 will resume the decline from 1.1149, to 1.0737 cluster support next.
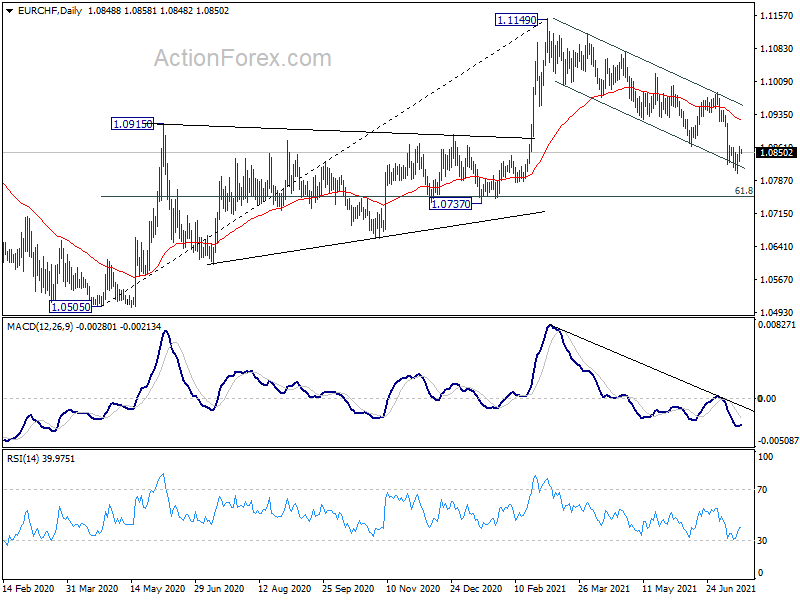
In the bigger picture, current development argues that rebound from 1.0505 (2020 low) might be completed with three waves up to 1.1149 already. Sustained trading below 55 week EMA (now at 1.0882) will affirm this bearish case. Further break of 1.0737 cluster support (61.8% retracement of 1.0505 to 1.1149 at 1.0751) will bring retest of 1.0505 low.
EUR/GBP Daily Outlook
Daily Pivots: (S1) 0.8541; (P) 0.8560; (R1) 0.8597; More...
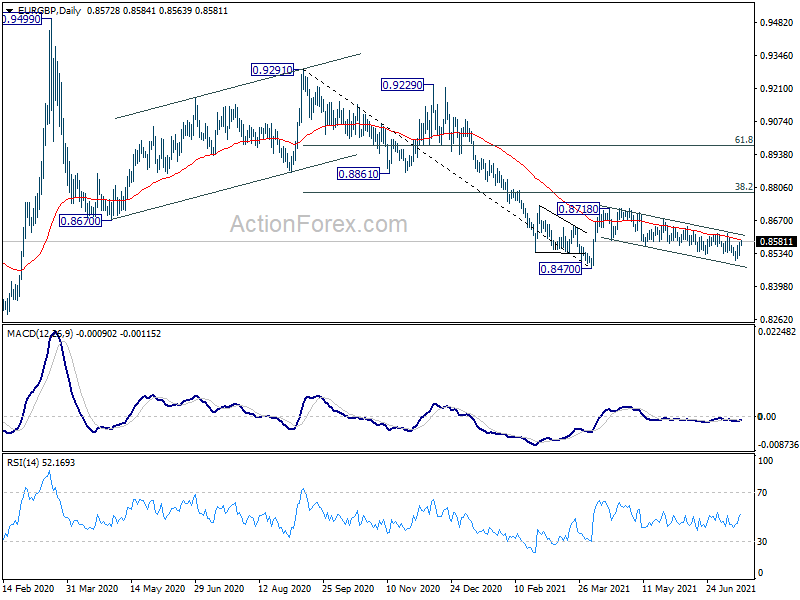
Intraday bias in EUR/GBP remains neutral for the moment. On the downside, break of 0.8502 will resume the choppy fall from 0.8718 to retest 0.8470 low. On the upside, though, break of 0.8616 resistance will indicate completion of the correction from 0.8718, and turn bias back to the upside, for 0.8670 resistance first.
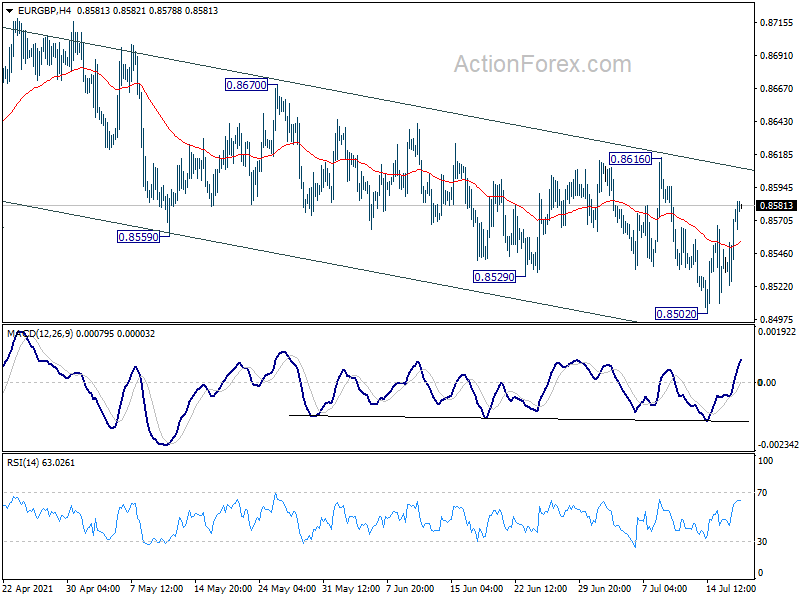
In the bigger picture, price actions from 0.9499 are still seen as developing into a corrective pattern. That is, up trend from 0.6935 (2015 low) would resume at a later stage. This will remain the favored case as long as 0.8276 support holds. However, firm break of 0.8276 support will suggest that rise from 0.6935 has completed and turn medium term outlook bearish.
EUR/AUD Daily Outlook
Daily Pivots: (S1) 1.5901; (P) 1.5935; (R1) 1.5997; More...
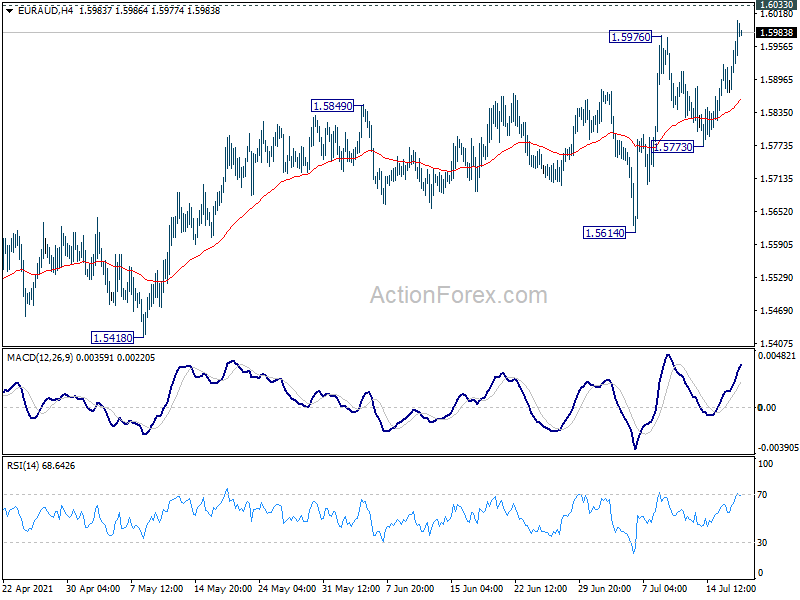
EUR/AUD's break of 1.5976 resistance suggests resumption of whole rise from 1.5250. Intraday bias is back on the upside for 1.6003 key resistance level. Decisive break there will argue that rise from 1.5250 is at least correcting the whole fall from 1.9799. Further rally would be seen to 1.6827 resistance next. For now, further rise is expected as long as 1.5773 support holds, in case of retreat.
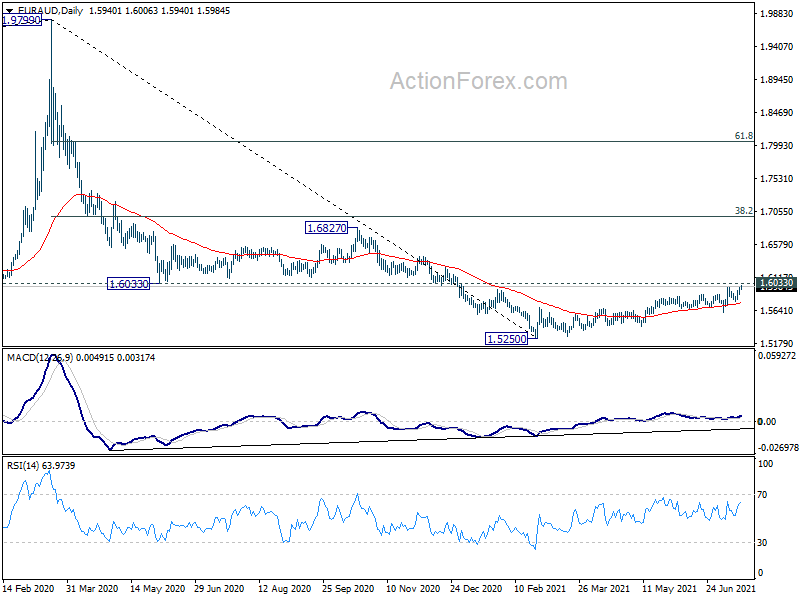
In the bigger picture, outlook stays bearish with 1.6033 support turned resistance intact for now. Fall from 1.9799, as a correction to to long term up trend from 1.1602 (2012 low) is still in favor to resume through 1.5250 later. However, firm break of 1.6033 will argue that such decline has completed. Stronger rebound would then be seen 38.2% retracement of 1.9799 to 1.5250 at 1.6988.
Yen Surges as Asia Opens on Risk Aversion
Yen rises broadly as the markets start the week with risk aversion in Asia. On the other hand, Canadian Dollar is trading as the weakest, leading other commodity currencies lower. European majors are mixed together with Dollar for the moment. The economic calendar is rather light today and focuses will stay on development in the risk markets. Though, attention will be turning to ECB meeting later in the week, in particular its new forward guidance.
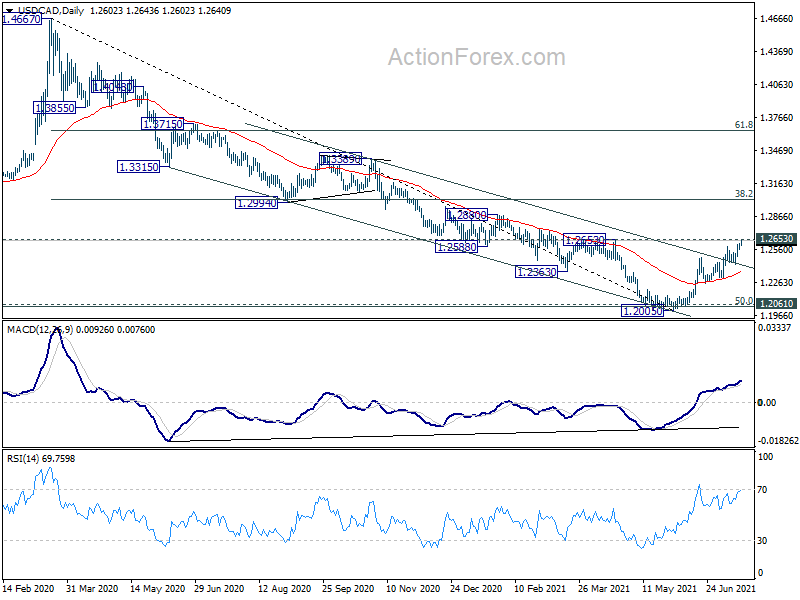
Technically, AUD/JPY and CAD/JPY has already broke out to the downside. Eyes will be on 129.60 support in EUR/JPY and 150.64 support in GBP/JPY. Break of these levels will align the developments with other Yen crosses and solidify Yen's near term strength. At the same time, USD/CAD is edging close to 1.2653 structural resistance. Break there will also solidify the case of medium term bullish reversal, which could then see USD/CAD heading back to 1.3 handle.
In Asia, at the time of writing, Nikkei is down -1.40%. Hong Kong HSI is down -1.57%. China Shanghai SSE is down -0.12%. Singapore Strait Times is down -0.95%. Japan 10-year JGB yield is down -0.004 at 0.017.
Hong Kong HSI gaps down after US warned of business risks
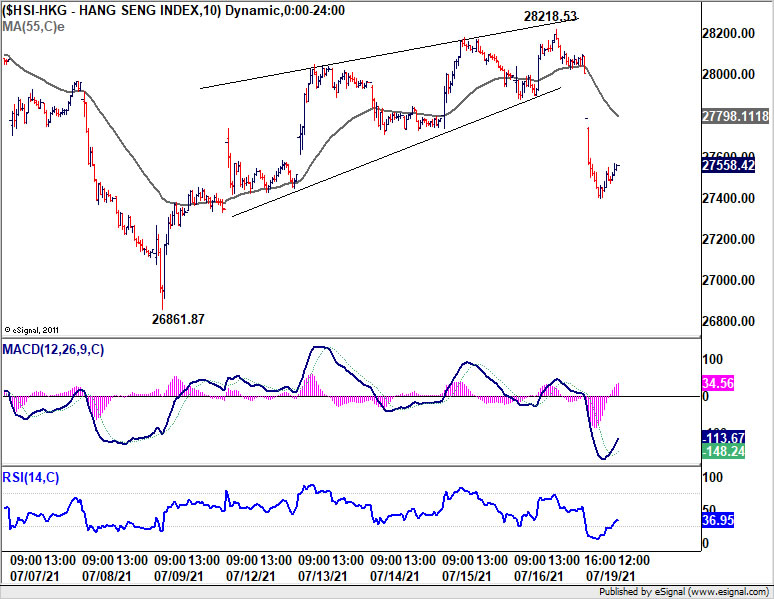
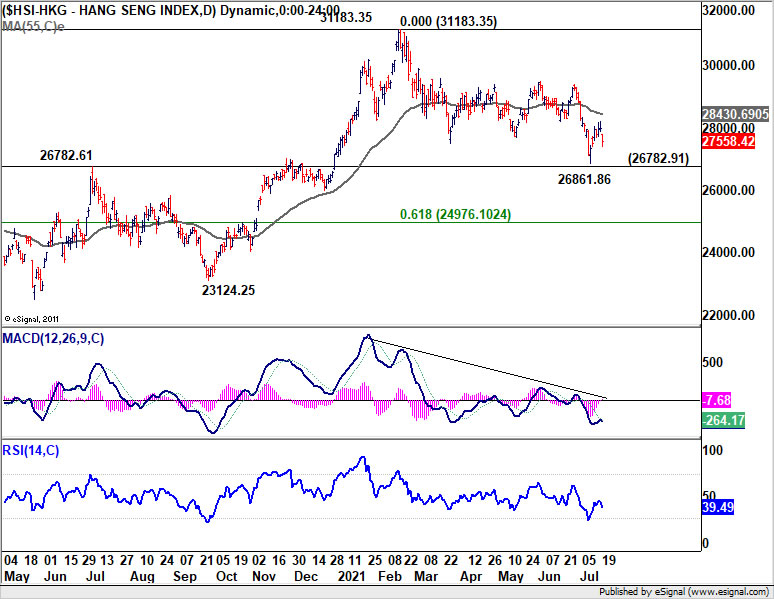
Asian markets are trading broadly lower as led by Hong Kong HSI, which is down nearly -1.6% at the time of writing. In a late move last week, the US administration published a nine-page Hong Kong Business Advisory, jointly by the departments of State, Treasury, Commerce and Homeland Security. The document warned US firms of encountering a number of risks posed by China's national security law in the city.
Today's gap down in HSI suggests that corrective rebound from 26861.87 could have completed at 28218.52 already. The failure to even touch 55 day EMA is a near term bearish sign. The index could at least have another test on 26782.61 key medium term resistance turned support. Such development to cap gains in other Asian markets, and give Yen additional support.
AUD/JPY and CAD/JPY downside breakouts on risk aversion
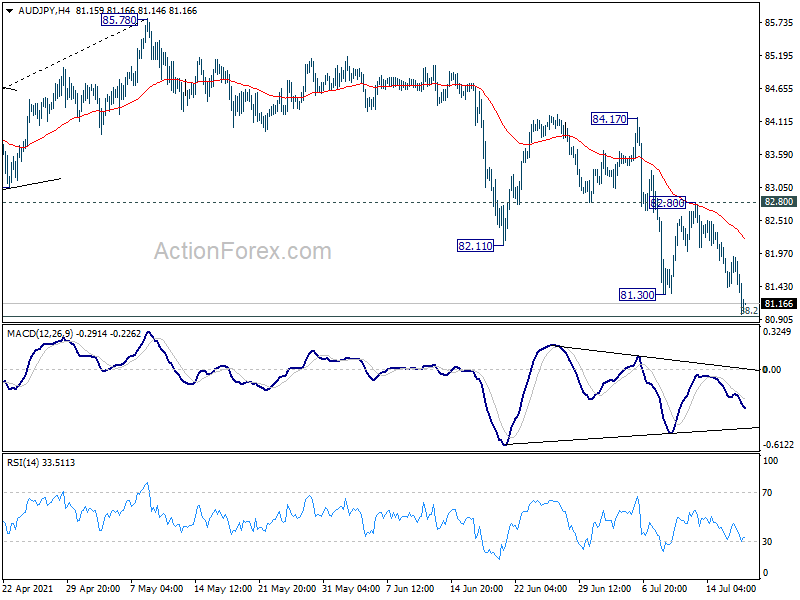
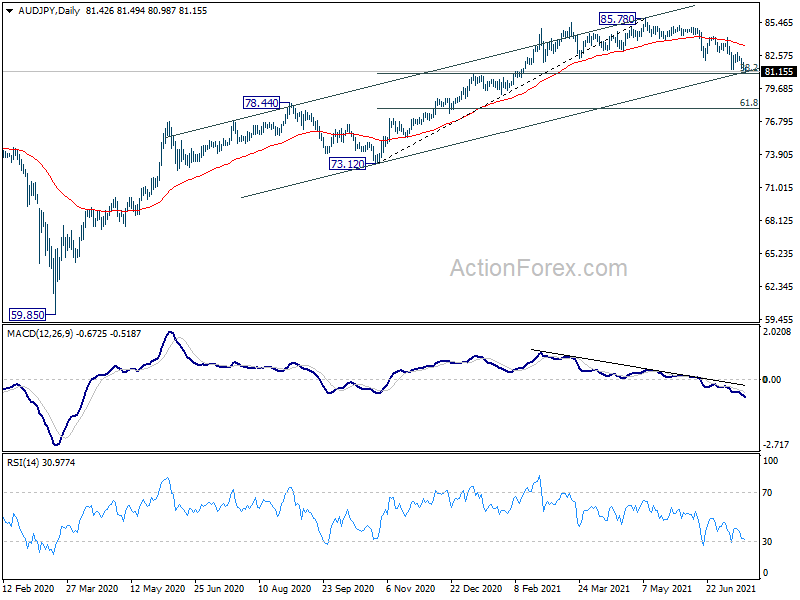
AUD/JPY and CAD/JPY break out to the downside on risk aversion in Asian markets. AUD/JPY's fall from 85.78 resumed and hits as low as as 80.98 so far. Rejection by 4 hour 55 EMA is a near term bearish sign and outlook will stay bearish as long as 82.80 resistance.
Immediate focus is now on 38.2% retracement of 73.12 to 85.78 at 80.94, which is close to medium term channel support. Sustained break there will argue that the fall from 85.78 is indeed corrective whole up trend from 59.85. Deeper fall could then be seen back to 73.12/78.44 support next next.
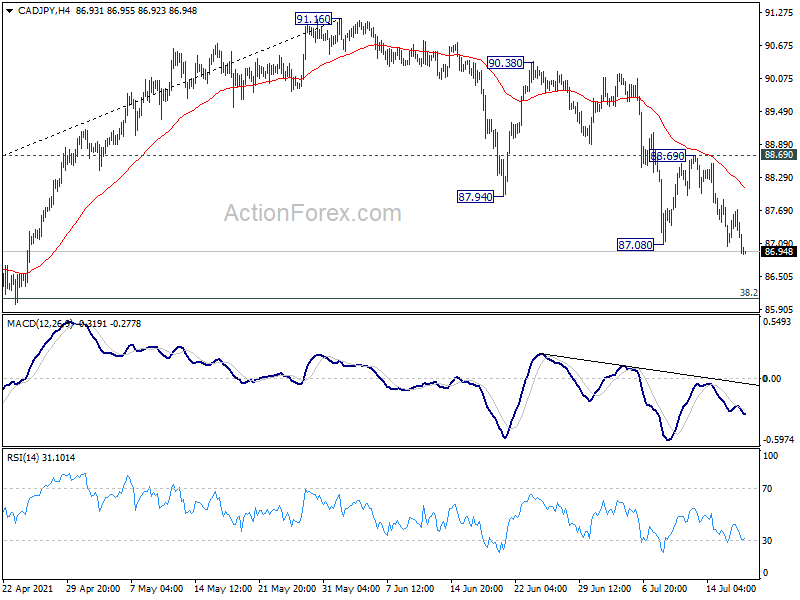
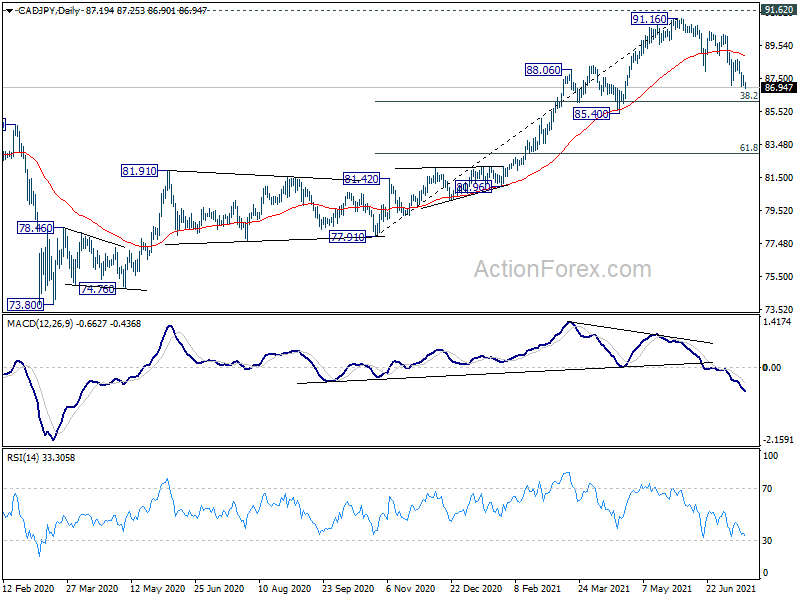
CAD/JPY also breaks through 87.08 support to resume the whole decline from 91.16. Outlook will stay bearish as long as 88.69 resistance holds. Current fall would target 38.2% retracement of 77.91 to 91.16 at 86.09. Reaction from there would unveil whether it's correcting the rise from 77.91, or the whole up trend from 73.80.
ECB to adjust forward guidances, PMIs watched
ECB meeting will be the major focus this week. In particular, it's known that the central bank will change it forward guidance to reflect the new 2% symmetric inflation target. Other than that, there is little chance for any change in monetary policy. It's too early to indicate what ECB would do in Q4 regarding the pace of asset purchases, not to mention adjustment in interest rates.
Also on central bank front, RBA and BoJ will release meeting minutes. On the data front, major focuses will be towards the end of the week, with PMIs from Australia, UK, Eurozone and US.
Here are some highlights for the week:
- Monday: UK Rightmove house price index; US NAHB housing index.
- Tuesday: Japan CPI core; RBA minutes; Swiss trade balance; Germany PPI; Eurozone current account; US housing starts and building permits.
- Wednesday: BoJ minutes, Japan trade balance; Australia retail sales; UK public sector net borrowing; Canada new housing price index.
- Thursday: Australia goods trade balance,NAB quarterly business confidence; ECB rate decision; US jobless claims, existing home sales.
- Friday: Australia PMIs; UK Gfk consumer confidence, retail sales, PMIs; Eurozone PMIs; Canada retail sales; US PMIs.
EUR/AUD Daily Outlook
Daily Pivots: (S1) 1.5901; (P) 1.5935; (R1) 1.5997; More...
EUR/AUD's break of 1.5976 resistance suggests resumption of whole rise from 1.5250. Intraday bias is back on the upside for 1.6003 key resistance level. Decisive break there will argue that rise from 1.5250 is at least correcting the whole fall from 1.9799. Further rally would be seen to 1.6827 resistance next. For now, further rise is expected as long as 1.5773 support holds, in case of retreat.
In the bigger picture, outlook stays bearish with 1.6033 support turned resistance intact for now. Fall from 1.9799, as a correction to to long term up trend from 1.1602 (2012 low) is still in favor to resume through 1.5250 later. However, firm break of 1.6033 will argue that such decline has completed. Stronger rebound would then be seen 38.2% retracement of 1.9799 to 1.5250 at 1.6988.
Economic Indicators Update
| GMT | Ccy | Events | Actual | Forecast | Previous | Revised |
|---|---|---|---|---|---|---|
| 23:01 | GBP | Rightmove House Price Index M/M Jul | 0.70% | 0.80% | ||
| 14:00 | USD | NAHB Housing Market Index Jul | 82 | 81 |
AUD/JPY and CAD/JPY downside breakouts on risk aversion
AUD/JPY and CAD/JPY break out to the downside on risk aversion in Asian markets. AUD/JPY's fall from 85.78 resumed and hits as low as as 80.98 so far. Rejection by 4 hour 55 EMA is a near term bearish sign and outlook will stay bearish as long as 82.80 resistance.
Immediate focus is now on 38.2% retracement of 73.12 to 85.78 at 80.94, which is close to medium term channel support. Sustained break there will argue that the fall from 85.78 is indeed corrective whole up trend from 59.85. Deeper fall could then be seen back to 73.12/78.44 support next next.
CAD/JPY also breaks through 87.08 support to resume the whole decline from 91.16. Outlook will stay bearish as long as 88.69 resistance holds. Current fall would target 38.2% retracement of 77.91 to 91.16 at 86.09. Reaction from there would unveil whether it's correcting the rise from 77.91, or the whole up trend from 73.80.
Hong Kong HSI gaps down after US warned of business risks
Asian markets are trading broadly lower as led by Hong Kong HSI, which is down nearly -1.6% at the time of writing. In a late move last week, the US administration published a nine-page Hong Kong Business Advisory, jointly by the departments of State, Treasury, Commerce and Homeland Security. The document warned US firms of encountering a number of risks posed by China's national security law in the city.
Today's gap down in HSI suggests that corrective rebound from 26861.87 could have completed at 28218.52 already. The failure to even touch 55 day EMA is a near term bearish sign. The index could at least have another test on 26782.61 key medium term resistance turned support. Such development to cap gains in other Asian markets, and give Yen additional support.
Forex and Cryptocurrencies Forecast
First, a review of last week's events:
EUR/USD. Macroeconomic data continued to arrive last week, indicating a recovery in the US economy and labor market. Inflation figures released on Tuesday July 13 were well above forecasts. Τhe consumer price index increased by 0.9% ιn June, and by 5.4% and on an annualized basis, which is the highest growth rate since 2008. The core index, which excludes energy and food prices, has posted record growth since 1991, at 4.5% year on year.
The number of primary claims for jobless benefits dropped by 26,000 to 360,000 from July 04 to 10. This is the lowest since March 20, when the coronavirus pandemic struck the economy first. Earlier this month, the US Department of Labor released data showing that the number of jobs in the country increased over the past month by 850,000 (up 583,000 in May).
The US import price index rose 1% in June, while import prices excluding oil rose 0.7% in June. The Fed-New York manufacturing index rose from 17.4 to 43.0 for the month, also well above the forecast. According to the Federal Reserve data released on Thursday July 15, industrial production in the US as a whole increased by 0.4% in June compared to May, which also indicates a good pace of recovery in the US economy.
By "pre-covid" logic, all this data would have strengthened the dollar seriously. However, it has risen against the euro by just about 50 points in the past four weeks. And the pair has generally been in a sideways corridor with a minimal dominance of bears for the last two weeks: it traded in the range of 1.1780-1.1895 from July 05 to 09, and in the 1.1770-1.1880 range from July 12 to 16.
These figures fully confirmed the compromise scenario presented by the experts. As for the forecast of graphical analysis, it turned out to be almost perfect. Recall that it indicated a sideways trend within 1.1780-1.1900 on H4.
So why isn't the American currency growing? The reason lies in the hesitancy and doubts that still bedevil the US Fed. The head of this regulator Jerome Powell said speaking on July 14 at the Financial Services Committee of the US Congress that his department would not rush to tighten credit and financial policy and reduce the purchase of assets within the framework of QE. He repeated roughly the same thing the next day, in front of the Senate Banking Committee.
Powell acknowledged that inflation is growing faster than expected, and if it goes beyond acceptable limits, monetary policy will have to be tightened ahead of schedule. But for now, the economy is "still far" from set goals. The rise in inflation, like many other factors, can be temporary. But after they disappear, they can be replaced by others. Now, the spread of the new COVID-19 strain supports the dollar against commodity currencies, but there is no telling how the markets will behave in the future. It is unclear how the early curtailment of the fiscal stimulus program will affect their mood as well.
As a result, having given all this portion of doubts to the congressmen, Powell assured them that the Fed was certainly monitoring the situation closely and would respond promptly to its changes. However, the head of the central bank was unable to influence investor sentiment in any way (or perhaps did not want to), as a result of which the EUR/USD pair remained within a narrow trading range and completed the five-day period at 1.1805;
GBP/USD. The pair failed to gain a foothold above the resistance of 1.3900 over the past week. As with EUR/USD, bears had a slight advantage, helped by positive economic statistics from the USA. Great Britain could not please with anything like that. And although the number of applications for unemployment benefits for the month decreased by 24% - from 151,400 to 114,800, the unemployment rate remained at the same level of 4.8% (instead of the forecast drop to 4.7%). Investors are also worried about the onset of a new wave of COVID-19, due to which the number of new infections here has exceeded 50,000 per day. As a result, despite the fact that the bulls managed to keep the pair in the 1.3800-1.3900 channel all week, its lower border was broken on Friday, July 16 and the pair finished at 1.3760;
USD/JPY. It was not possible to understand the sentiment of investors, as well as indicators, last week. The experts' voices were almost equally divided: 30% sided with the bulls, 40% with the bears, and 40% just shrugged their shoulders. The inconsistency in the indicators' readings did not allow bringing their readings to any common denominator either. And, as the past five days have shown, it was this lack of forecast that proved to be the most accurate prediction: the USD/JPY pair drew a virtually perfect sinusoid.
As expected, the Bank of Japan did not present any surprises on Friday, July 16, and did not surprise anyone with its inaction, once again confirming the country's reputation as a super-safe haven for investors. Bank Governor Haruhiko Kuroda did not utter a single new intriguing word during the press conference once again. Investors knew very well without him that the Japanese economy remains in a difficult situation, but the level of activity will increase as the population is vaccinated.
The balance of power between the dollar and the yen was not affected by the discrepancy in the macroeconomic indicators of the United States and Japan. As a result, the pair ended the week almost where it started, at 110.05;
cryptocurrencies. Bitcoin was ripping up in late June to early July, wishing to break through the $36,000 resistance. However, none of the attempts made by the bulls were successful. Now the initiative has passed to the bears, and we saw the opposite picture last week: the desire to drop the BTC/USD pair below the psychologically important level of $30,000, after which another wave of mass sales may follow.
Trading volumes on major crypto exchanges including Coinbase, Kraken, Binance, and Bitstamp fell more than 40% in June, according to CryptoCompare. The decline in volumes was due to falling prices and lower volatility. But not only. The absence of large investors, most of whom are now engaged in traditional markets, trying to understand the situation with the coronavirus and the accompanying steps of regulators, is also affecting.
At the time of this writing, the flagship currency is held in the $31,000-32,000 region. And according to Galaxy Digital crypto bank founder Mike Novogratz, this is because of the USA. He stated in a comment to CNBC that the US cryptocurrency community has taken an important defensive line in a market that has its bearish origins in Asia. "We see Asia selling bitcoin and the US buying back. China has declared war on the crypto industry as part of the broader Cold War that we are getting into."
To be honest, it is not yet clear whether it is good or bad that the crypto industry has grown to become a prominent part of the economic policies of the world's leading powers. Time will tell. Of course, Mike Novogratz can consider the exodus of miners from China to be a "big plus" and say that Beijing's repressive policies will not hinder the development of the industry. But judging by the charts, so far the advantage is on China's side. Many investors and traders prefer to stay out of the market for fear of further falls in quotes. Average daily trading turnover is now 76% below peak levels when the price was above $60,000. The total capitalization of the crypto market declined by nearly $100 billion in seven days, from $1.370 trillion to $1.275 trillion. And the Crypto Fear & Greed Index cannot get out of the Extreme Fear zone for several weeks now, fluctuating in the range from 20 to 22 points. (Recall that the market sentiment looked more optimistic a month ago, and the average value of the Index was 33 points).
As for the forecast for the coming week, summarizing the views of a number of experts, as well as forecasts made on the basis of a variety of methods of technical and graphical analysis, we can say the following:
EUR/USD. We talked about the doubts prevailing at the Fed in the first part of the review. In such a situation, the rare unity of analysts looks all the more surprising. Thus, 75% of them were voted for a stronger dollar and a decrease in EUR/USD, 25% for the side trend, and, respectively, 0% for the euro to rise. Perhaps the principle "if you are not sure, buy dollar" worked.
According to 39 out of 41 Reuters experts, the Fed will curtail its monthly asset purchase program by $120 billion before the end of 2022. Three of them believe that this will happen very soon, this year already. The number of those who expect an interest rate increase in 2022, and not in 2023, is also growing. Therefore, the consensus forecast for QE completion is in the next year, which supports the US dollar. The new wave of COVID-19 is also playing on the side of the American currency, recalling that it was during the pandemic that the dollar gained great importance as a reserve currency.
It should be noted that with the transition to the forecast by the end of summer, the number of supporters of a weakening dollar and a strengthening of the euro among experts increases from 0% to 50%.
Graphical analysis on H4 still indicates a sideways trend within the channel 1.1780-1.1900. There is a mixture of red, green and neutral gray colors among the trend indicators and oscillators on H4, but the situation is different on D1: 100% of trend indicators and 85% of oscillators look down.
The nearest target of the bulls is 1.1880-1.1900, then 1.1975-1.2000, 1.2050 and 1.2150. The challenge before the end of summer is to update the high of May 25 1.2265. The bears' task is to test the March low of 1.1700. The nearest support on the way to this target is 1.1780.
The economic calendar for the coming week can note the ECB's interest rate decision on Thursday July 22. The rate is highly likely to remain unchanged, at 0%. Therefore, the subsequent press conference of the bank's management and its commentary on monetary policy is of much greater interest. According to Reuters, the ECB will have to decide at its meeting on Thursday what the new inflation target will mean for its future course. If the regulator is serious about raising inflation to 2% (compared to the previous target - close, but below 2%), then the large-scale purchase of assets is likely to continue. But the "hawks" insist on curtailing incentives, and therefore investors will be interested in whether the head of the Bank, Christine Lagarde, will be able to achieve a certain compromise.
The Markit PMI values in Germany and the Eurozone will become known the day after the ECB meeting, on July 23, on the basis of which it will be possible to get an impression of the pace of the European economic recovery;
GBP/USD. Experts are a little more optimistic about the future of the British currency than the future of the euro. So, 25% of specialists vote for the growth of the GBP/USD pair in the near future (as opposed to 0% for EUR/USD). The same is higher at the month and a half interval as well: 65% are bull supporters (the euro has 50%).
As for the technical analysis, there are only faint hints of a possible rise in the pair. 100% of trend indicators and 75% of oscillators are colored red on H4 (the remaining 25% are in the oversold zone). 85% of trend indicators and 75% of oscillators look south on D1.
Support levels are 1.3740, 1.3700, 1.3670 and 1.3600, resistance levels are 1.3800, 1.3840 and 1.3900. The further target of the bulls is the upper border of the medium-term channel 1.3700-1.4000;
USD/JPY. As in the case with the previous two pairs, in this case, the majority of experts (70%) expect the dollar to strengthen and a new attempt by the pair to gain a foothold above the level of 111.00. Such a forecast comes into a certain contradiction with the indications of technical analysis on D1. Here 65% of oscillators and 80% of trend indicators are colored red.
As for the graphical analysis, it draws the movement of the pair in the range of 109.70-110.40 on H4, with a subsequent fall to support at 109.30. The range of fluctuations is somewhat wider on D1: first, the fall to the zone 108.65-109.30, and then the rise to the resistance 111.00 and further growth to the July 02 high, 111.65;
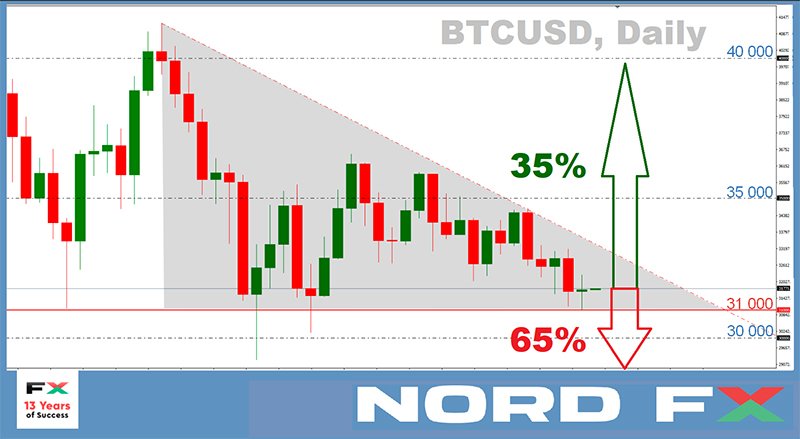
cryptocurrencies. We provided the key estimates of the digital market over the last period in the first part of the review. And they don't look rosy at all. It may be too early to talk about the onset of "crypto winter", but it is quite possible to call the current situation "crypto freezes". The BTC/USD chart continues to form a triangle with downward resistance and horizontal support around $31,000. 65% of analysts vote for its breakthrough during the coming month. That being said, according to some experts, if the bulls fail to hold that front line, we stand a lot of chances to see the pair in the region of $10,000 by the end of the year.
But, as usual, there is an opposite point of view as well. So, for example, analyst Will Clemente believes that bitcoin is already ready for a major price movement. He published a chart in his Twitter (136 thousand subscribers) with an indicator, which speaks of a possible imminent exit of the price of the first cryptocurrency from the narrow range. As to the direction of the bitcoin rate, Clemente wrote that he was optimistic. According to him, the market is now in the accumulation stage, and large players continue to actively buy the first cryptocurrency. "Whale" stocks increased by 65,429 BTC just last week. According to Clemente, there may be a shortage of supply of the main cryptocurrency in the near future, since large players often acquire assets for long-term purposes.
The expert also stressed that the growth in the number of cryptocurrency users continues. Whereas their number usually decreases after the peak in prices. But now there is no fall, and this is also an argument in favor of the upcoming growth of BTC.
Another specialist, Bloomberg analyst Mike McGlone, agrees with Clemente's opinion. According to him, the flagship cryptocurrency has reached a level where it can resume its rally towards $100,000. "Bitcoin is poised to return to a bullish trend in the second half of the year, and crude oil is ready to resume a bearish trend," McGlone wrote on Twitter. The expert is confident that the growth of the cryptocurrency will "have serious macroeconomic consequences" this time. It is worth noting, however, that this is not the first time McGlone predicts a sharp rise in digital assets. For example, he announced in early February that the volatility of bitcoin can increase the gap between its price and gold "hundreds of times."
No one knows yet which of the predictions will turn out to be correct. But there are a couple of ways to make money on cryptocurrency without spending a dime to buy it. However, both of these methods can be classified as "dirty" business. And this in our traditional heading crypto-life hacks.
First, you can help British IT engineer James Howells sort through rubbish. The fact is that this wonderful person threw a hard drive with 7,500 BTC into rubbish eight years ago, confusing it with another device. He then asked local authorities for permission to excavate a local dump to find his property but was refused. And now Howells has developed a new search plan using a super system with multiple conveyor belts, X-ray scanners and artificial intelligence. However, the implementation of this project requires significant financial costs. And if suddenly someone helps an engineer find the disk in a simple way, with the help of a shovel, he will surely share his new-found wealth. Today, his bitcoins are worth more than $230 million, and it is necessary to sort out "only" 300-400 thousand tons of waste.
Another way of "dirty" earnings was told by Reuters. According to this agency, students at Ulsan National Institute of Science and Technology (South Korea) make money from... going to the toilet. For each visit, they are paid a certain amount in digital currency Ggool.
One of the institute's professors has developed a plant that uses student waste to produce biogas. According to the scientist's calculations, a person produces about 500 grams of feces every day, which can be converted into 50 liters of methane. This amount of gas generates 0.5 kW of electricity, which is equal to the cost of a car to cover a distance of 1.2 km.
The science Initiative brings students up to 10 Ggool per day. The coin is accepted as payment in shops on campus. And the energy produced with the help of students powers a number of devices on the territory of the institute.