Sample Category Title
EUR/JPY Weekly Outlook
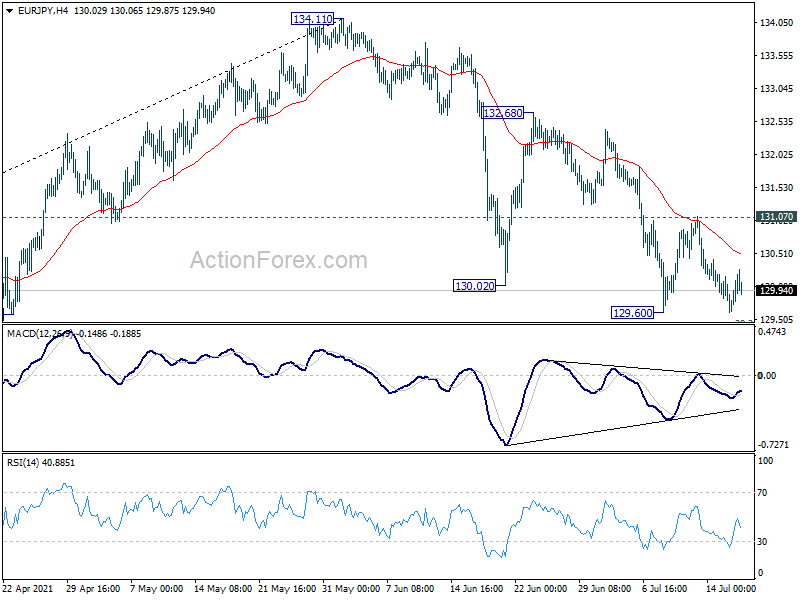
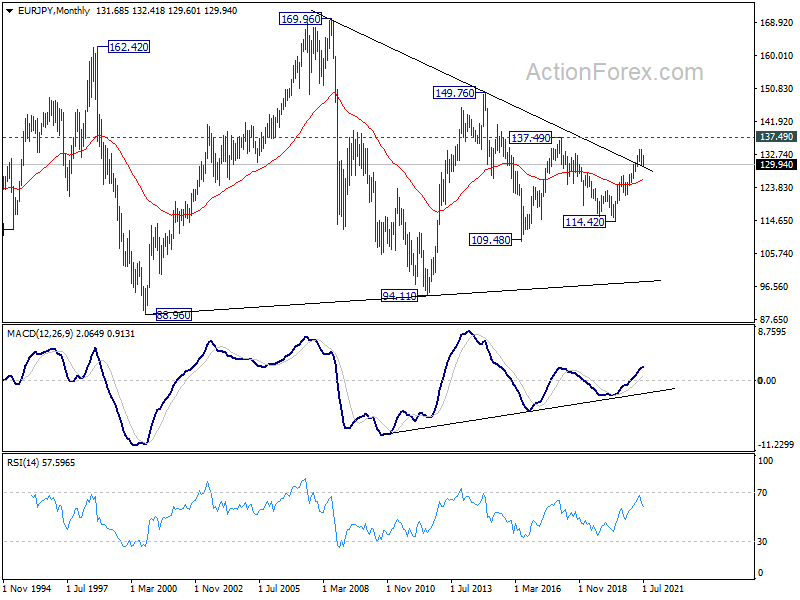
EUR/JPY was rejected by falling 4 hour 55 EMA last week and weakened again. Yet, downside was contained by 129.60 support. Initial bias remains neutral first. Corrective fall from 134.11 could extend lower. But we'd expect strong support from 38.2% retracement of 121.63 to 134.11 at 129.34 to bring rebound. On the upside, break of 131.07 resistance will indicate short term bottoming, and bring stronger rebound back to 132.68 resistance first. However, firm break of 129.34 will bring deeper fall back to 127.07 resistance turned support.
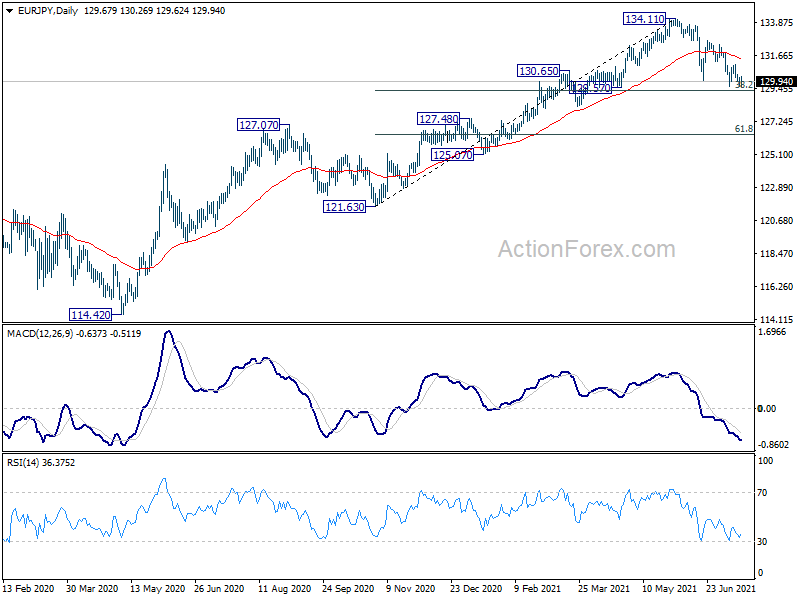
In the bigger picture, rise from 114.42 is seen as a medium term rising leg inside a long term sideway pattern. Next target is 137.49 (2018 high). Decisive break there will open up the possibility that it's indeed resuming the up trend from 94.11 (2012 low). For now, outlook will stay bullish as long as 127.07 resistance turned support holds, in case of pull back.
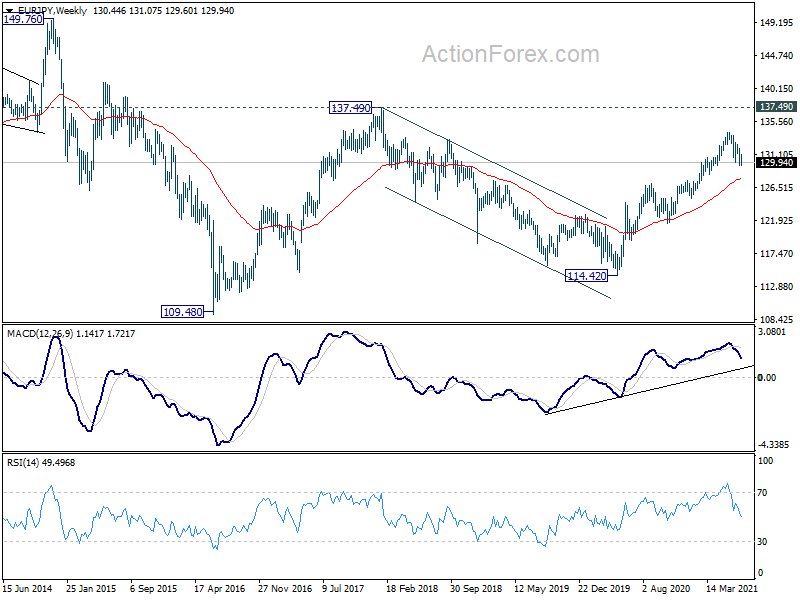
In the long term picture, EUR/JPY is staying in long term sideway pattern, established since 2000. Another rising leg in progress for 137.49 resistance and above.
EUR/GBP Weekly Outlook
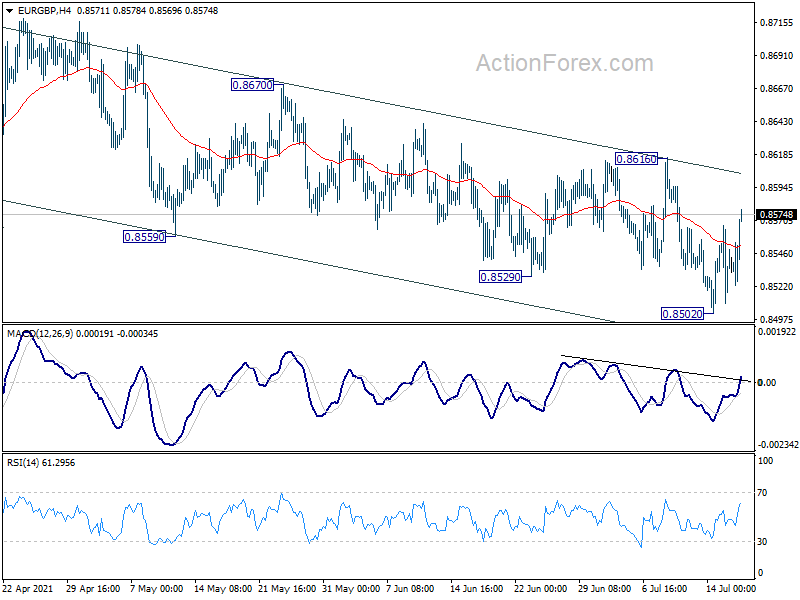
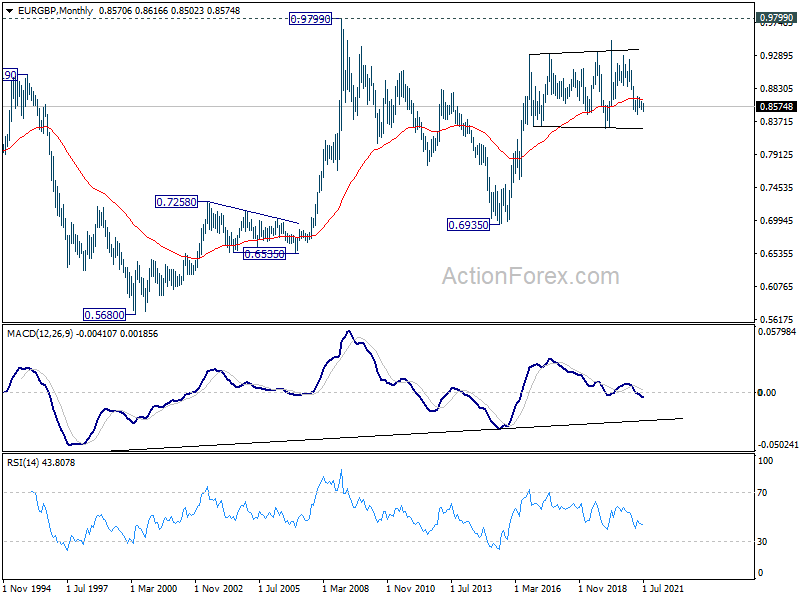
EUR/GBP edged lower to 0.8502 last week but rebounded again. Initial bias remains neutral this week first. on the downside, break of 0.8502 will resume the choppy fall from 0.8718 to retest 0.8470 low. On the upside, though, break of 0.8616 resistance will indicate completion of the correction from 0.8718, and turn bias back to the upside.
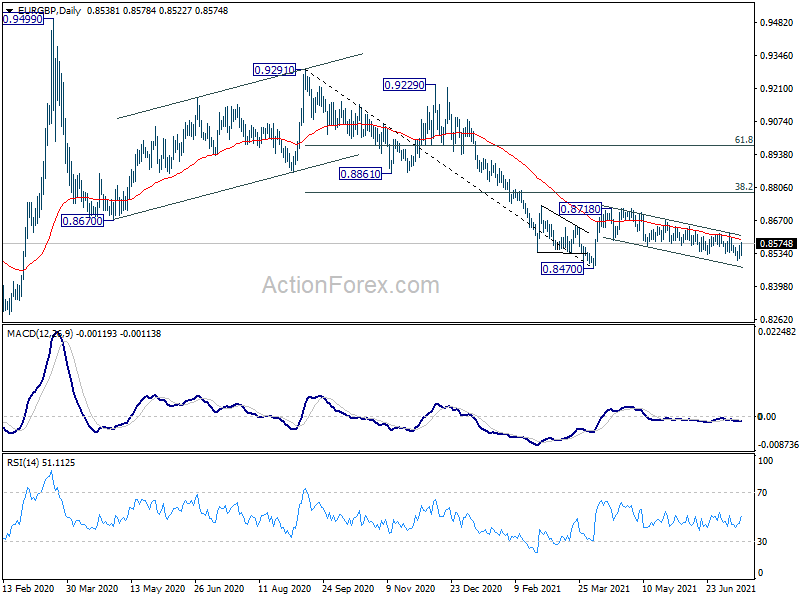
In the bigger picture, price actions from 0.9499 are still seen as developing into a corrective pattern. That is, up trend from 0.6935 (2015 low) would resume at a later stage. This will remain the favored case as long as 0.8276 support holds. However, firm break of 0.8276 support will suggest that rise from 0.6935 has completed and turn medium term outlook bearish.
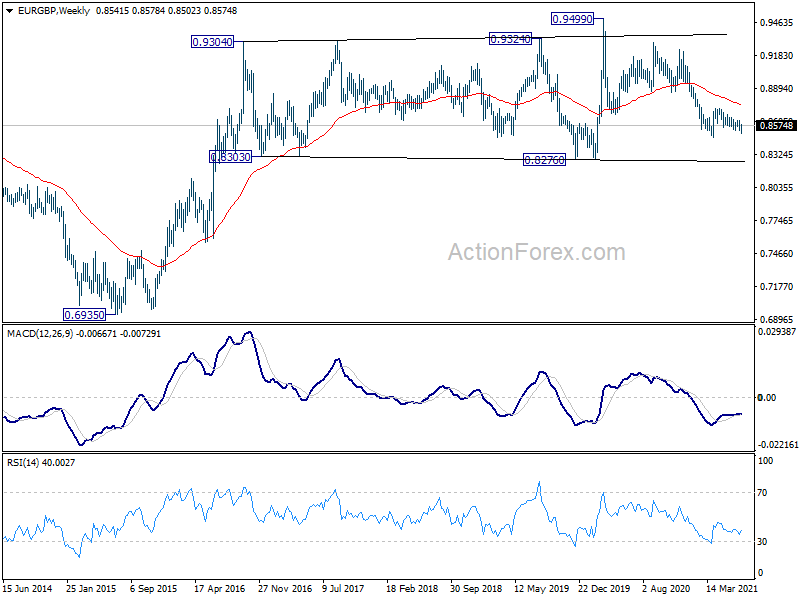
In the long term picture, rise from 0.6935 (2015 low) is still in progress. It could be resuming long term up trend from 0.5680 (2000 low). Break of 0.9799 (2008 high) is expected down the road, as long as 0.8276 support holds.
EUR/AUD Weekly Outlook
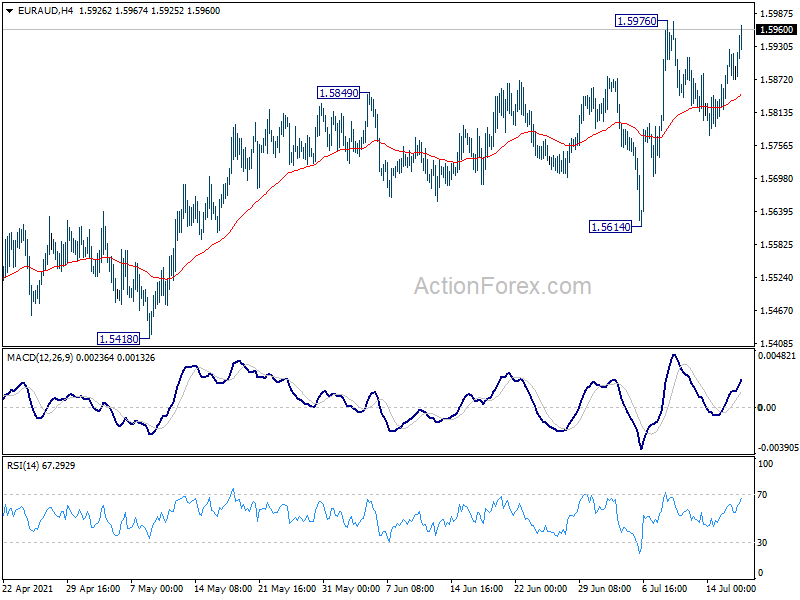
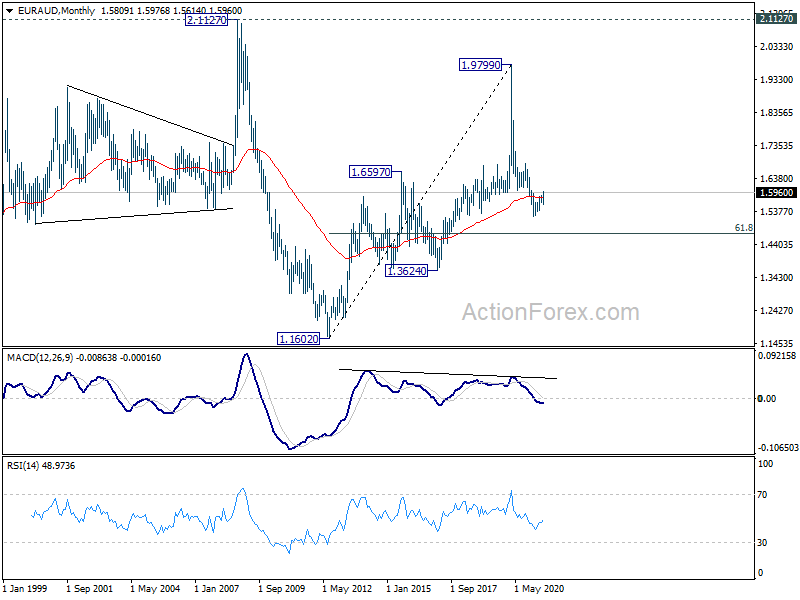
EUR/AUD stayed in consolidation below 1.5976 last week and outlook is unchanged. Initial bias stays neutral this week first but further rise is expected with 1.5614 support intact. On the upside, break of 1.5976 will resume the rise from 1.5250 to 1.6033 key support turned resistance next. Sustained break there will argue that longer term trend has reversed, and target 1.6827 resistance.
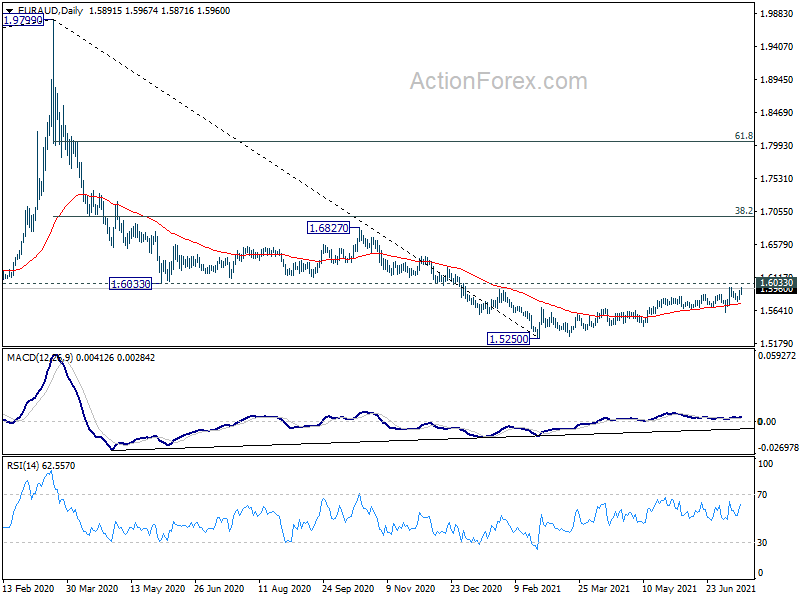
In the bigger picture, outlook stays bearish with 1.6033 support turned resistance intact for now. Fall from 1.9799, as a correction to to long term up trend from 1.1602 (2012 low) is still in favor to resume through 1.5250 later. However, firm break of 1.6033 will argue that such decline has completed. Stronger rebound would then be seen 38.2% retracement of 1.9799 to 1.5250 at 1.6988.
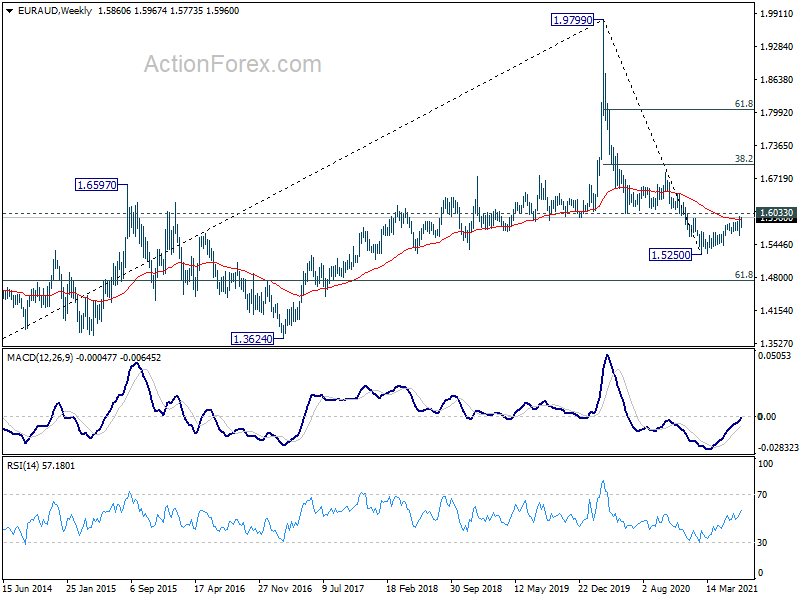
In the longer term picture, rise from 1.1602 (2012 low) should have already completed with three waves up to 1.9799 (2020 high). Fall from there is seen as a medium term to long term down leg as a long term down trend, or a sideway pattern. We'll assess the odds again at a later stage.
EUR/CHF Weekly Outlook
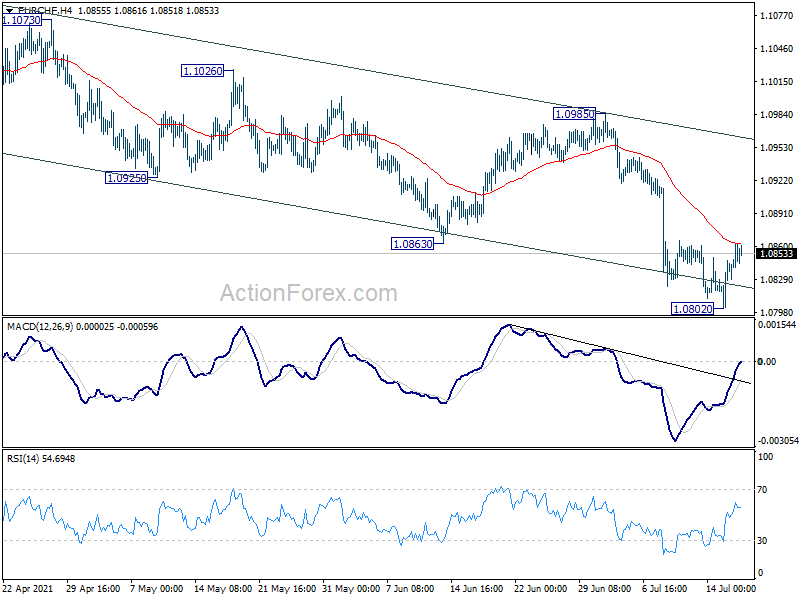
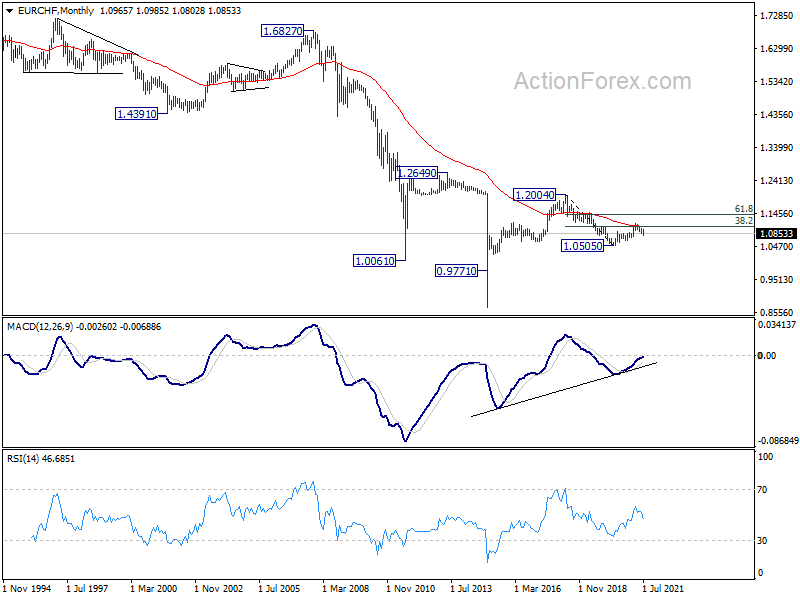
EUR/CHF edged lower to 1.0802 last week but recovered since then. Initial bias remains neutral this week for some consolidations first. Outlook will stay bearish as long as 1.0985 resistance holds. Break of 1.0802 will resume the decline from 1.1149, to 1.0737 cluster support next.
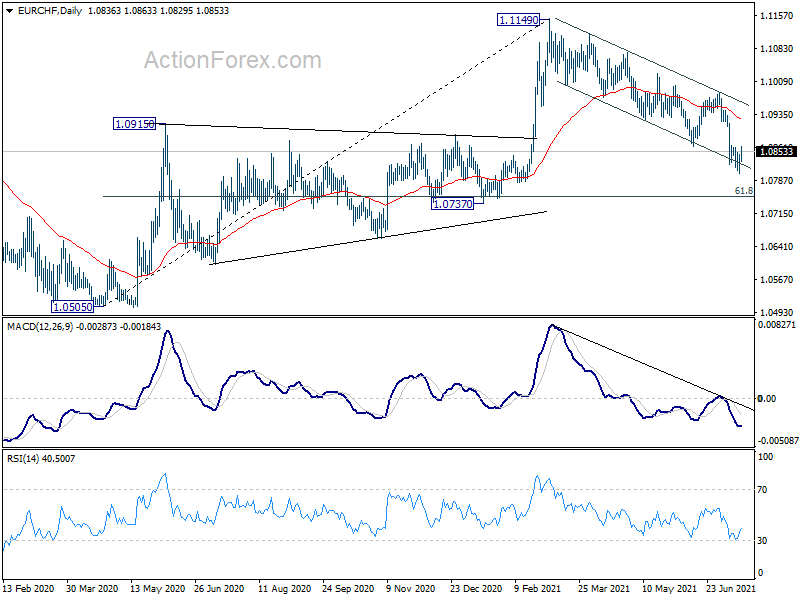
In the bigger picture, current development argues that rebound from 1.0505 (2020 low) might be completed with three waves up to 1.1149 already. Sustained trading below 55 week EMA (now at 1.0882) will affirm this bearish case. Further break of 1.0737 cluster support (61.8% retracement of 1.0505 to 1.1149 at 1.0751) will bring retest of 1.0505 low.
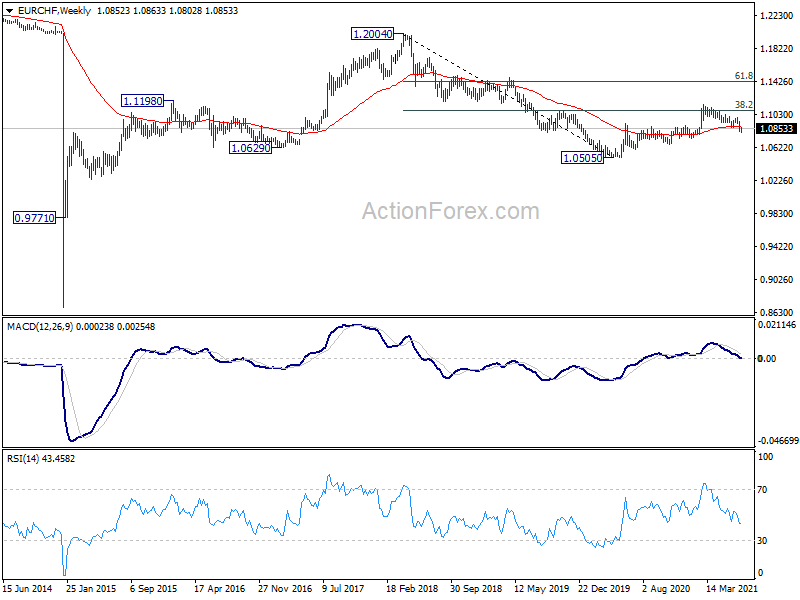
In the long term picture, price actions from 1.0505 are currently seen as a correction to down trend from 1.2004 (2018 high). only. The failure to sustain above 38.2% retracement of 1.2004 to 1.0505 at 1.1078 retains long term bearishness. This is also affirmed by rejection by 55 month EMA. Another fall through 1.0505 is mildly in favor for now.
NZD Surged But Couldn’t Overcome Resilient Dollar and Yen
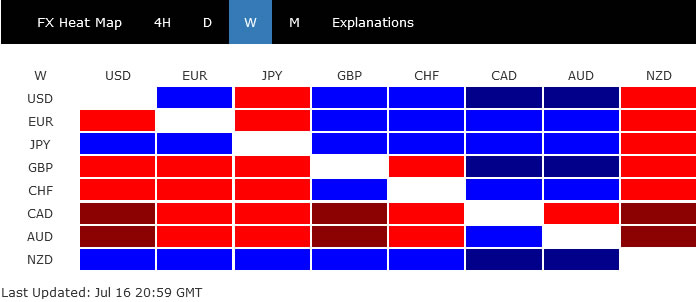
New Zealand Dollar ended as the strongest one last week, boosted by hawkish expectation on RBNZ. Though, the Kiwi's strength didn't provide much support to other commodity currencies, as Aussie and Loonie were indeed the worst performing ones. Yen and Dollar followed Kiwi as the next strongest, while European majors were mixed, with Sterling at a lower hand.
We'd like to argue that firstly, Kiwi's overall strength was not confirmed yet, as both NZD/USD and NZD/JPY were just range bound. Resilience in Dollar and Yen were helped by indecisiveness in risk sentiments. In particular, Dollar's momentum was actually not too convincing. Yet, developments in stocks and yield could to give Dollar another rising leg before it heads south again.
Kiwi surged on RBNZ, but broad based strength not secured yet
New Zealand Dollar's strong rally was fueled firstly by RBNZ's surprised halt of its asset purchase program, starting July 23. Then, much stronger than expected Q2 CPI reading, which blown away RBNZ's own forecasts, triggered talks the central bank could raise interest rates as soon as in August, as many as three times this year.
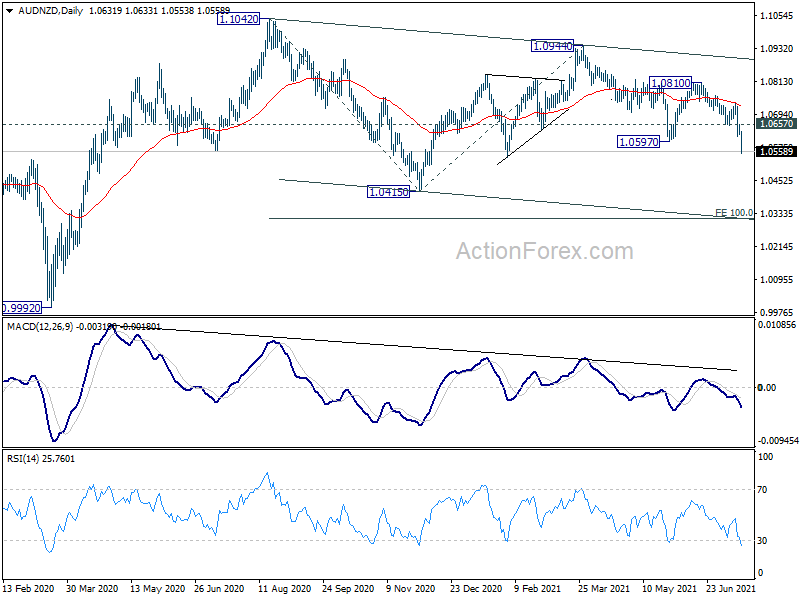
Kiwi's strength was most apparent against Aussie, as RBA maintained that conditions for rate hike won't be met as least until 2024. AUD/NZD took out 1.0597 support to resume the fall from 1.0944, hitting as low as 1.0553. Current downside acceleration argues that it might be resuming the fall from 1.1042. Deeper decline is expected as long as 1.0657 resistance holds. AUD/NZD could drop through 1.0415 support to 100% projection of 1.1042 to 1.0415 from 1.0944 at 1.0317.
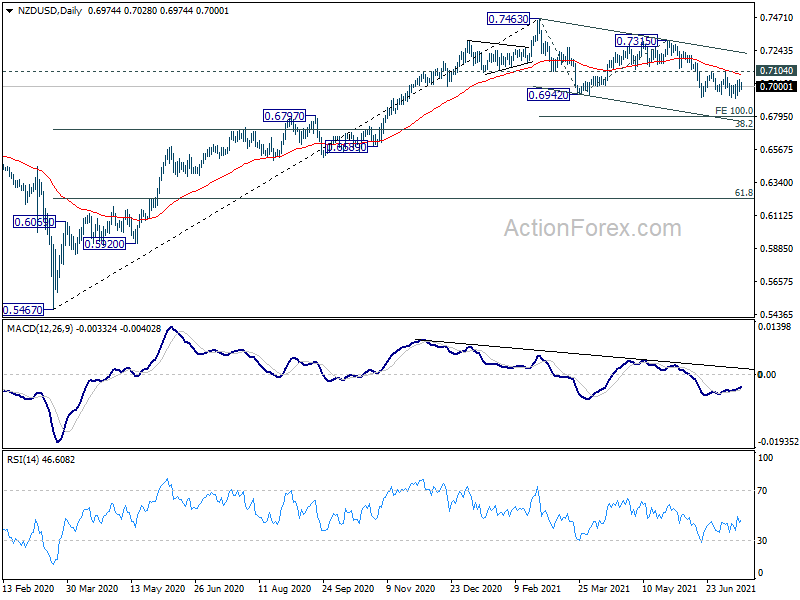
However, against Dollar and Yen, Kiwi was indeed not that strong. NZD/USD was still bounded in established range, held below falling 55 day EMA. It's likely still in the decline from 0.7463, which could extend to 100% projection of 0.7463 to 0.6942 from 0.7315 at 0.6794 before completion.
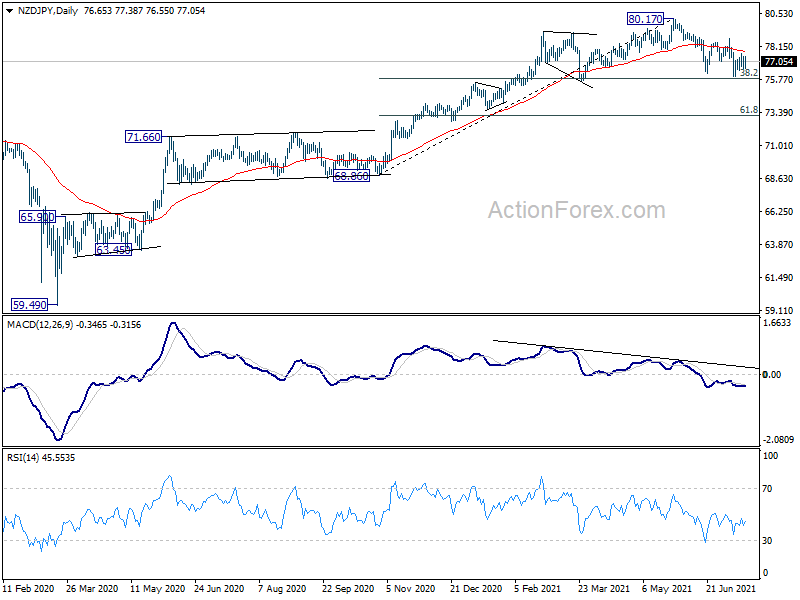
Similarly, NZD/JPY was also held in range, kept below 55 day EMA. We're expecting strong support from 38.2% retracement of 68.86 to 80.17 at 75.84 to contain downside as finish the corrective pattern from 80.17. However, sustained break of 75.84 could bring even deeper correction to whole up trend from 59.49. Overall, New Zealand Dollar's broad based strength is not secured yet.
DOW struggled to break through key resistance
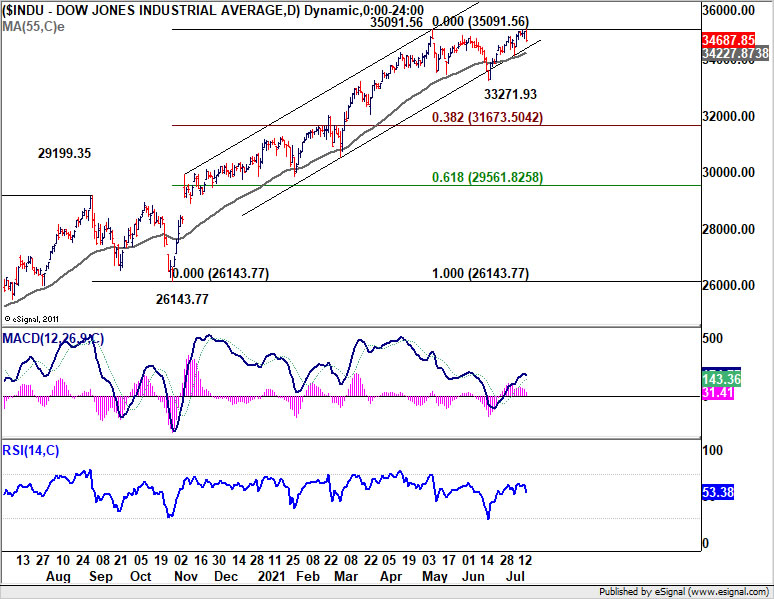
The resilience of Dollar and Yen was somewhat provided by DOW's failure to break through 35091.56 resistance decisively. There is still risk that consolidation from would extend with another falling leg, and break of 55 day EMA (now at 34227.87) would bring deeper fall from 33271.93 support and possibly below. Yet, as long as the 55 day EMA holds, further rise should be seen sooner rather than later, to catch up with record runs in S&P 500 and NASDAQ.
10-year yield back at 1.3 as rebound faltered
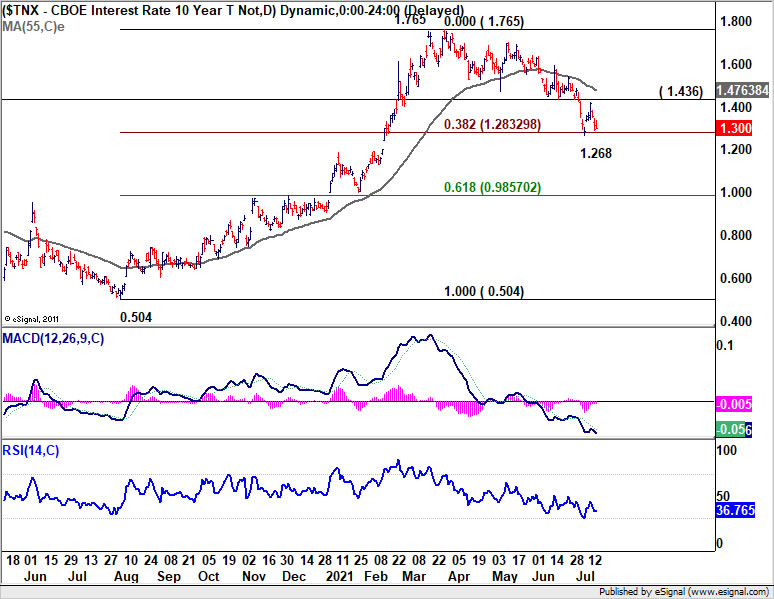
TNX closed the week in a rather weak way at 1.300 after brief rally. At this point, we're still seeing no strong reason for a powerful push through 1.268 support. However, the rejection by 1.436 support turn resistance, and the stay below 55 day EMA is kind of bearish. Firm break of 1.268 could extend the correction from 1.765 back towards 1.000 handle, which is close to 61.8% retracement of 0.504 to 1.765 at 0.985. Such development, if happens, could come in tandem with deeper fall in DOW mentioned above.
Dollar index continued to lose momentum
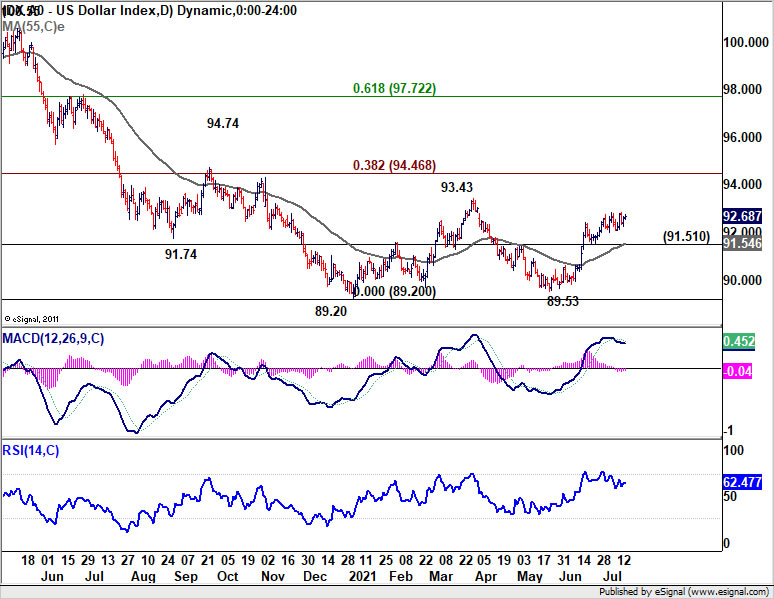
Dollar index continued to lose upside momentum last week, as seen in daily MACD. We'd stay cautious on topping around current level to complete the third leg of the corrective pattern from 89.20. Break of 91.51 support, as well as 55 day EMA (now at 91.54), will bring deeper fall back to retest 89.20 low. However, fall in yield and stocks together could push DXY for another rise to 93.43 resistance before completing the corrective pattern.
Gold extended rebound, but lacked follow through
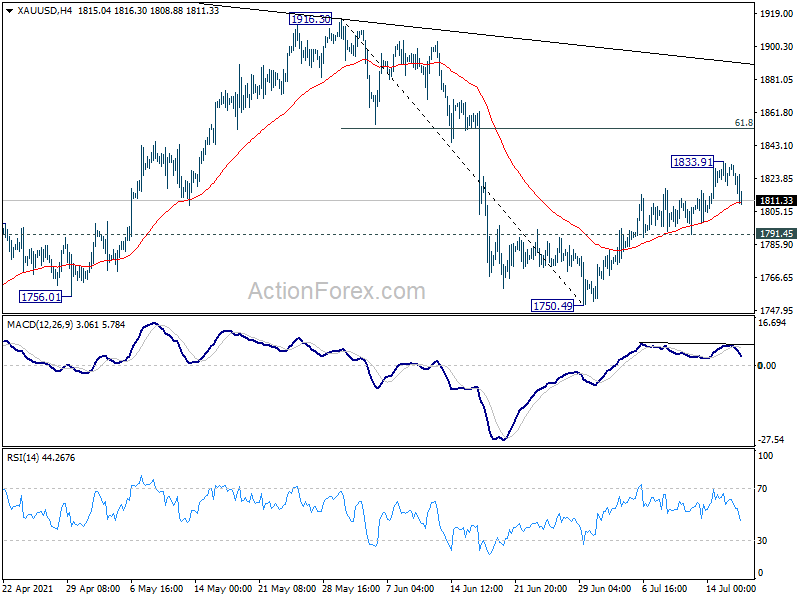
As usual, we'd monitor the developments in Gold to double confirm the outlook in Dollar. Rebound from 1750.49 extended to as high as 1833.91 last week but lost momentum since then. For now, further rise is still in favor as long as 1791.49 support holds. Rebound from 1750.49 would resume later to 61.8% retracement of 1916.30 to 1750.49 at 1852.96. However, firm break of 1791.45 support will argue that the rebound might be completed and turn bias to the downside for this support. That, if happens, could be an early indication of extending rebound in DXY mentioned above.
USD/CAD Weekly Outlook
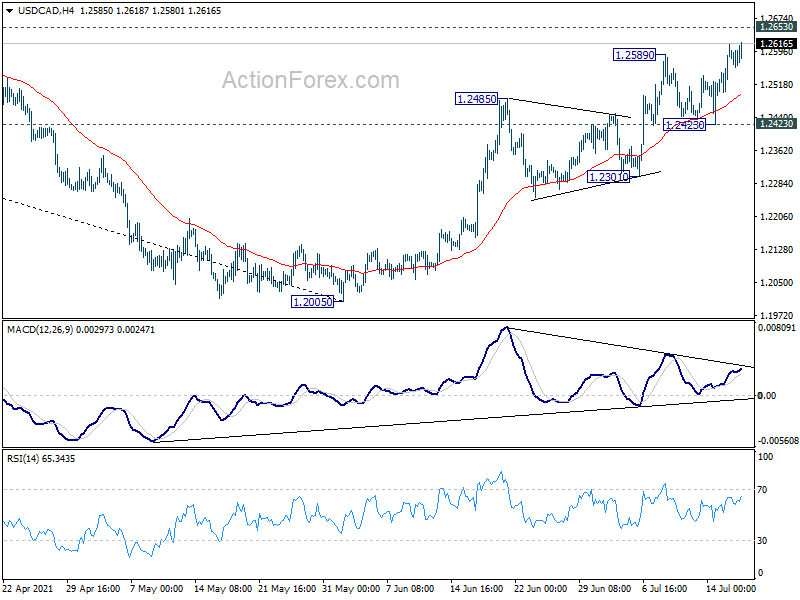
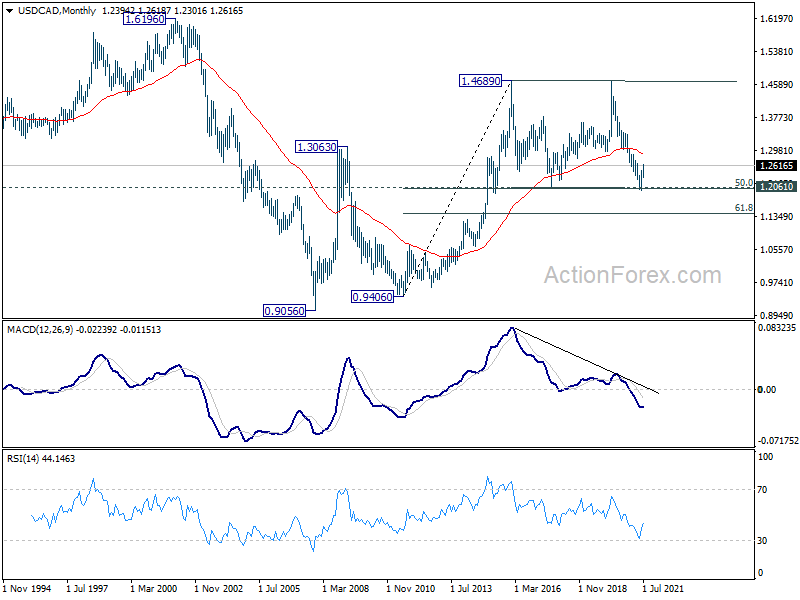
USD/CAD's rise from 1.2005 resumed last week and closed strongly at 1.2616. Initial bias stays on the upside this week for 1.2653 structure resistance. Sustained break there will confirm near term reversal. Stronger rise would then be seen to 1.3022 medium term fibonacci level next. On the downside, break of 1.2423 support is needed to indicate short term topping. Otherwise, outlook will remain bullish in case of retreat.
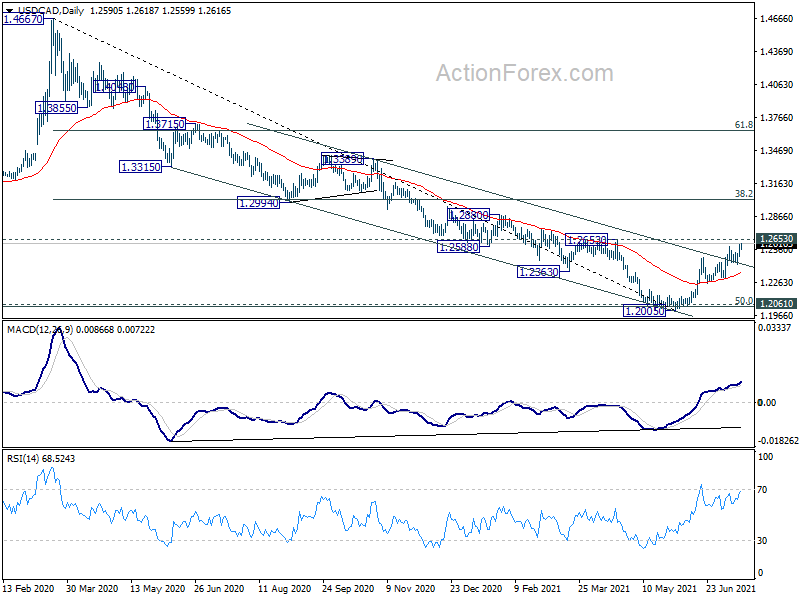
In the bigger picture, fall from 1.4667 is seen as the third leg of the corrective pattern from 1.4689 (2016 high). It might have completed after hitting 1.2061 (2017 low) and 50% retracement of 0.9406 to 1.4689 at 1.2048. Sustained break of 38.2% retracement of 1.4667 to 1.2005 at 1.3022 will pave the way to 61.8% retracement at 1.3650. Overall, medium term outlook remains neutral at worst with 1.2048/61 support zone intact.
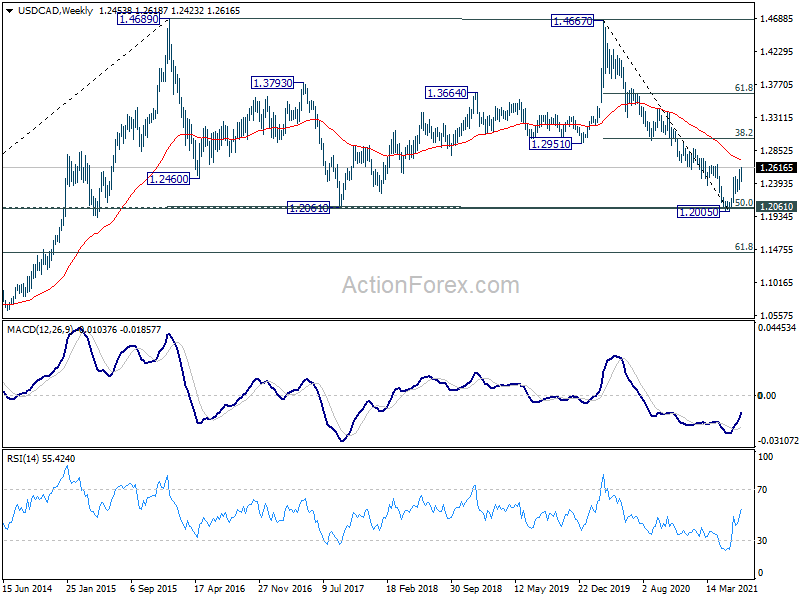
In the longer term picture, we're viewing price actions from 1.4689 as a consolidation pattern. Thus, up trend from 0.9506 (2007 low) is still expected to resume at a later stage. This will remain the favored case as long as 1.2061 support holds, which is close to 50% retracement of 0.9406 to 1.4689 at 1.2048. However, sustained break of 1.2061 will be a sign of long term bearishness. Deeper fall would be seen to 61.8% retracement at 1.1424 and below.
Summary 7/19 – 7/23
Monday, Jul 19, 2021
[php_everywhere instance="1"]
Tuesday, Jul 20, 2021
[php_everywhere instance="2"]
Wednesday, Jul 21, 2021
[php_everywhere instance="3"]
Thursday, Jul 22, 2021
[php_everywhere instance="4"]
Friday, Jul 23, 2021
[php_everywhere instance="5"]
Weekly Economic & Financial Commentary: “Transitory” Feels Increasingly Long
Summary
United States: "Transitory" Feels Increasingly Long
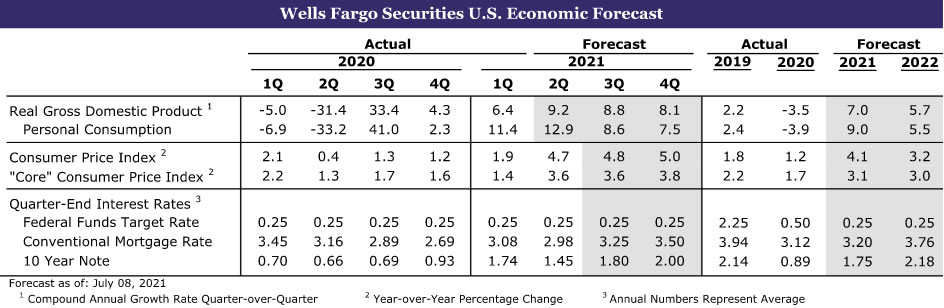
- Chair Powell reiterated his view that current inflation pressures would prove temporary in testimony to Congress, but there were few signs of inflation cooling this week. Both consumer and producer price inflation came in notably higher than expectations for June, while plans among small businesses to raise prices rose to a 41-year high.
- Retail sales rose 0.6% in June, which was stronger than expected and an indication that stronger spending on services as the economy reopens need not come at the expense of goods.
- Next week: Housing Starts (Tuesday), Existing Home Sales (Thursday), Leading Index (Thursday)
International: China Resilient; Monetary Policy Divergences Building
- China reported Q2-2021 GDP data and June activity indicators this week. Our takeaway is that China's economy, while slowing, is still resilient. In addition, the Reserve Bank of New Zealand announced an end to its asset purchase program, while the Bank of Canada slowed asset purchases and the Bank of England turned more hawkish, all while the Fed remained relatively dovish.
- Next week: European Central Bank (Thursday), South African Reserve Bank (Thursday), U.K. Retail Sales (Friday)
Interest Rate Watch: A Rise to Nine and Hold the Line
- The Fed's balance sheet recently crossed over $8 trillion; this week's Interest Rate Watch considers where it is going from here and what it means for financial markets.
Topic of the Week: Extreme Heat and Megadrought Threaten U.S. Agriculture
- The summer has brought severe heat, worsening drought conditions, wildfires and shrinking water supplies to the West, which is disproportionately affecting the region's agriculture industry.
U.S. Review
"Transitory" Feels Increasingly Long
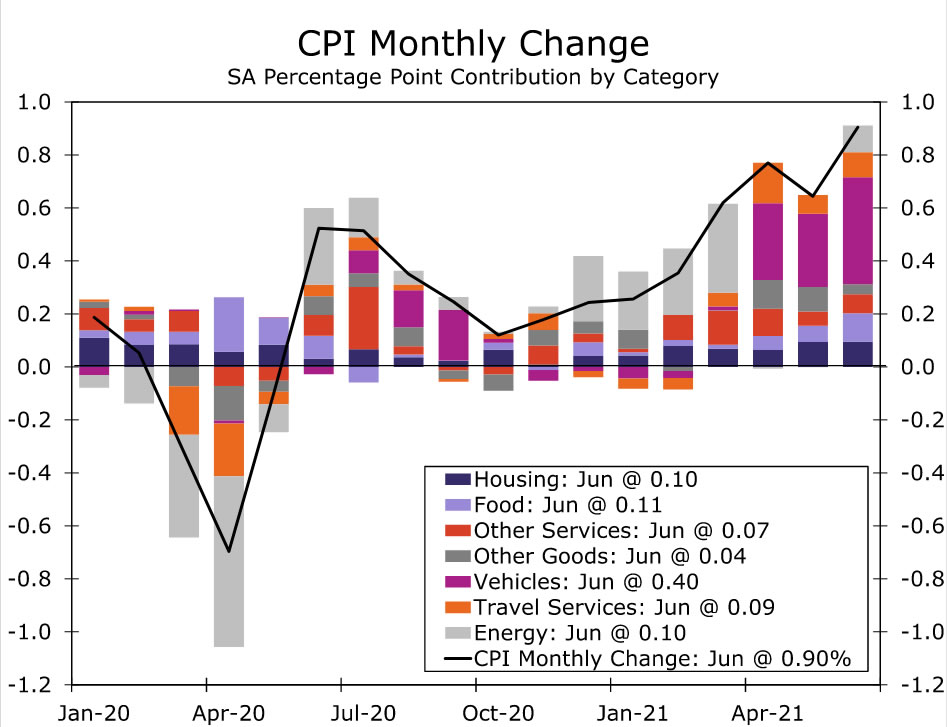
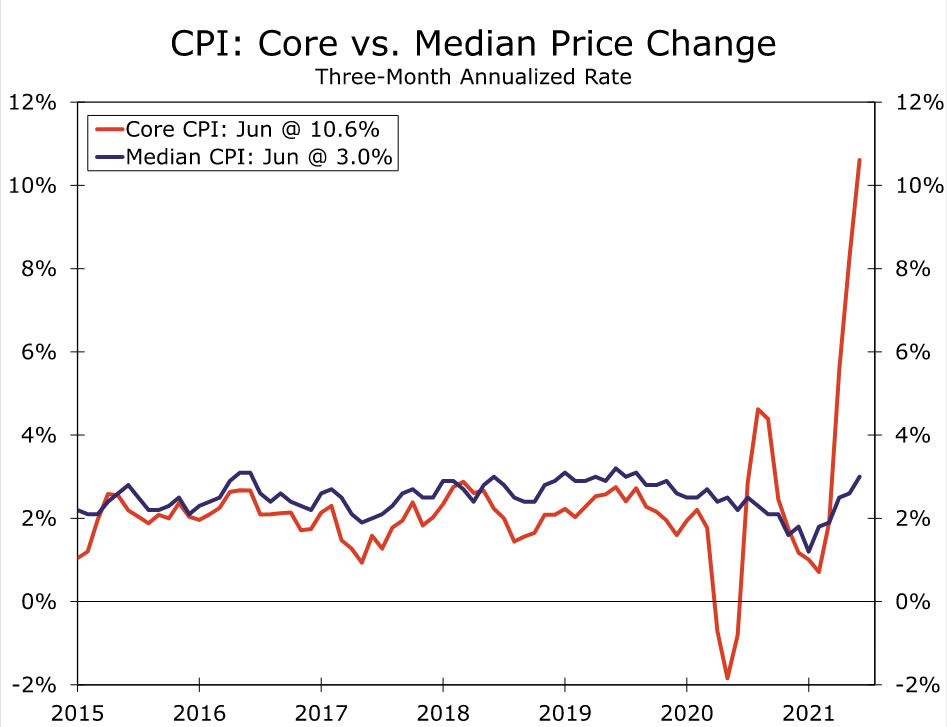
Inflation data this week came in as hot as July's scorching temperatures. Across a host of price gauges, inflation pressures have continued to build and businesses continue to pass on costs. The biggest head-turner was a 0.9% jump in CPI inflation, with an equally large jump in what is usually the less volatile "core" index. Again, huge gains in a few small categories at the center of the economy's reopening and supply chain issues drove the increase, including the rapid rebound in airfare and hotel prices and another monster gain in used car prices. June's increase pushed the core CPI up 4.5% over the past year, the largest yearly increase in roughly 30 years. Looking at the median CPI change shows inflation is not nearly as extreme as the traditional core suggests, but is nonetheless picking up and running at a pace above the Fed's 2% target. Notably, food and housing costs are picking up, spending that is more difficult to put off than travel or a car purchase.
The CPI was not alone in signaling inflation is far from quieting down. The share of small businesses planning to raise prices over the next three months rose to a 41-year high of 44%. Ongoing cost pressures as well as indications that businesses are taking advantage of booming demand to increase margins was evident in the producer price index (PPI). The PPI for final demand rose 1.0% in June and is now up 7.3% over the past year. Trade services, which measures margins rather than prices, jumped 2.1% in June and is up 5.8% from a year ago in a sign that rising costs need not come at the expense of greater profits.
The ongoing strength in inflation did not seem to faze Fed Chair Jay Powell's view that the run-up in inflation is only temporary. In his testimony to Congress this week, he continued to emphasize that price pressure should ease as current bottlenecks unwind.
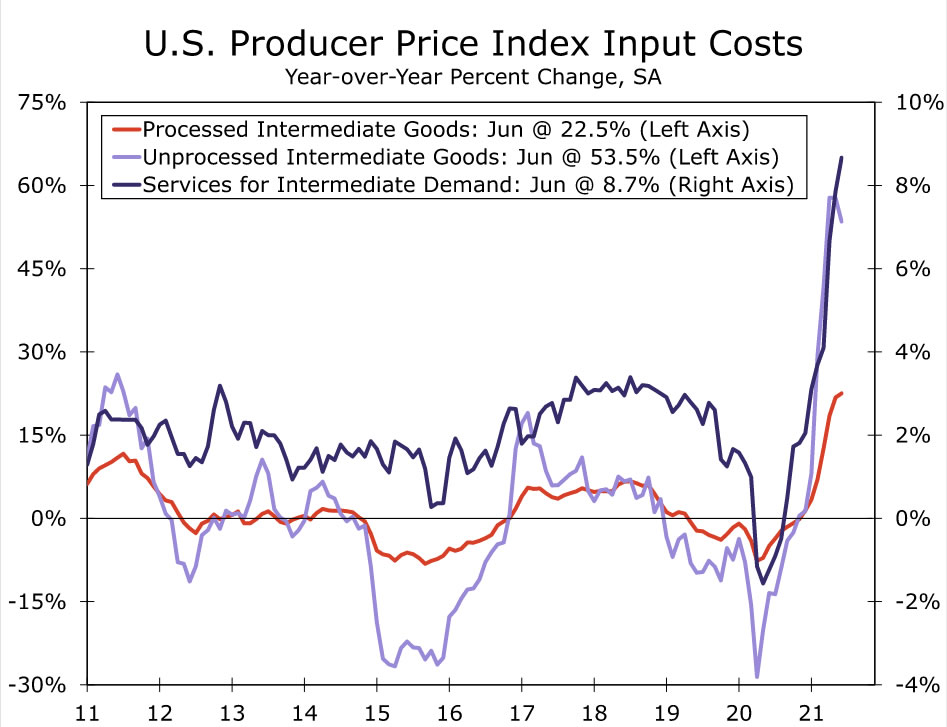
However, there are few signs of costs and supply constraints easing just yet. The PPI showed input costs continued to rise in June for raw and processed goods, as well as services, such as shipping. Industrial production in June fell short of expectations, largely due to a 6.6% drop in motor vehicle production as the industry continues to grapple with supply issues. In a glimmer of hope that the worst of the bottlenecks may be over, an average of the New York and Philadelphia Fed's manufacturing surveys' supplier delivery times indices showed wait times did not lengthen quite as quickly in July, while shipments growth quickened.
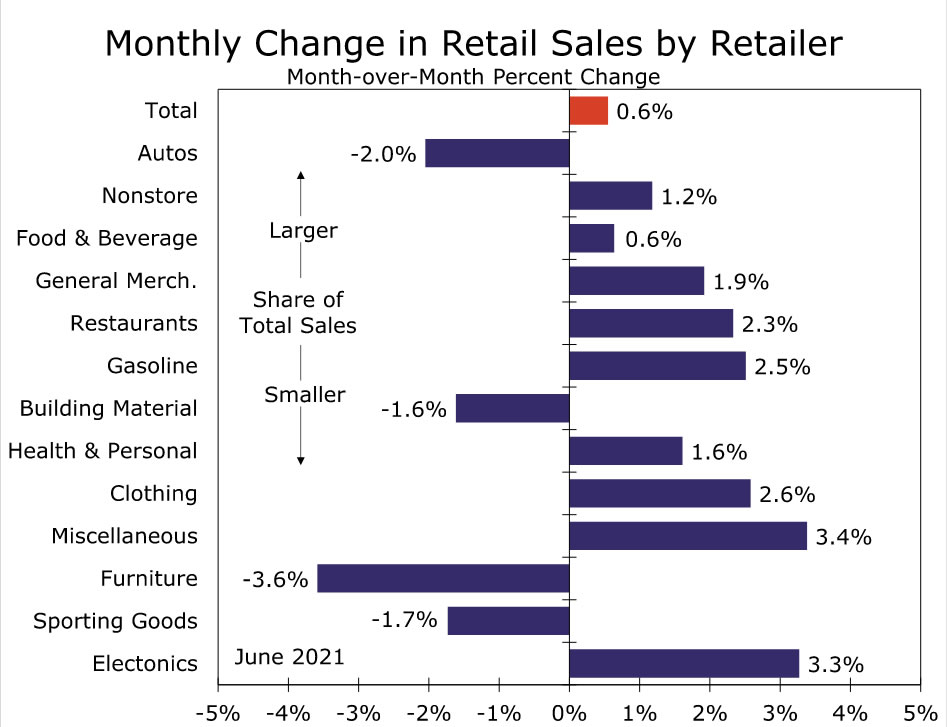
Retail sales for June showed consumers are not put off at this point by higher prices. Sales rose 0.6%, beating expectations for a modest decline. Consumers are pivoting away from home-related spending toward more social and experience spending. For example, furniture and building materials fell again last month, while restaurants, apparel, and personal care all jumped. Overall, the June retail sales report was indicative that with households emerging from the pandemic in a solid financial position, strengthening services spending need not come at the expense of goods.
U.S. Outlook
Housing Starts • Tuesday
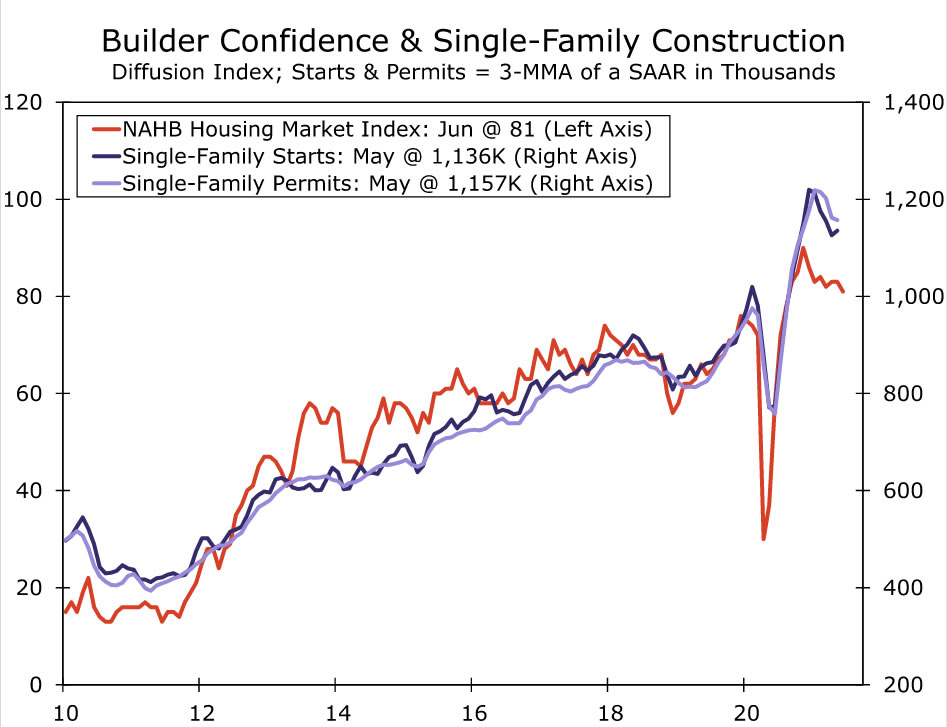
Housing starts rose to a 1.572 million-unit pace in May. Year-to-date starts are up around 25% relative to 2019, but since the year began, weather issues and rising material and labor costs have kept builders from meeting robust demand. The decline in lumber prices from May's record high should give builders a sigh of relief. Lumber is now nearly a third of its peak price, which should renew interest in construction projects, but other key inputs, like steel and copper, are still expensive and hard to source. In the Federal Reserve's July Beige Book, many districts cited high material and labor costs as hindering growth. These factors also weighed on home builder confidence, and the NAHB Housing Market Index fell in June.
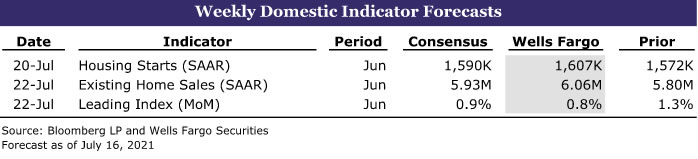
Single-family and multifamily starts grew solidly in May, rising 4.2% and 2.4%, respectively. But building permits, which lead starts by a couple of months, declined 3% in May, as both single-family (-1.6%) and multifamily permits (-5.8%) fell. Tight inventories should support new single-family construction in June, while a return to the office should bolster demand for multifamily starts as people move into the hard-hit central business districts. We expect housing starts rose slightly in June to a 1.607 million-unit pace as demand held steady and lumber constraints eased.
Existing Home Sales • Thursday
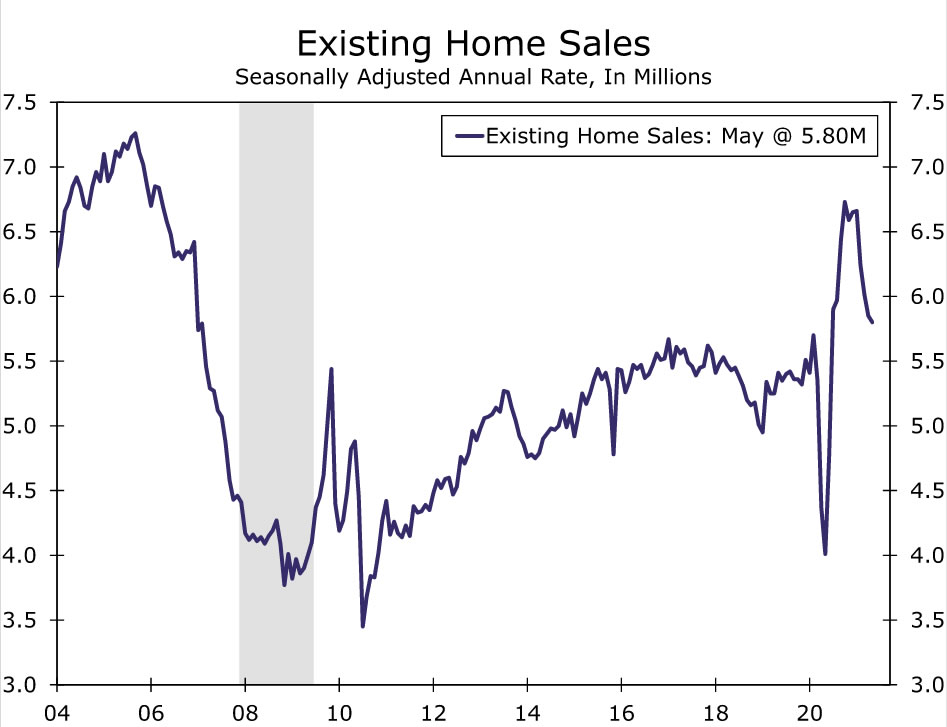
Existing home sales fell for the fourth consecutive month in May but are still running strong at a 5.8 million-unit annual rate. The recent cooling has been driven by a lack of affordability in the housing market, with the median price of an existing home sitting at $350K, a 23.6% increase from the prior year. While higher prices should help bring sellers to the market, the current imbalance of supply and demand has made homeownership unattainable for many first-time buyers, who tend to account for around a third of purchases. Even if a home buyer is able to fit the bill for a new place, search costs are also high as homes were only on the market for an average of 17 days before being sold in May. A Richmond Fed contact reported in the Beige Book that, “buyers are increasingly willing to buy homes in poorer or unknown condition,” further highlighting the impact of record-low inventories.
This morning's University of Michigan consumer sentiment release reported 67% of respondents considered it a bad time to buy a home—for comparison, this share maxed out at 30% in 2006 before the Great Recession. Plans to buy a home have also declined. A bright spot in the data is the slight turnaround of inventories. Months supply of homes has remained flat or slightly increased for five months since its record low last December. We forecast existing home sales ticked up in June to a 6.06 million-unit pace as demand for extra space and low mortgage rates supported sales.
Leading Index • Thursday
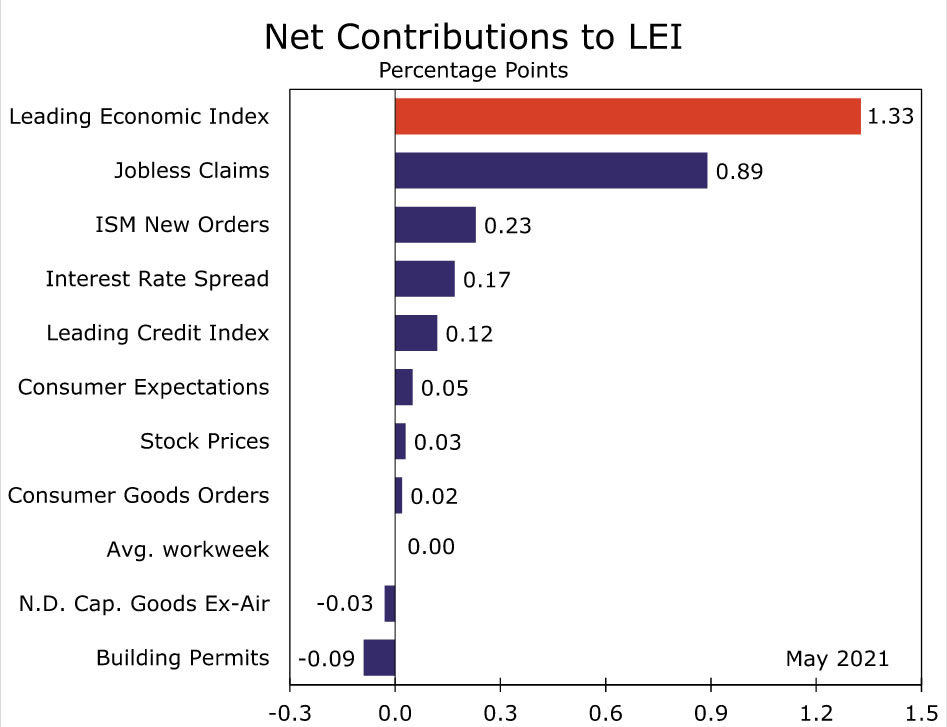
The Leading Economic Index (LEI) grew a strong 1.3% in May to a fresh record of 114.5. Recently, the sharp decline in jobless claims has accounted for the lion's share of the headline's growth. Lower jobless claims boosted LEI by 0.89 percentage points in May and 0.81 percentage points in April. As claims have continued to fall, June should also see a boost from this category, but the contribution was likely smaller because jobless claims' monthly decline was less pronounced. Consumer expectations have also lifted the headline as outlooks brighten and should continue that trend in June. Consumer confidence climbed higher in June, hitting its highest point since the pandemic began.
Supply shortages dragged on the index last month. Building permits declined, as high labor and material costs led builders to put off construction. While some constraints have eased, many of these headwinds stuck around in June. Overtime, however, we suspect home building will start to stabilize as input prices come down. The ISM new order index boosted the LEI by 0.23 percentage points in May, but new orders declined slightly, albeit less than expected, in June and are currently at 67. Given the mixed bag of economic data seen over the past month, we suspect LEI grew at a more modest but still strong pace of 0.8% in June.
International Review
China Data Reveals Resiliency
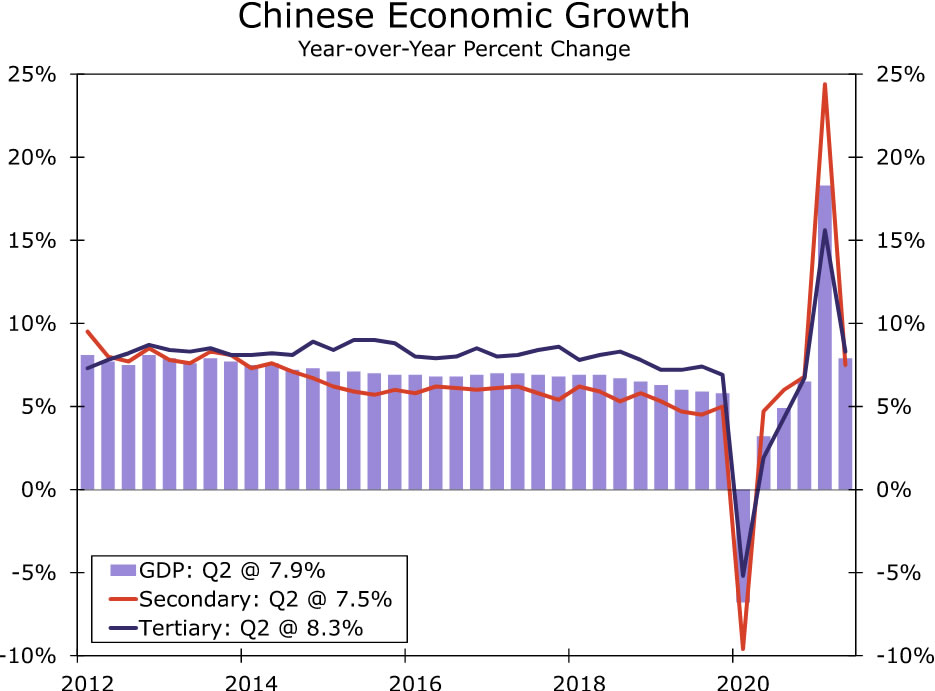
This week, we received a slew of Chinese data, including Q2-2021 GDP as well as June activity indicators. In our view, the key takeaway is, while the Chinese economy is slowing, the economy is also demonstrating some form of resiliency. To that point, on a year-over-year basis, China's economy grew 7.9%, in line with the consensus forecast of 8.0%, although a sharp deceleration from growth of over 18% in Q1. The fall in headline GDP is mostly due to base effects in Q1; however, in the lead-up to the GDP release, there was some concern among market participants that China's economy could be in worse shape than expected. Last week, the People's Bank of China (PBoC) cut its Reserve Requirement Ratio for most local banks, leading markets to believe the Chinese economy may be experiencing a significant slowdown and that the central bank could be starting a monetary easing cycle to offset slower growth. The fact that GDP data were in line with consensus estimates should give markets reprieve the Chinese economy is holding steady and the PBoC is not too worried about the health of the local economy.
As far as activity indicators, the takeaway is similar. Industrial production and retail sales data beat consensus forecasts, which should also demonstrate the Chinese economy's resilience. To this point, the Chinese labor market has not fully recovered and worries about the pace of consumption were starting to build. Retail sales rose 12.1% year over year against a consensus view of 10.8%, revealing a still resilient consumer. In addition, a strong consumer should take pressure off China's export sector in the second half of this year. In the coming weeks, we will incorporate Q2 GDP and June activity data into our China GDP forecasts. As of now, we forecast the economy to grow a little over 8% and will likely make modest adjustments to our expectations in our next forecast publication.
Reserve Bank of New Zealand Ends Asset Purchases
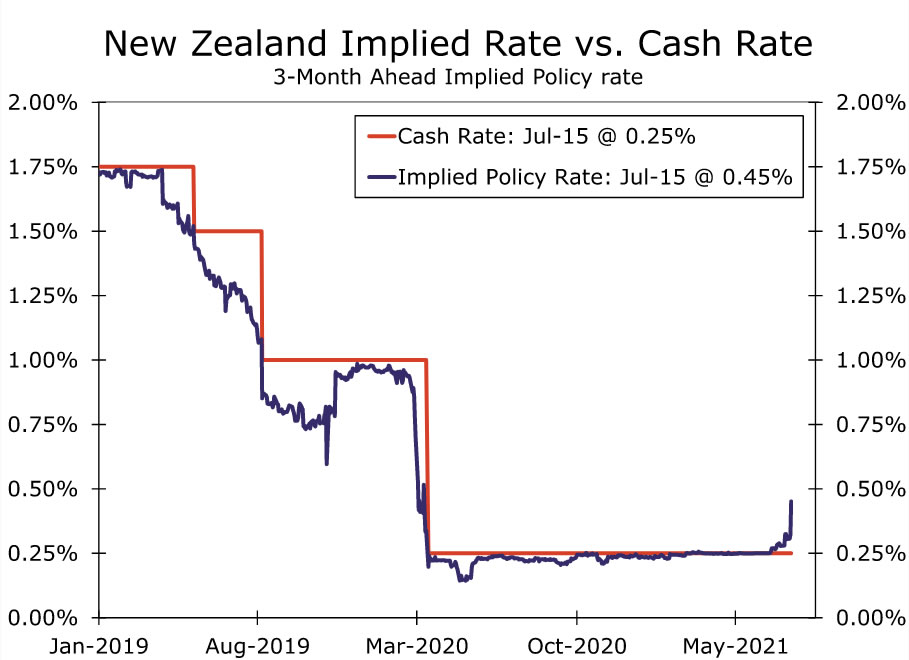
In a surprise announcement at its monetary policy meeting this week, the Reserve Bank of New Zealand (RBNZ) decided to end its asset purchase program. Governor Orr announced this week that the RBNZ would end asset purchases in July amid a strong economic recovery and in an effort to defend against a potentially overheating economy. The New Zealand economy has been outperforming for a while as inflation has moved higher and confidence numbers rise. However, the hawkish shift in monetary policy still came as a surprise and financial markets responded quickly. To that point, the New Zealand dollar rallied in the immediate aftermath of the announcement, while markets are also now priced for interest rate hikes much earlier than previously expected, pricing around 20 bps of monetary tightening over the next three months.
As a result of the RBNZ's more hawkish turn on monetary policy, we are adjusting our forecast for New Zealand policy rates. Prior to this week's meeting, we forecast the RBNZ's tightening cycle to begin in mid-2022; however, we now expect interest rates to move higher at the RBNZ's August meeting. For now, we expect a 25-bp increase come August, which would take the Official Cash Rate to 0.50%. Future rate hikes will depend on the progress of the economy; however, with inflation running hot at 3.3% year over year and home prices elevated, multiple rate hikes before the end of the year would not be surprising.
Aside from the RBNZ, other foreign central banks exhibited a hawkish stance on monetary policy this week as well. To that point, an above-consensus inflation print in the U.K. led Bank of England policymakers to suggest tighter monetary policy could be imminent. In addition, the Bank of Canada tapered asset purchases again as growth and inflation dynamics improved. Within the G10, foreign central banks continue to turn more hawkish, while the Federal Reserve maintains its patient and relatively dovish position on U.S. monetary policy. These divergences in monetary policy could result in interesting moves in financial markets going forward.
With the Fed keeping policy settings on hold and foreign central banks beginning tightening cycles, it is entirely possible the U.S. dollar comes under some pressure. Rate hikes in New Zealand and Norway, along with reduced asset purchases in the U.K. and Canada, could attract capital flows toward these respective currencies and away from the greenback. Going forward, we will continue to track central bank policymaker rhetoric and how policy expectations are evolving to get a sense for the path of the U.S. dollar.
International Outlook
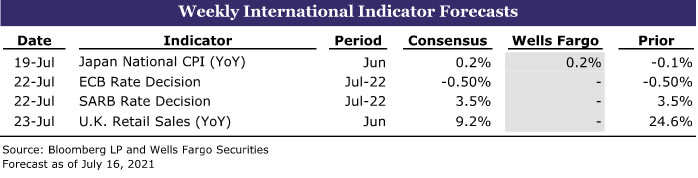
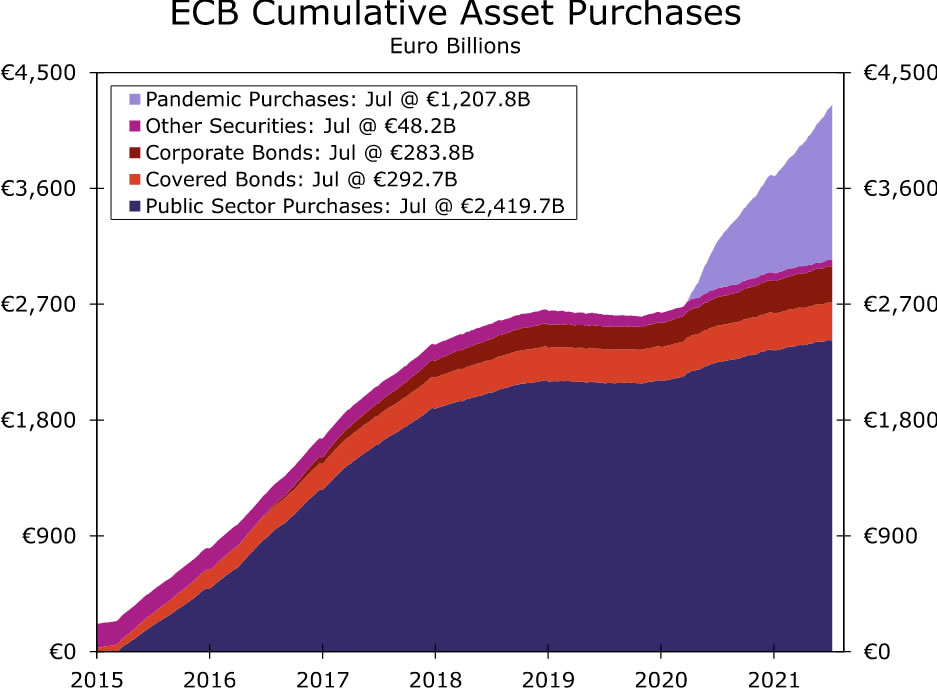
European Central Bank • Thursday
ECB President Christine Lagarde recently suggested the potential for policy change at its monetary policy meeting next week. In our view, a "policy change" does not necessarily mean interest rate adjustments; in fact, the more likely adjustment would come to the ECB's asset purchase program. It's possible ECB policymakers look to extend the duration of asset purchases, or possibly the asset purchase envelope itself, in an effort to keep monetary policy accommodative for longer than ECB policymakers originally intended.
Adjustments to asset purchases would be consistent with the ECB's recent strategy review. The results of the strategy review also appear to be intended to keep policy accommodative for longer as the ECB will now target inflation of 2%, rather than inflation "below, but close, to 2%." Over the past few months, the Eurozone economy has shown improvement, particularly as vaccinations have stepped up. With monetary policy likely to stay easy for the foreseeable future, mobility and consumer spending rising and fiscal stimulus to be disbursed around the end of the summer, the Eurozone economy is showing signs of life.
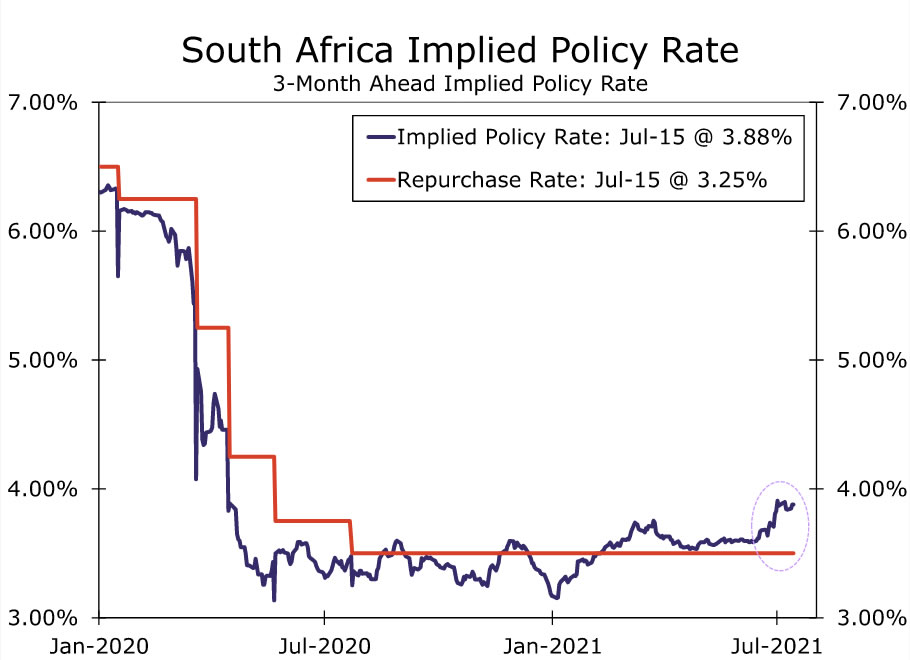
South African Reserve Bank • Thursday
Against a backdrop where interest rates across emerging markets have moved higher, the South African Reserve Bank (SARB) will meet to assess monetary policy next week. The context for the SARB's next meeting is also complicated as nationwide protests have broken out in response to COVID-related frustrations and new restrictions as well as the imprisonment of former president Jacob Zuma. Another wave of COVID infections and restrictions will likely weigh on activity across the country and delay the local recovery even further, while demonstrations are likely to have an economic impact as well. A sluggish local economy and tighter monetary policy from peer central banks put the SARB in a tough position, especially as inflation moves higher toward the upper end of the inflation target.
In our view, the central bank is likely to keep policy rates on hold next week and will likely keep rates steady through the end of the year. Policymakers have noted that inflation is likely transitory and should recede, while economic disruptions should result in accommodative policy for longer than policymakers initially expected. Our view on rates is out of consensus and against market pricing, as market currently are priced for at least two 25-bp rate hikes over the next three months.
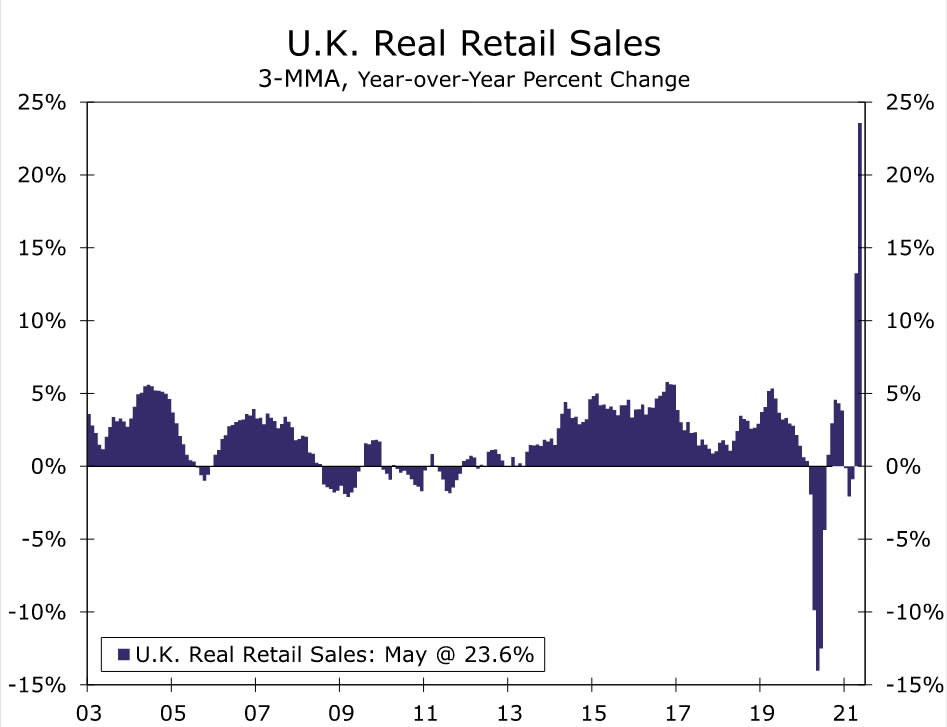
U.K. Retail Sales • Friday
According to British authorities, the U.K. economy is set to reopen, allowing nightclubs and other service venues to become fully operational for the first time in more than a year. Our most recent analysis shows that household savings rates and disposable incomes are elevated, which should support consumption activity and pent-up demand when the U.K. fully reopens. In our view, U.K. consumers are likely to support the economy going forward; however, U.K. virus cases are ticking higher amid the spread of the Delta COVID variant. As confirmed cases push higher, U.K. consumers may be hesitant to resume normal spending patterns and venture back into nightlife and other service-based industries.
Next week's retail sales data should give some insight into whether consumers are deploying the excess savings they have built up over the course of the pandemic. While we will not have retail sales data reflecting a fully open U.K. economy for a few more months, nevertheless, June data should act as a good precursor for what to expect later in the summer.
Interest Rate Watch
A Rise to Nine then Hold the Line
To augment its near-zero rates policy, the Federal Reserve is currently buying $80 billion worth of Treasury securities and $40 billion worth of MBS every month. This means the already historically large balance sheet of the Federal Reserve is growing by $120 billion every month or more than $1.4 trillion this year alone.
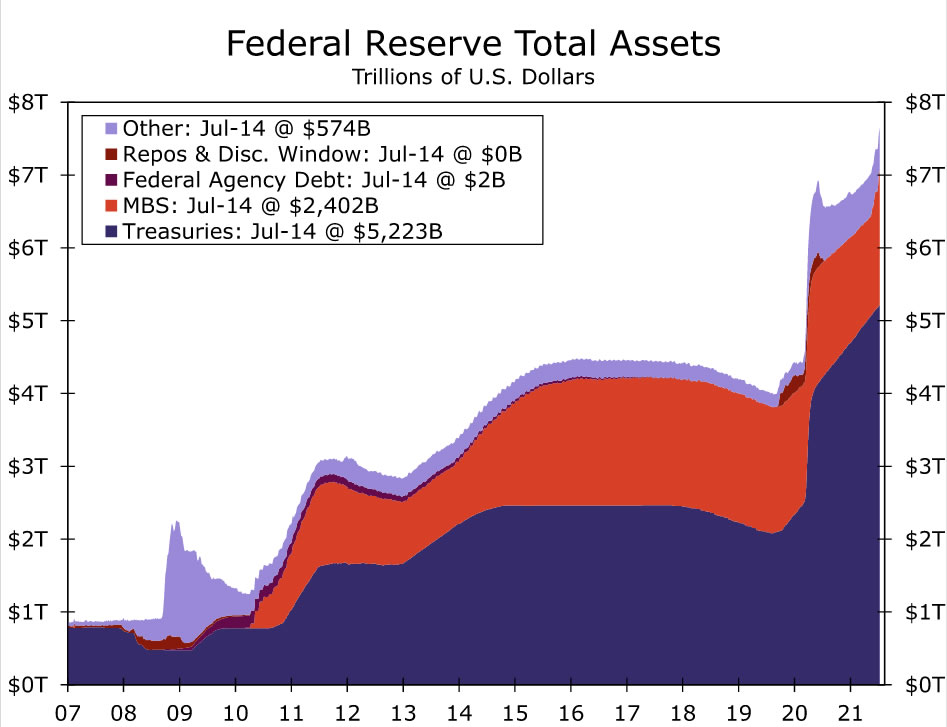
The Fed has been slow-walking the messaging around tapering its asset purchase program for months, and while the mantra has been that it will continue its current rate of asset purchases “until substantial further progress has been made toward the Committee's maximum employment and price stability goals,” details from the latest minutes suggest the moment is drawing nearer, a view that only gains momentum in the wake of this week’s hotter-than-expected CPI inflation report. That said, testimony from the Fed Chair Powell was clearly aimed at dispelling any notion that tapering was imminent.
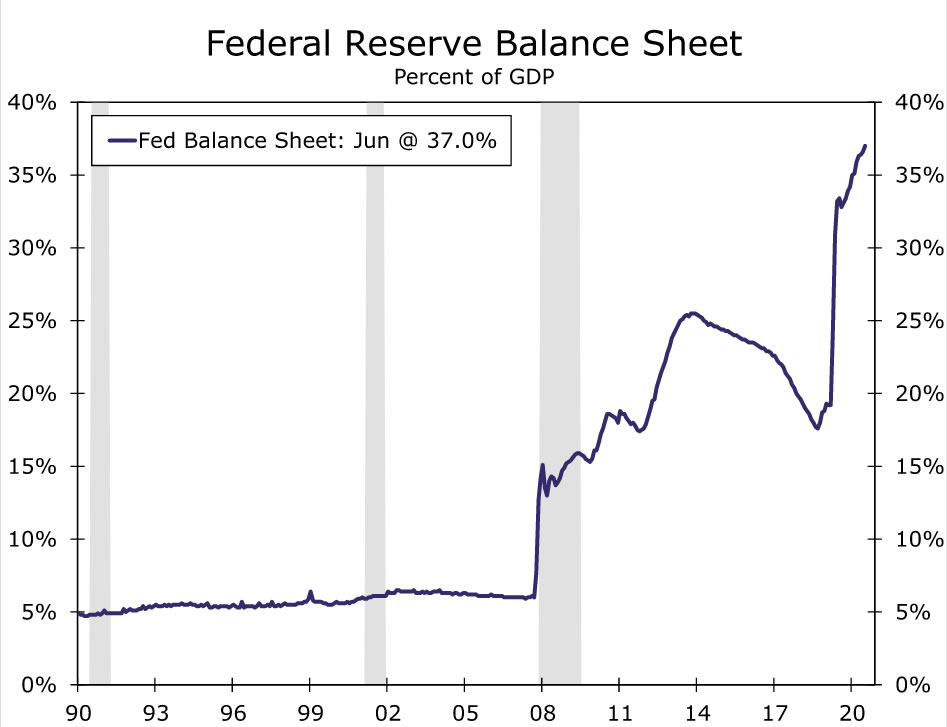
The longer the asset purchases continue, the bigger the Fed’s balance sheet gets. It recently crossed the $8 trillion mark and is likely to continue to rise for some time. Estimates from the New York Fed put the value of the balance sheet at $9 trillion by the end of 2022, which is an order of magnitude larger than it was in 2008 when the entire balance sheet was only about $900 billion. Rather than comparing these enormous dollar figures, it may be more helpful here to think of the balance sheet as a share of GDP. In the prior cycle, the balance sheet swelled from about 6% of GDP in 2008 to just over 25% at its height before tapering finally got under way in 2014. In the current cycle, the balance sheet has gone from a pre-pandemic low of 17.6% to 37% at present. In other words, even before the pandemic-related purchases began, the Fed still held most of the assets it purchased in the aftermath of the 2008 financial crisis.
The Fed’s Treasury holdings are large relative to the size of the economy and significant compared to the Treasury market itself. Through the first quarter of this year, the Fed owned $5.4 trillion in Treasury debt or about 24% of the $22.3 trillion in total debt outstanding. That may sound like a lot, but it is not uncommon for the Fed to own a significant share of Treasuries, and the bulk of Treasuries remain privately owned and traded.
The combination of significant monetary and policy stimulus has left the financial system awash in cash in search of a place to go. With rates uncomfortably close the zero lower bound, at its June meeting the Fed made some technical tweaks: It raised the interest it pays on excess reserves (IOER) to 0.15% from 0.10% and the rate on overnight reverse repurchase agreements to 0.05% from 0.00%. In the wake of that decision, the amount of money pouring into the reverse repurchase agreement facility rose to a record $992 billion at month-end in June and still sits at roughly $776 billion as of this writing.
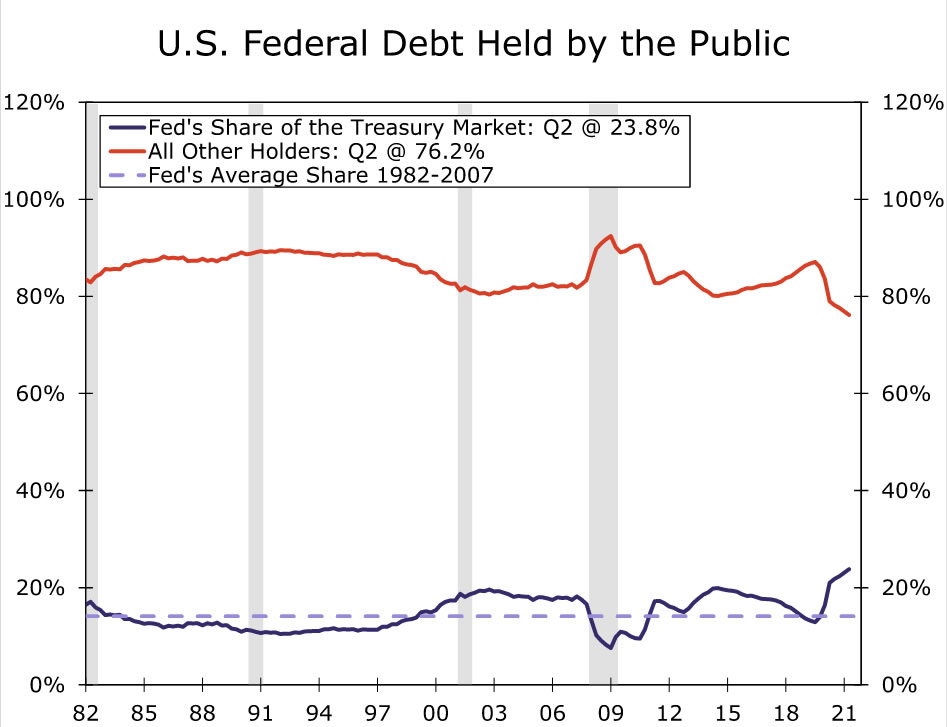
The ultra-accomodative stance taken by the Federal Reserve has resulted in a number of records: The Fed's balance sheet is as large as it has ever been. This is true in dollars, as a share of GDP and as a share of total debt outstanding. Meanwhile, banks and other institutions have never had more cash tucked away in overnight repos. Like an undriven sports car that sits in the garage, the financial system is awash in excess cash, all while the balance sheet continues to grow to new record highs.
Whether it is this year or next, the eventual Fed tapering will likely result in the balance sheet leveling off around $9 trillion where it will probably stay for a while. We were a couple of years into the previous tightening cycle before the Fed began letting its balance sheet shrink, and until we get alternative guidance, that is a reasonable base case for this time as well. If the first rate hike occurs sometime in 2023, the Fed’s balance sheet is unlikely to shrink in dollar terms until at least 2024. This may be a factor in the growing realization among firms that this excess cash situation will probably be a reality for at least a few more years.
Topic of the Week
Extreme Heat and Megadrought Threaten U.S. Agriculture
The economy is heating up this summer, and so are temperatures. In late June and early July, a "heat dome" brought an unprecedented rise in temperatures to the Pacific Northwest. A heat dome occurs when high-pressure atmospheric conditions produce vast areas of heat that get trapped in a bubble, creating an intense and slow-moving heat wave for areas under the "dome." Temperatures spiked to above 100 degrees across the region, with temperatures reaching as high as 108 degrees in Seattle and 116 in Portland, which are both new records. The sweltering heat has created several challenges for the Pacific Northwest. The region typically enjoys mild summers, and many residents do not have air conditioning to cope with triple-digit temperatures. As a result, state and local authorities opened cooling centers and lifted any remaining COVID-related capacity restrictions at movie theaters, swimming pools and shopping malls. In order to beat the heat, many residents also flocked to air-conditioned hotels, which caused occupancy levels to rise sharply across the region.
There have also been a number of other economic consequences. For one, households that do have the ability to cool their homes cranked up the air conditioning during the heat wave, which likely contributed to a 3.3% jump in national electric utility production during June. The blistering heat has also been a test for a region's infrastructure. High temperatures cause asphalt to expand, and some of the region's roads have warped or buckled. In Seattle, several metal bridges needed to be doused in cold water to prevent the metal from expanding. The heat disrupted Portland's power grid and damaged the city's streetcar and light rail system's overhead wires, causing service to be suspended.
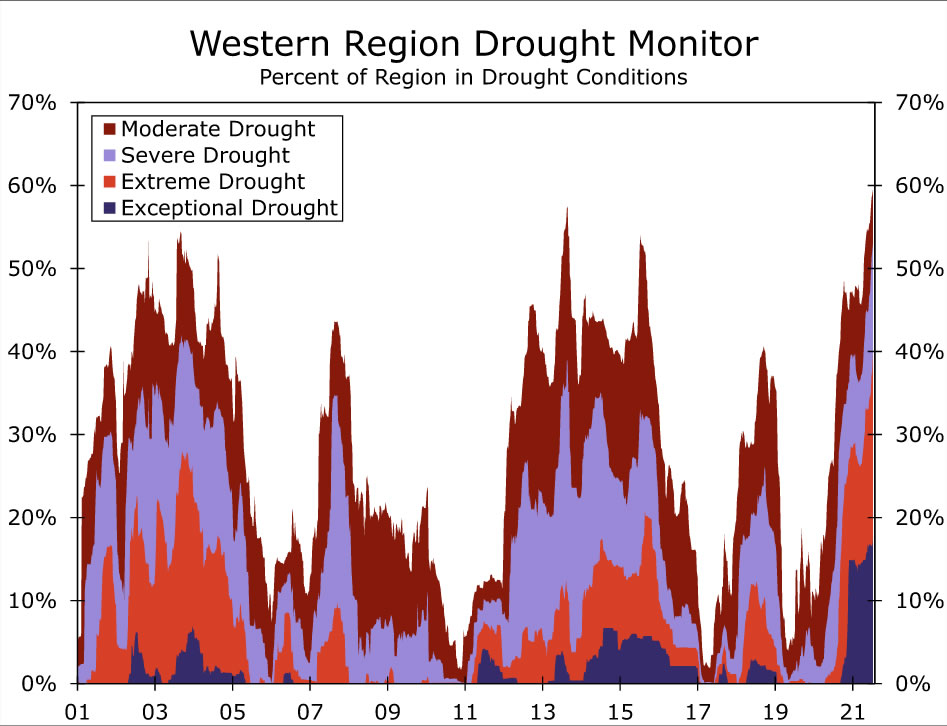
The extreme heat comes on top of a "megadrought" that has been ongoing since 2020 throughout most of the West. As of July 13, over 50% of the Western region was classified as experiencing severe drought conditions, the most since the National Drought Mitigation Center at the University of Nebraska-Lincoln first started keeping records in 2000. Most concerning, drought conditions have escalated to "exceptional" (the most severe classification) in over 33% of California. The ongoing drought and recent heat wave have put the region's entire water infrastructure under tremendous strain. For instance, more than 1,500 reservoirs in California were 50% lower than normal for this time of year, according the Center for Watershed Sciences at the University of California-Davis. The reduction in water supplies means less water for hydropower as well as residential and commercial uses. California state officials recently asked residents as well as industrial, commercial and agricultural operators to cut back on water usage by 15%.
Adding to the region's woes, wildfire activity in the West is ramping up alongside the excessive heat and severe drought conditions. During June, large wildfires were burning in Arizona, California, Colorado and Oregon. So far this year, California wildfires have scorched over 142,000 acres in the state, over three times more than during the same time period last year. Similarly, the Telegraph Fire in Arizona has burned more than 180,000 acres and became the sixth-largest wildfire in modern state history.
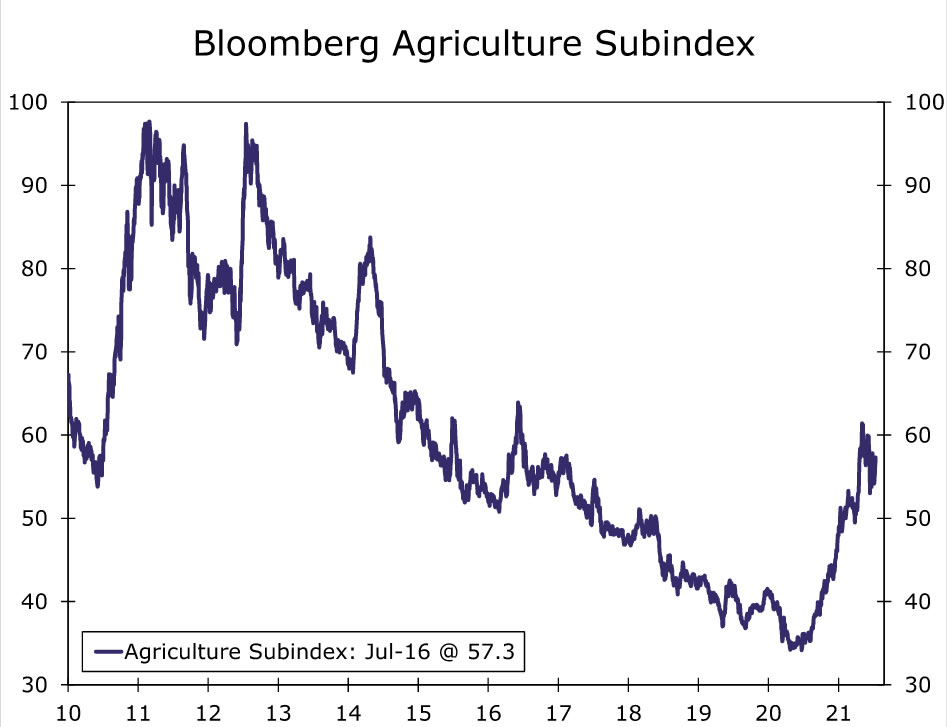
So far, the agriculture industry appears to be feeling the brunt of the impacts from wildfires, worsening drought conditions and shrinking water supplies. Dry conditions have lowered expectations for crop yields this year, notably for barley and durum wheat. Livestock owners have also found feeding their herds has become a challenge, as drought conditions make it difficult for pastures and rangeland to grow. As a result, livestock producers are opting to reduce their herds or send stock to pastures with better conditions. Lower crop and livestock yields alongside rebounding consumer demand has triggered a surge in agriculture prices, which had been trending lower since 2012. Bloomberg's Agriculture Index, which tracks futures contract prices for a basket of agricultural commodities, currently sits about 40% higher than the level seen at the end of 2019. While there are undoubtedly other factors other than the drought that are contributing to the rise in agriculture prices, the recent upturn is nevertheless yet another example of mounting inflationary pressures still building across the economy.
The Weekly Bottom Line: BoC Tapers QE, Upgrades Inflation Outlook
U.S. Highlights
- Fed Chair Powell was in the hot seat as members of Congress peppered him with questions about what the Fed is doing about hot inflation. Core CPI inflation neared a 30-year high in June.
- Travel-related inflation has surged since March as the economy re-opens, driving up core inflation. The Fed is viewing this as transitory for now, but Powell was humble that forecasts are particularly uncertain.
- June retail sales also showed shifting consumer spending patterns, as sales related to going out have accelerated in recent months, while sales related to staying home have lost ground.
Canadian Highlights
- The Bank of Canada (BoC) left the overnight rate unchanged at 0.25% this week, while tapering its purchases of Canadian government bonds to $2 billion per week (from $3 billion).
- The BoC’s forecasts for economic growth was downgraded for this year, but upgraded in the years following. Its forecast for inflation was also upgraded in both the near and medium term.
- Inflation in Canada has not reached U.S. levels and is likely to peak below it. A slower re-opening and higher loonie have mitigated some of the inflationary pressures seen stateside.
U.S. - Consumers are Heading Out and Paying Up
The U.S. data calendar heated up this week, and there is no hotter metric these days than inflation. With the annual pace of core inflation nearing a 30-year high (see commentary), Fed Chair Powell was on the hot seat in Congress, facing a barrage of questions about what the Fed is doing about it. Powell acknowledged that inflation is running well above the pace the Fed typically likes to see. He reiterated previous messaging that the Fed views it is a shock associated with the reopening of the economy – led by pandemic-related bottlenecks and one-time increases in the price of certain services.
However, he did acknowledge that there could be other areas where price pressures bubble up to replace the current sources of price pressures, and the Fed is watching it closely. He stated he doesn’t think we will have to wait long to find out if the Fed’s interpretation is accurate. He was humble that re-opening shuttered parts of an economy at this scale is unprecedented, and forecasts are particularly uncertain.
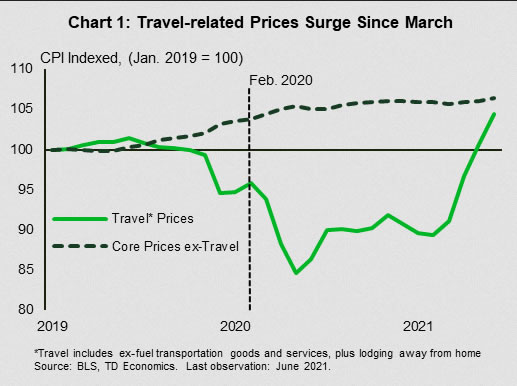
Looking at recent months, the biggest price increases have been in “things associated with travel.” After a year staying close to home, Americans are getting on the road again. Demand for travel-related goods and services is outstripping the industry’s ability to ramp up, and the price increases are steep. Semiconductor shortages have pushed up prices for both new and used vehicles, with knock-on effects on car rental prices. At the same time, prices for hotels, airfares and car rentals are recovering from price plunges early in the pandemic.
Since March, these travel related price increases have accounted for over half of the monthly increase in core inflation, despite accounting for less than 18% of the core inflation basket. Stripping them out would have left core inflation running around 0.2% m/m since March (Chart 1). We wouldn’t expect these monthly price hikes to go on forever, but as Powell pointed out, other areas could perk up. Medical care inflation has been decelerating sharply after big increases in 2019, and could accelerate once again. Shelter inflation, ex-hotels also decelerated earlier in the pandemic but is showing early signs of firming. There is plenty to keep an eye on when it comes to inflation.
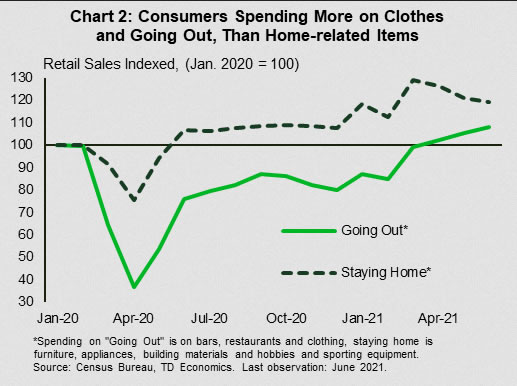
Evidence of shifting consumer patterns as the economy reopens was also seen in the June retail numbers. Overall sales rose 0.6% month/month, ahead of market expectations (see commentary). Sales at bars and restaurants and clothing and accessory stores were both up strongly – categories that could be labelled “going out.” Looking at the trend in this “going out” category, spending started to surge in March, and is now above pre-pandemic levels. On the flip side, spending on things related to staying home – furniture, building materials and sporting goods and hobbies has fallen since March (Chart 2). And, the retail sales numbers do not include spending on other affected services, like haircuts. We will need to wait until the June personal income and spending numbers are released at the end of the month to see how quickly services as a whole are rebounding.
Canada - BoC Tapers QE, Upgrades Inflation Outlook
The big story this week was the Bank of Canada's interest rate announcement and accompanying Monetary Policy Report (MPR). As expected, the Bank left the overnight rate unchanged but announced a further tapering in its purchases of government bonds to $2 billion per week (from $3 billion previously).
The Bank's economic outlook was downgraded for 2021 (to 6.0% from 6.5%), but this is largely in the rear-view mirror, reflecting a slower-than-anticipated pace of growth in the first half of the year that is expected to be made up with stronger growth in the second. While Canada's economy was hit hard by third wave restrictions, its relatively successful vaccination campaign is expected to lead to a surge in growth in the second half of the year.
The downgrade to 2021 was more than offset by an upgrade to real GDP growth in 2022 (to 4.6% from 3.7%). Growth is expected to be led by consumer spending (advancing by 3.6%). A key question on that front is how much of the savings accumulated over the last year and a quarter of the pandemic will be spent as life returns to normal. The MPR noted that when asked, households report that they intend to spend at least some of their nest egg, with the portion increasing with income. The Bank has built in an expectation that overall, 20% of these savings make their way into spending, contributing to the forecast upgrade.
The other notable area of the central bank's forecast to be upgraded was inflation. This will not come as a surprise to anyone who has been following the news. Inflation has come in well above expectations due to the combination of supply constraints and surging demand for goods. Notably, Canada's inflation rate has not been as high as the U.S. (Chart 1) in part reflecting earlier re-opening stateside, but also a strengthening Canadian dollar over the past year that has weighed on import prices (see report).
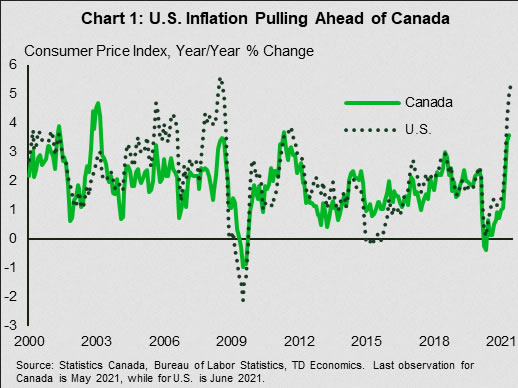
The loonie has given up some of those gains in recent weeks – falling as low as 79 cents U.S. this week – in part due to that greater surge in inflation stateside, which has moved forward expectations for Fed tightening. A slightly lower exchange rate will not be unwelcome by the Bank of Canada.
The Bank continues to characterize the inflation outlook as largely reflecting transitory factors. Still, in its commitment to leaving interest rates on hold until the output gap is fully closed, (which it does not expect until the second half of 2022), it has also raised its expectations for inflation over the medium term (2023) to 2.4%. This, of course, is above the mid-point of the Bank's 1% to 3% target range for inflation, but consistent with their forward guidance and commitment to ensuring the economic recovery is fully cemented.
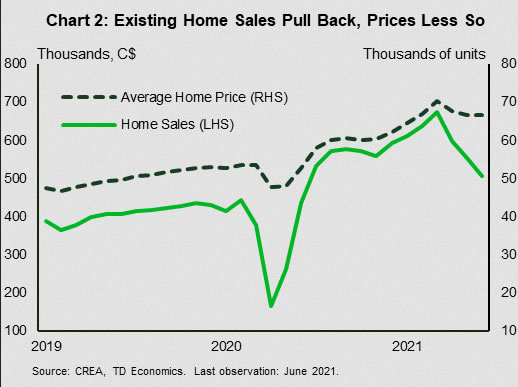
Another consideration for the Bank of Canada is the amount of heat generated in the nation's housing market. On that front, they may be pleased with the apparent slowdown in activity over the past few months. Existing home sales have fallen 25% since their peak in March. Sales are still elevated relative to history and supply is low. A gradual unwind of recent excesses is a best case scenario.
Week Ahead – ECB on Deck as Stimulus Debate Heats Up
Financial markets want to know if the Fed is committed to a sustained inflation overshoot. The bond market flattener trade suggests many market participants think we have seen the peak in yields. Inflationary pressures are showing no signs of easing just yet and the market will soon look to test the Fed’s patience. The dollar has been stuck in a tight trading range since the middle of June but that could soon change if the rest of the world shifts to a tightening mode more quickly than the Fed.
The upcoming week is filled with many catalysts that stem from a deadline to finalize a bipartisan infrastructure package, persistent global delta variant concerns, widespread inflationary pressures, central bank rate decisions, and a busy week of earnings results. The main event will be the ECB rate decision and press conference. This will be the first meeting since their strategy review that aimed for a slightly higher inflation target. It appears that a divide is growing in the ECB over stimulus guidance, a sign that the hawks will be strongly push for tightening in the fall.
All eyes will be on England after UK PM Johnson has decided to move forward in lifting most pandemic restrictions on July 19th. The UK has had one of the best COVID-19 vaccination campaigns in the world, with more than 46 million people having received at least one dose of coronavirus vaccine. BOE's Saunders noted that withdrawing stimulus measures may be appropriate soon. Deputy Governor Ramsden stated "envisage those conditions for considering tightening being met somewhat sooner than I had previously thought." Currency traders will pay close attention to BOE's Haskel on Monday to see if the bank is quickly shifting to taper mode.
Country
US
Wall Street had a very choppy trading week after a mixed start to earnings season, a dovish semi-annual monetary policy testimony from Fed Chair Powell, and fading confidence from the US consumer. When the dust settled the dollar was stronger, Treasury yields were lower, but confidence in risky assets started to wane. The second week of earnings will provide a broader look into several sectors of the economy, which might support the argument that inflation is looking more persistent.
Wall Street will closely follow every development with the bipartisan infrastructure proposal on Capitol Hill. Senate Majority Leader Schumer will try to deliver on his ambitious timeline to get this bill passed. A key procedural step should occur on Monday and that could set up an initial vote on Wednesday for the $579 billion infrastructure deal.
With the Fed entering the blackout period ahead of the July 29th FOMC policy decision, it is a busy week of economic data, but nothing like the past one. On Monday, the NAHB housing market index is expected to tick higher to 82, still well off the highs seen at the end of last year. On Tuesday, both Building Permits and Housing Starts should post modest gains, a sign the housing market isn’t ready to cool. Thursday is all about weekly initial jobless claims and if the rate of decline can speed up. Friday is all about the flash PMI readings which should show steady activity in both the manufacturing and service sectors.
EU
The ECB holds its monetary policy meeting on Thursday, and the central bank is widely expected to implement significant changes in monetary policy. The July meeting was expected to be a non-event, but the release of the ECB’s strategy review last week has the markets buzzing since the Thursday meeting should provide more clarity on how the bank plans to implement this new strategy.
At the presentation of the strategy review, ECB President Christine Lagarde said that there would be a review of forward guidance to align it to the strategy review. This means that we could see some important changes in forward guidance at the meeting.
The strategy review has changed the inflation target from “below, but close to 2%”, to “2%”, and also stated that the bank is willing to accept “a transitory period in which inflation is moderately above target.” The ECB is likely to incorporate these changes in its forward guidance.
The ECB is unlikely to increase the size of bond purchases through the Pandemic Emergency Purchase Programme at this meeting but may indicate that these purchases will be increased in September.
On Friday, Germany releases July PMI reports. Manufacturing PMI is forecast to come in at 65.0, while the estimate for Services PMI stands at 60.0 points. Both of these estimates are indicative of strong growth.
UK
On Monday, the government is scheduled to lift all Covid restrictions, with mask-wearing and social distancing optional but not mandatory. However, there is opposition from health officials who fear the move could lead to a surge in Covid infections. As well, the mayor of London has said that passengers on public transport will still be required to wear masks.
BoE member Jonathan Haskel will deliver a speech at the University of Liverpool School of Management, on the topic “Will the pandemic scar the economy?”
On Tuesday, U.K. Business Secretary Kwasi Kwarteng testifies before a parliamentary committee on how to protect the nation’s steel industry following the massive collapse of Greensill Capital.
The week finishes on a busy note. The consensus for UK Retail Sales for June is 0.4% MoM and 9.8% YoY. The July PMIs are projected to remain well into expansionary territory, with a forecast of 62.0 for Manufacturing PMI and 62.5 for Services PMI.
Emerging Markets
Russia
On Friday, the Bank of Russia holds a policy meeting. The central bank may tighten policy and raise interest rates by 75 basis points or more, with inflation running well above the bank’s target of 4.0%. In June, the bank raised rates from 5.0% to 5.5%
South Africa
South Africa releases June CPI on Wednesday. The consensus stands at 4.8% YoY, down from 5.2% in May.
On Thursday, the South African Reserve Bank is expected to keep interest rates unchanged at 3.50%.
Asia Pacific
China
The afterglow from last Friday’s RRR cut has quickly faded. China data this past week appeared to show the economic recovery slowing. Washington DC is ramping up the anti-HK and Xinjiang and adding more China tech companies to the entity list. Additionally, China announced tighter supervision of property developer debt levels and continues broadening its China-tech clampdown.
Unsurprisingly, China equities are struggling to maintain gains in this environment with Covid-19 swirling around the rest of Asia adding to the gloom. The PBOC has moved to a weaker Yuan bias and slighter softer policy and that means that China’s one and three-year Loan Prime Rates will remain unchanged this week.
With no other data of note this week, China markets will be at the mercy of US-Sino rhetoric and China’s internal clampdowns on technology, property etc.
India
India’s COVID-19 cases were appearing to be on the right track but a recent increase in cases has many worried that a third wave could be coming. Until COVID cases start trending lower, the Indian rupee still remains vulnerable to the dollar. A pullback with oil prices has provided some modest support for the rupee.
No significant data this week, with India and ASEAN currencies to be dominated by their internal trajectories of the delta-variant Covid-19. The Rupee remains vulnerable to more US Dollar strength.
Australia & New Zealand
Australian stock markets are trading sideways despite another impressive set of jobs data this past week. The focus remains on the NSW Covid-19 outbreak and deepening restrictions in Sydney. Melbourne also entered a snap lockdown today as cases spread to Victoria and also South Australia. Markets remain on tenterhooks and extended closures in Sydney and Melbourne will surely see AUstralia recovery projections adjusted lower.
The RBNZ announced an end to bond buying this week, a surprise to markets. NZ inflation blew higher this week as well resulting in every NZ Bank pricing multiple rate hikes this year. That has lifted both the NZD/USD, and to a lesser extent AUD/USD. The New Zealand Dollar is set to perform strongly against both the US and Australian Dollars this week.
THE RBA Minutes will be ignored by local markets which will remain fixated on Covid-19 domestically, and this will drive market movements downunder this week. Aust. Retail Sales and PMI will be of only passing interest.
Japan
Risk appetite for Japanese assets took a big hit after news that fans will be banned at the Summer Olympics. Japan is clearly still in the middle of its fight against COVID and the decision to declare a state of emergency through August 22nd will dramatically force investors to downgrade their growth forecasts. The Bank of Japan downgraded GDP growth only slightly at its policy meeting today but Japan equities have given back all of their week’s gains as fears over a Covid slowdown intensify. Like the rest of Asia, Japan markets will be vulnerable to Covid-19 caseloads in the week ahead. USD/JPY remains a purely US/Japan rate differential play at the moment.
Japan has a short week ahead with Thursday and Friday both national holidays. WIth Covid-19 and the Olympics foremost, and with the BoJ policy meeting out of the way, Tuesday’s Inflation and Balance of Trade will not be market moving releases.
Markets
Oil
Covid-19 concerns are not easing up at the moment and that has been sending oil prices lower. Even countries with successful vaccine campaigns are struggling with the Delta variant and that is proving disruptive to the short-term crude demand outlook. The drama between the UAE and Saudi Arabia appears to be over and if OPEC+ can ratify that this week, more supply will be welcomed.
A big driver for oil prices will be Iranian output and that question won’t get answered until well after Iranian hardliner Raisi will be inaugurated president in early August.
If risk aversion becomes the dominant theme and the dollar rallies on safe-haven flows, WTI crude could start to see significant momentum selling.
Gold
Gold prices were having a tremendous July until the rally ran into a brick wall of technical resistance at around the $1,835 area. Gold has been supported by the belief that many on Wall Street believe we saw the peak in rates and that has been good news for gold. It seems we are seeing a long-term secular declining trend in rates as the US will have a high debt burden problem going forward and can’t afford to raise rates. The longer-end of the Treasury curve will struggle to see the steepener trade return and that should be good news longer-term for gold.
The bullish move appears to have been exhausted post Fed Chair Powell’s testimony, which means prices could consolidate until the end of the month. The Fed’s blackout period is beginning, so gold should remain confined by the $1800 and $1850 range.
Bitcoin
Bitcoin continues to consolidate, trading consistently in the lower boundaries of the $30,000.00 and $40,000.00 trading range. Bitcoin weakness from further China crackdown news or negative endorsements has yet to seriously threaten the $30,000 level as many traders still remain committed to their longer-term bets.
The upcoming week includes a key event on Wednesday, called “The B word”, which attempts to show how institutions can embrace Bitcoin. Every crypto trader will definitely listen closely to hear any updates over Bitcoin mining clean energy initiatives. Tesla CEO Elon Musk, Square Co-Founder Jack Dorsey, and ARK Invest CEO Cathy Wood will all speak.
Key Economic Events
Monday, July 19
- PM Johnson lifts Covid restrictions in England
- BOE policy maker Haskel speaks at the University of Liverpool School of Management on “Will the pandemic scar the economy?”
Economic Data/Events:
- UK Rightmove house prices
- Turkey consumer confidence
- Poland employment, average gross wages
Tuesday, July 20
- US Secretary of Transportation Buttigieg speaks at the Economic Club of Washington D.C.
- UK Business Secretary Kwarteng speaks to Parliament committee on how to protect the nation’s steel industry
Economic Data/Events:
- US housing starts, building permits
- Netflix Earnings
- Eurozone Current Account Balance
- Italy Current account balance
- Australia RBA meeting minutes
- China loan prime rates
- Japan CPI
- Switzerland trade, watch exports
- South Africa leading indicator
- Germany PPI
- Czech Republic PPI
- Poland PPI
Wednesday, July 21
- Tesla CEO Elon Musk and Square Co-Founder/CEO Jack Dorsey will discuss Bitcoin at an event called “The B Word.”
Economic Data/Events:
- Australia Retail Sales
- Poland Retail Sales
- Italy industrial Sales
- Japan trade
- UK public sector net borrowing
- South Africa CPI
- EIA Crude Oil Inventory Report
Thursday, July 22
Economic Data/Events:
- ECB Rate decision: To commit in its forward guidance to keeping interest rates unchanged until inflation is forecast to reach or slightly surpass 2%.
- US initial jobless claims, leading index, existing home sales
- South Africa central bank (SARB) Rate Decision: to keep rates on hold
- Eurozone Consumer confidence
- France manufacturing confidence
- Netherlands unemployment, consumer spending
- Russia Industrial production, gold and forex reserves
- Ireland PPI
Friday, July 23
- ECB to decide on whether to lift the bank dividend cap.
- Spain PM Sanchez speaks and to meet with technology CEOs.
- The Tokyo Summer Olympics begin.
Economic Data/Events:
- US July prelim Markit Manufacturing PMI: 62.1e v 62.1 prior
- Germany July prelim Manufacturing PMI: 65.0e v 65.1 prior
- Eurozone July prelim Manufacturing PMI: 62.1e v 63.4 prior
- UK July prelim Manufacturing PMI: 62.0e v 63.9 prior, GfK consumer confidence, retail sales
- Russia central bank (CBR) rate decision: Expected to raise interest rates 75 basis points to 6.25%
- Singapore CPI, private home prices
- Poland unemployment rate
- Spain mortgage lending
- Canada retail sales
- ECB survey of professional forecasters
Sovereign Rating Updates:
- Cyprus (Moody’s)
- EFSF(DBRS)
- ESM (DBRS)
Forward Guidance: Canadian Retail Sales Rebound; Services Take Over as Driver of Spending Growth
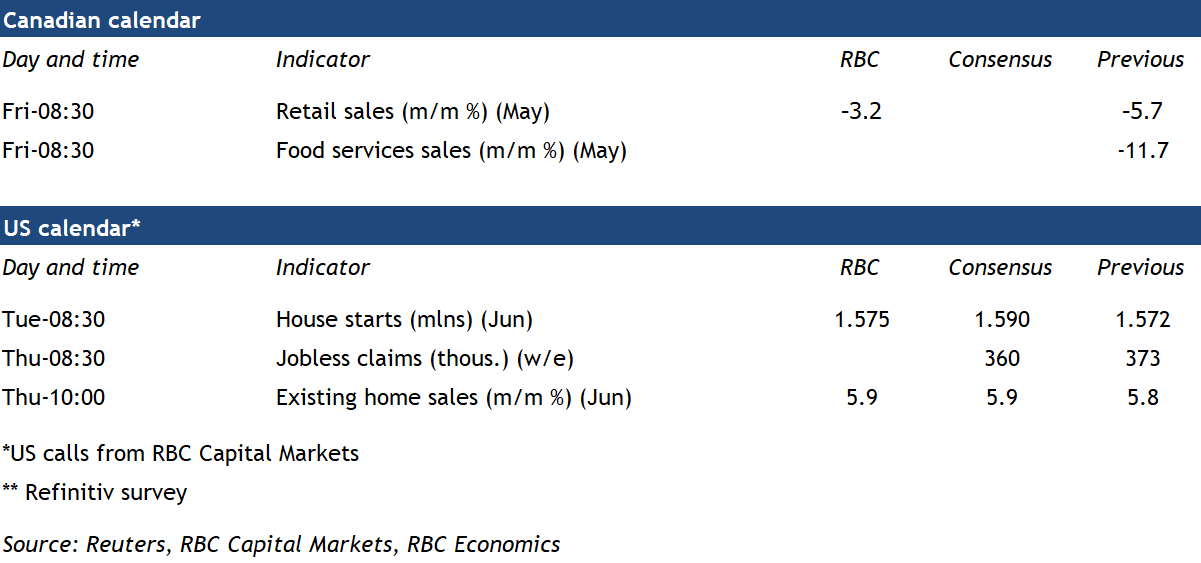
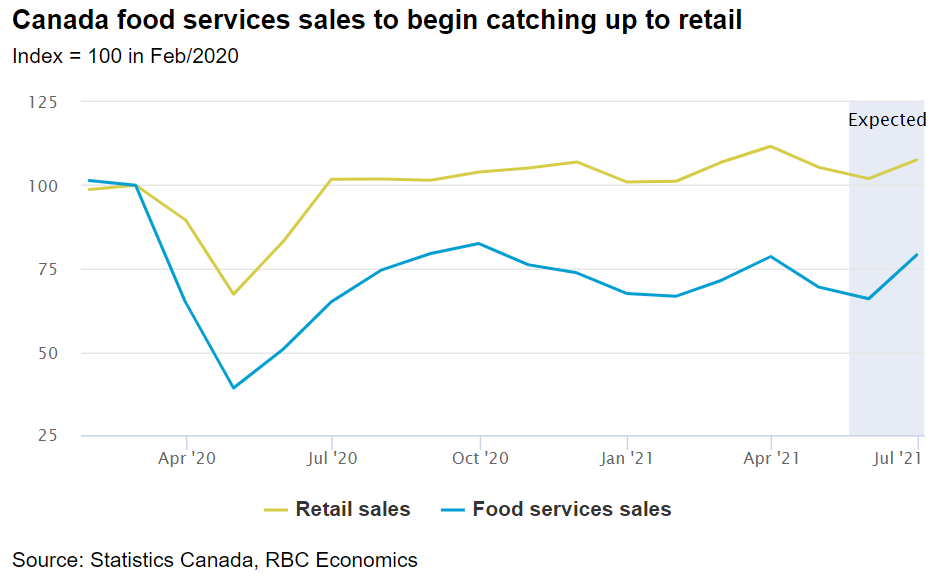
The big story next week will be the preliminary read on June retail sales after softer readings in April and May. Our own consumer tracker points to a sizable rebound in June sales, up 5-6% month over month after a decline in May similar to the 3.2% advance Statistics Canada estimate. The rebound in June came as provincial economies started to reopen - with particular gains for store types that were hit hard by lockdowns, such as clothing and footwear.
In fact, retail spending on goods outside of items like clothing has actually been quite strong. Even sizeable declines in April and May do not appear large enough to have pushed sales below pre-pandemic levels. In part, that’s because contactless shopping for goods has been made easier by expanded e-commerce infrastructure. Meantime, household purchasing power has been propped up by government support payments all while many services—which aren’t counted in the monthly retail sales data—have simply been unavailable for consumption. But as pandemic restrictions are gradually lifted, there are signs that a long-awaited rotation in household spending back to 'high-contact' services is finally beginning. Data on food services spending for May (to be released next week) will still be weak, but we expect a significant strengthening in June and the months to follow, as travel and hospitality services become the primary fuel for consumer spending growth.
Week ahead data watch:
- Vaccine distribution continues to progress, with close to 80% of the eligible (age 12+) population in Canada having received at least one dose and more than half now fully vaccinated with two doses. Provinces continue to ease restrictions, with Ontario entering Step 3 of the reopening process on July 16.
- US existing home sales are expected to hold close to May levels in June—still high by historical comparison but a decline from exceptionally strong levels earlier in the spring.
Next week’s flash PMI releases will offer an early guide to the health of the manufacturing sector in July in Europe and the US.