Sample Category Title
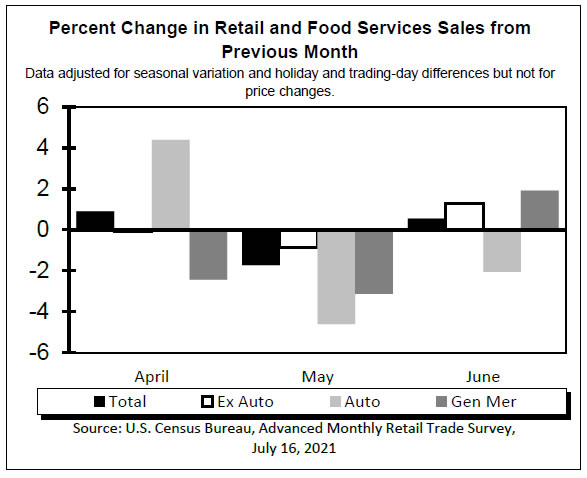
US retail sales rose 0.6% in Jun, ex-auto sales rose 1.3%
US retail sales rose 0.6% mom to USD 621.3B in June, much better than expectation of -0.6% mom decline. Ex-auto sales rose 1.3% mom, above expectation of 0.4% mom. Ex-gasoline sales rose 0.4% mom. Ex-auto, ex-gasoline sales rose 1.1% mom.
Inflation Lifts NZ Dollar above 70
The New Zealand dollar continues to exhibit considerable volatility. NZD/USD has punched above the symbolic 70 level on Friday and is currently trading at 0.7011, up 0.48% on the day.
New Zealand CPI blows past forecast
It’s been a roller-coaster week for the New Zealand dollar. The currency jumped 1.2% on Wednesday after the RBNZ announced it was halting assets. However, the kiwi surrendered most of these gains on Thursday, as the US dollar flexed some muscle.
Friday’s CPI release was much stronger than expected, sending the New Zealand dollar back into 70-territory. CPI for Q2 rose 1.30% QoQ, smashing past the consensus of 0.80%. Annual inflation has now reached 3.3%, a 10-year high. With CPI running much stronger than the RBNZ or the market had anticipated, and ANZ described the CPI release as ‘monstrous’. This means that the RBNZ will have to act fast, and Westpac has already projected a 90% likelihood of a rate increase in August. One hike won’t be enough, as inflation has pushed above 3%, the upper range of the bank’s inflation target. The bank will likely have to raise rates into 2022, and this is a bullish development for the New Zealand dollar.
There was positive news from the manufacturing sector, as the BusinessNZ Manufacturing Index accelerated to 60.7 in June, up from 58.6 in May. Manufacturing continues to expand, but at the same time, the industry is being hampered by labour shortages and logistic difficulties.
Powell says no policy shift in the offing
Fed Chair Powell kept to his dovish script on Thursday, in his second day of testimony before Congress. Powell’s message to lawmakers was that despite the surge in inflation, the Fed considers it a temporary event and expects inflation to ease lower. Powell poured cold water on any expectations for a shift in monetary policy, stating that the economy would first have to show “substantial progress”.
NZD/USD Technical
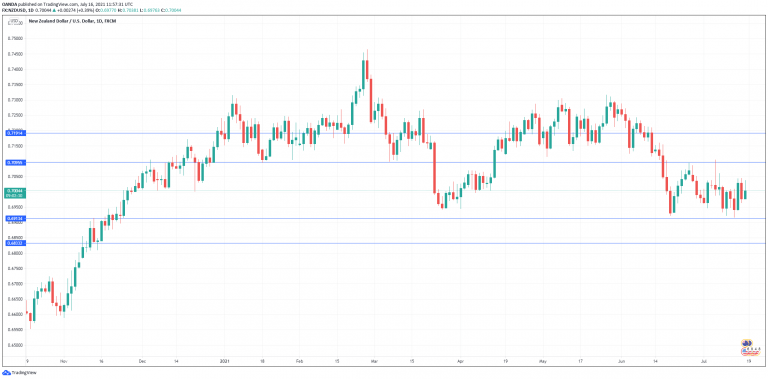
- There is resistance at 0.7095. Above, we find resistance at 0.7191
- On the downside, there is support at 0.6913 which is protecting the round number of 0.6900. Below there is support at 0.6827
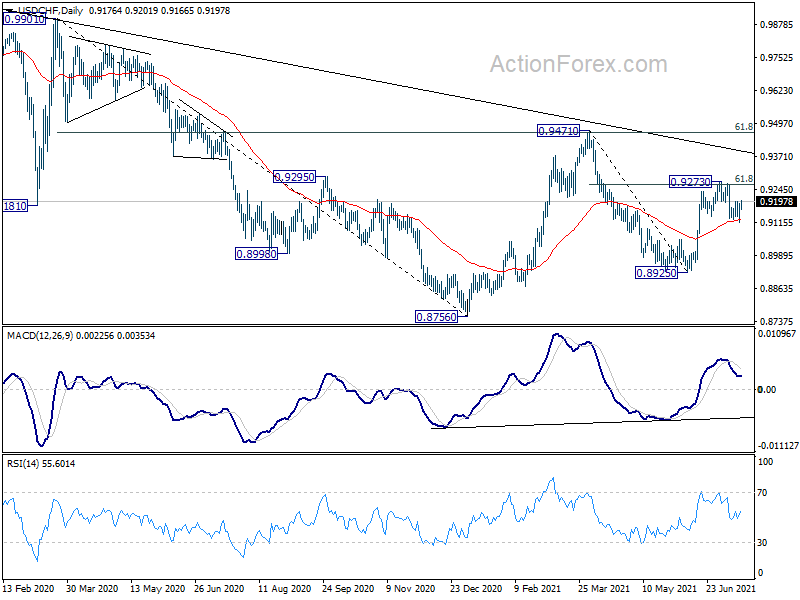
USD/CHF Mid-Day Outlook
Daily Pivots: (S1) 0.9133; (P) 0.9163; (R1) 0.9208; More....
Intraday bias in USD/CHF remains neutral as range trading continues. On the downside, sustained trading below 55 day EMA (now at 0.9126) will affirm the case that rebound from 0.8925 has completed at 0.9273. Deeper fall would then be seen back to retest 0.8925 low. On the upside though, break of 0.9273 and sustained trading above 61.8% retracement of 0.9471 to 0.8925 at 0.9262 will target 0.9471 resistance next.
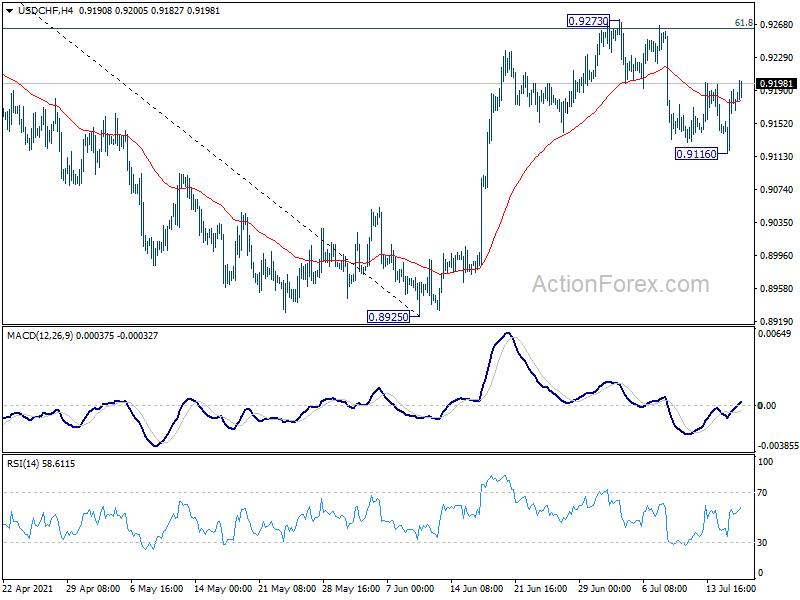
In the bigger picture, medium term outlook is currently neutral with focus on 0.9471 resistance. Sustained break there will indicate completion of whole decline from 1.0342 (2016 high). Medium term outlook will be turned bullish for a test on 1.0342 high. But, rejection by 0.9471 again will revive bearishness for another fall through 0.8756 low.
USD/JPY Mid-Day Outlook
Daily Pivots: (S1) 109.67; (P) 109.88; (R1) 110.04; More...
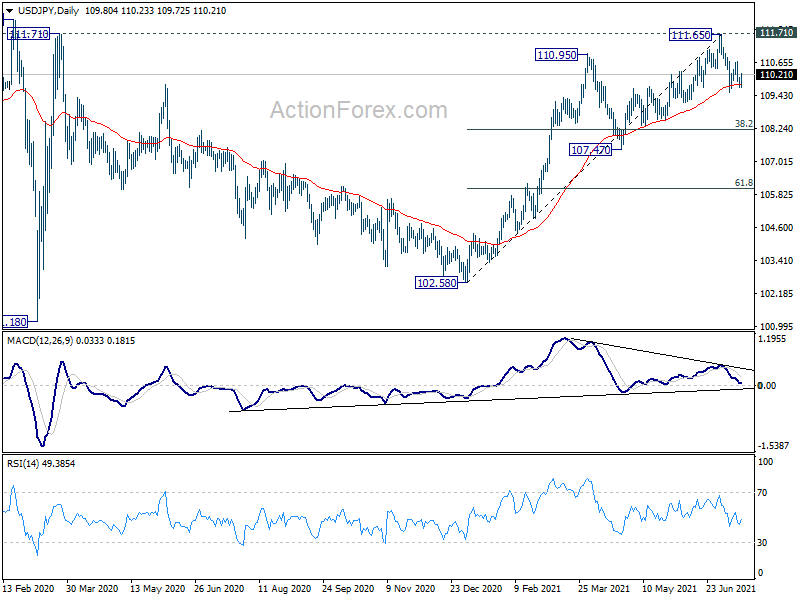
USD/JPY is staying in established range above 109.52 and intraday bias remains neutral first. Also, risk stays mildly on the downside with 111.65 resistance intact. On the downside, break of 109.52, and sustained trading below 55 day EMA (now at 109.83) will suggest that it's at least correcting the rise from 102.58. Deeper fall would be seen to 38.2% retracement of 102.58 to 111.65 at 108.18 next.
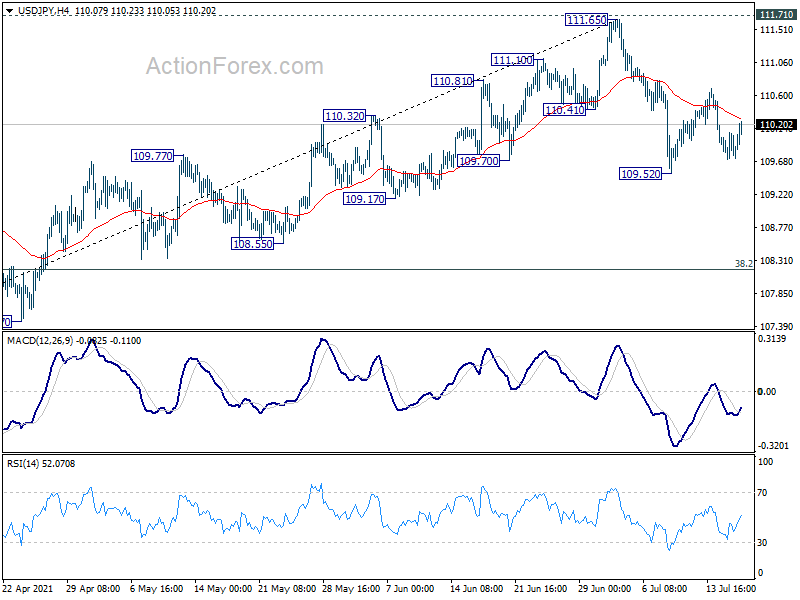
In the bigger picture, medium term outlook is staying neutral with 111.71 resistance intact. Though, as notable support was seen from 55 day EMA, rise from 102.58 is mildly in favor to extend higher. Decisive break of 111.71/112.22 resistance will suggest long term bullish reversal. Rise from 101.18 could then target 118.65 resistance (Dec 2016) and above. However, sustained break of 55 day EMA would revive some medium term bearishness, and open up deep fall back towards 102.58 support.
GBP/USD Mid-Day Outlook
Daily Pivots: (S1) 1.3788; (P) 1.3844; (R1) 1.3882; More....
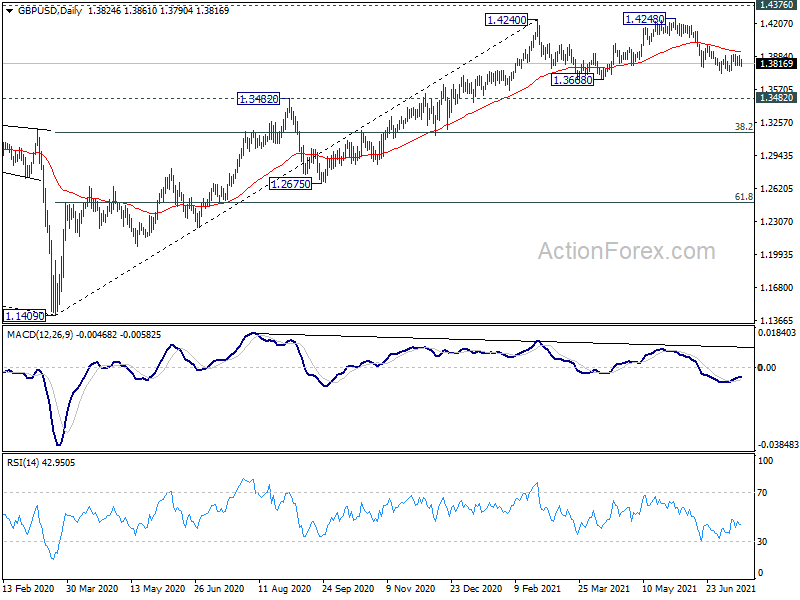
GBP/USD's sideway trading from 1.3730 is still extending and intraday bias remains neutral at this point. On the downside, break of 1.3730 will resume the fall from 1.4248, as the third leg of the consolidation pattern from 1.4240, to 1.3668 support and possibly below. On the upside, break of 1.4000 will turn bias back to the upside for retesting 1.4240/8 resistance zone instead.
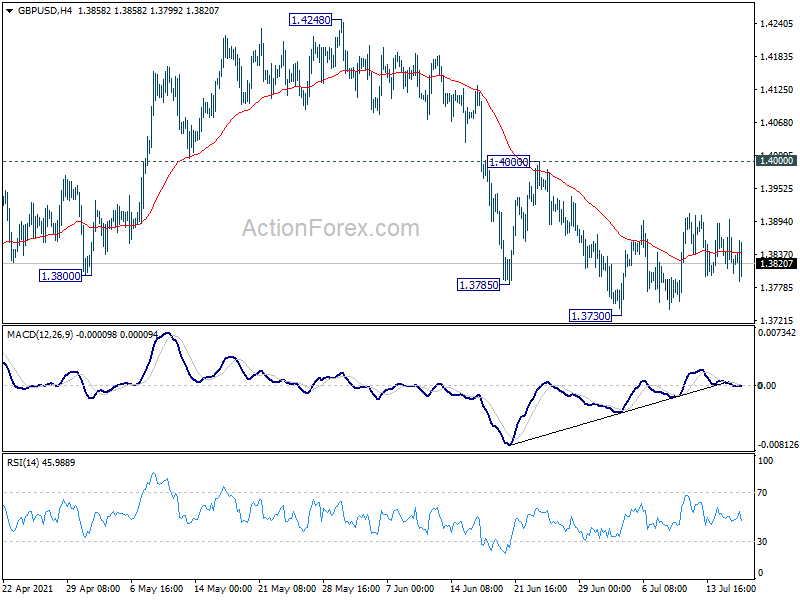
In the bigger picture, as long as 1.3482 resistance turned support holds, up trend from 1.1409 should still continue. Decisive break of 1.4376 resistance will carry larger bullish implications and target 38.2% retracement of 2.1161 (2007 high) to 1.1409 (2020 low) at 1.5134. However, firm break of 1.3482 support will argue that the rise from 1.1409 has completed and bring deeper fall to 1.2675 support and below.
Oil Extends Losses, Gold Rally Continues
Oil set for large weekly declines
Oil prices are extending losses on Friday, with oil set to decline over 4% this week. The spectacular rally in oil over the past few months appears to be stalling as investors fret over more oil being released into the market. OPEC+ is looking increasingly likely to up output to satisfy rising demand as countries continue to reopen.
Oil demand has been the key driver of oil prices over the past few months as economies reopen and OPEC+ has kept output limited. Demand is expected to increase, with OPEC predicting oil demand to rise to pre-pandemic levels next year. However, output is likely to start playing a more significant role in influencing oil’s prices.
Near term, rising Covid cases are unnerving the oil market. A rise in fuel inventories when the US driving season is supposed to be ramping up has raised a few eyebrows, not least because the July 4th holiday usually sees fuel demand surge.
Gold extends gains for the fourth week
Gold is edging lower on Friday snapping a three-day winning run. Even so, the precious metal is still set to book gains across the week, its fourth consecutive week of gains. On the one hand, gold is finding support from rising Covid cases and the flight to safety that accompanies the Covid trade. However, mixed signals from the Fed mean that the precious metal has struggled to overcome the key 200-day moving average resistance this week.
On the one hand, Fed Powell continues to reiterate that the economic recovery has a way to go until the Fed could tighten monetary policy. On the other hand, the likes of St Louis Fed President James Bullard sees conditions right to start tapering bond purchases. The US dollar is being guided higher by the hawks which is capping the upside for gold.
Attention will now shift to US retail sales and Michigan consumer confidence data. Weak numbers could work in gold’s favour by dragging on the US dollar.
European Stocks Bounce Back, Dollar Pushes Higher
Stocks rebound but flat across the week
European stocks are rebounding on Friday after Covid inspired losses from the previous session. Instead, corporate updates and Eurozone inflation have taken centre stage.
Investors are upbeat as they look to the start of the quarterly earnings season. Numbers are expected to show an improvement as businesses across the continent reopened following the pandemic.
Today’s move higher comes following steep losses in the previous session as investors fretted about rising Covid cases. In many countries, vaccination rates still aren’t at levels where the threat of another lockdown can be avoided. As such, the Covid risk to the market still exists. Recent lockdowns in parts of Asia are serving as a reminder of that.
European stocks have seen a solid runup across the previous quarter, but the momentum behind the rally has stalled recently. Strong corporate earnings data could go some way to negating the lingering Covid concerns and to provide impetus to push indices to fresh all-time highs.
Looking ahead, US stocks are pointing to a mildly stronger start after a mixed close in the previous session. In fact, trading across the week has been a mixed picture as investors weigh up the Fed’s assurance of loose monetary policy against high and rising inflation.
Attention will be firmly on US retail sales data and Michigan consumer confidence for further clues over the health of the US economy. Expectations are for another contraction in retail sales after a disappointment last month, which could weigh on sentiment.
USD set for strong weekly gains
The US dollar is pushing higher, extending gains for a second straight session and is set to end the week over 0.5% higher. This would mark the strongest rally in the US dollar in over a month.
The greenback has found support across the week from safe-haven flows as Covid cases rise and from surging inflation prompting speculation that the Fed could move to tighten monetary policy sooner. Whilst Federal Reserve Chair Jerome Powell has tried hard to play down expectations of a move to tighten policy, the persistently higher inflation figures are making it hard for the Fed to convincingly defend a dovish stance.
The pound was putting in a more convincing performance than it has for most of the week, supported in part by a more hawkish tilt from the BoE. After above-target inflation and surging wages, BoE official Michael Saunders suggested that the central bank could need to act sooner to tighten monetary policy and rein in inflation.
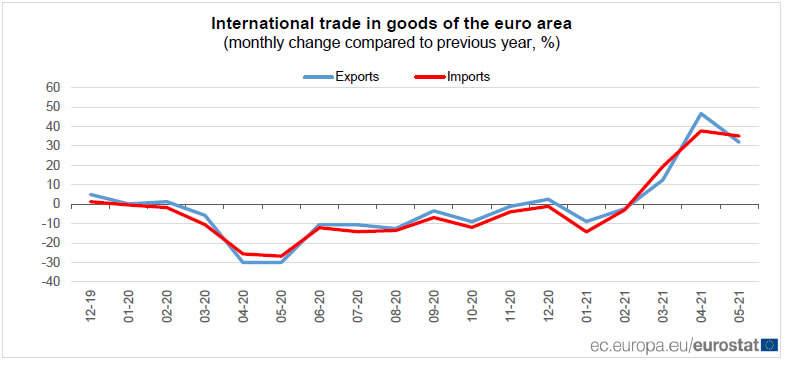
Eurozone exports rose 31.9% yoy in May, imports rose 35.2% yoy
In May, Eurozone exports rose 31.9% yoy to EUR 188.2B. Imports rose 35.2% yoy to EUR 180.7B. As a result Eurozone recorded a EUR 7.5B surplus in trade in goods. Intra-Eurozone trade rose 45.4% yoy to EUR 181.5B.
In seasonally adjusted terms Eurozone exports dropped -1.5% mom to EUR 195.1B. imports rose 07% mom to EUR 185.8B. Trade surplus narrowed to EUR 9.4B. Intra-Eurozone trade rose to EUR 183.7B.
EUR/USD Pair Started A Decent Recovery Wave From 1.1780
The Euro found support near the 1.1775 zone after a steady decline against the US Dollar. The EUR/USD pair formed a base above 1.1780 and it started a decent recovery wave.
It surpassed the 1.1800 resistance level, but it struggling to settle above the 50 hourly simple moving average. There is also a key bullish trend line forming with support near 1.1800 on the hourly chart.
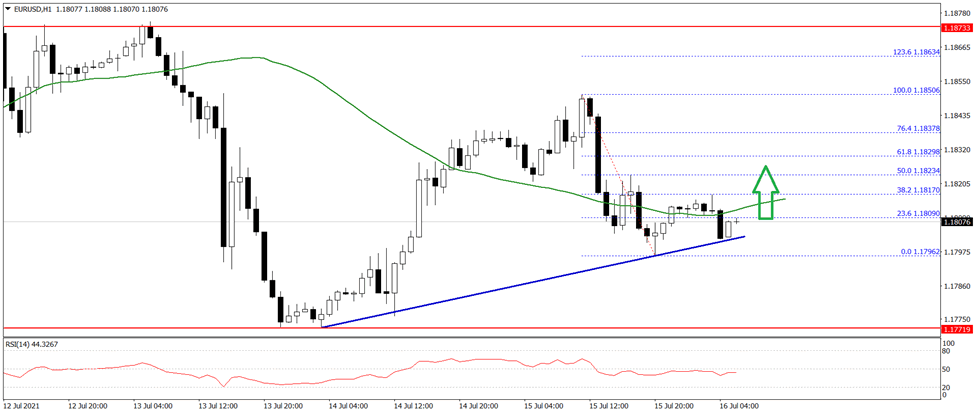
If there is a downside break, the pair could resume its decline. An initial support is near the 1.1780 level, below which the pair could dive towards the 1.1750 level.
On the upside, an initial resistance is near the 1.1825 level. The first key resistance is near 1.1850 on FXOpen, above which the bulls are likely to aim a test of the 1.1880 resistance zone in the near term.
The Analytical Overview Of The Main Currency Pairs
The EUR/USD currency pair
Technical indicators of the currency pair:
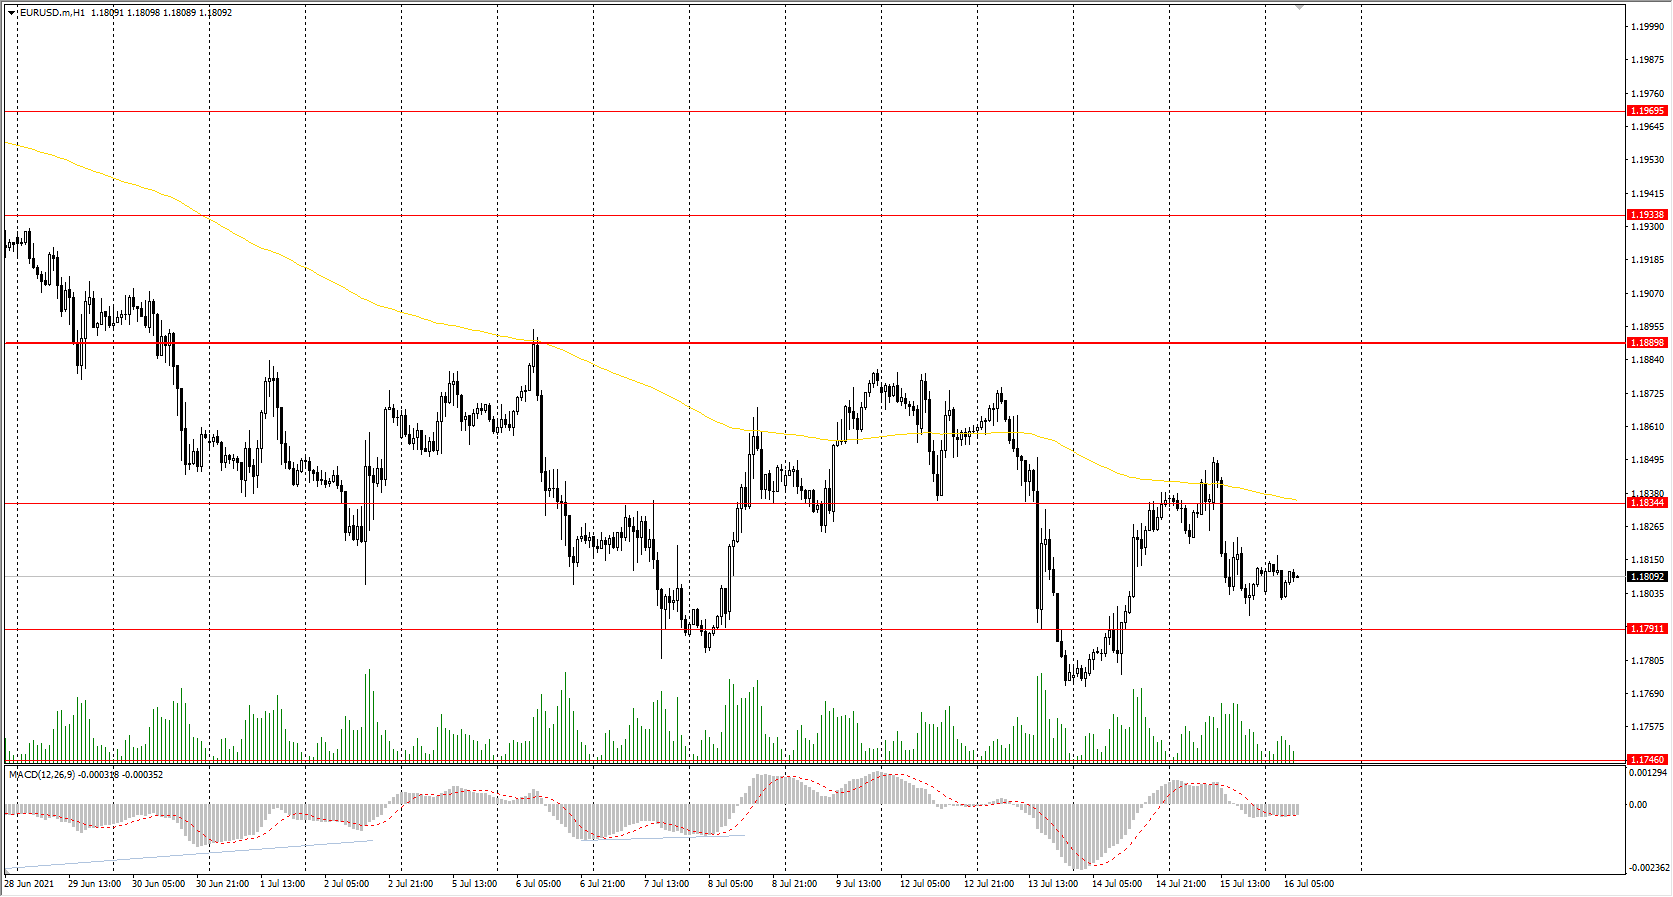
Prev Open: 1.1836
Prev Close: 1.1811
% chg. over the last day: -0.21%
Considering the good labor market data, the dollar index has slightly strengthened, which caused a slight decrease in the EUR/USD quotes (inverse correlation). Europe is reporting on inflation today. Economists are confident that the CPI number will not exceed the 2% target.
Trading recommendations
Support levels: 1.1791, 1.1746, 1.1609
Resistance levels: 1.1834, 1.1889, 1.1934, 1.1969
The trend is still bearish. The price did not manage to break through the dynamic level of the moving average. The MACD indicator is inactive. Under such market conditions, it is better to consider intraday trading. For sell positions, traders should wait for a pullback to the resistance level. Entries for long positions can be found on support levels but with short targets since this kind of trading will be against the trend.
Alternative scenario: if the price breaks through the 1.1889 resistance level and fixes above, the general uptrend is likely to be resumed.
News feed for 2021.07.16:
- Eurozone Consumer Price Index (m/m) at 12:00 (GMT+3);
- US Retail Sales (m/m) at 15:30 (GMT+3);
- US UoM Consumer Sentiment (m/m) at 17:00 (GMT+3).
The GBP/USD currency pair
Technical indicators of the currency pair:
Prev Open: 1.3859
Prev Close: 1.3824
% chg. over the last day: -0.25%
The UK labor market is recovering. The number of jobs increased by 356,000. Annual wage growth increased from 5.7% to 7.3%, and the unemployment rate remained unchanged at 4.8%. The UK is getting ready to reopen the economy, and the British pound gained a stronger position than the euro.
Trading recommendations
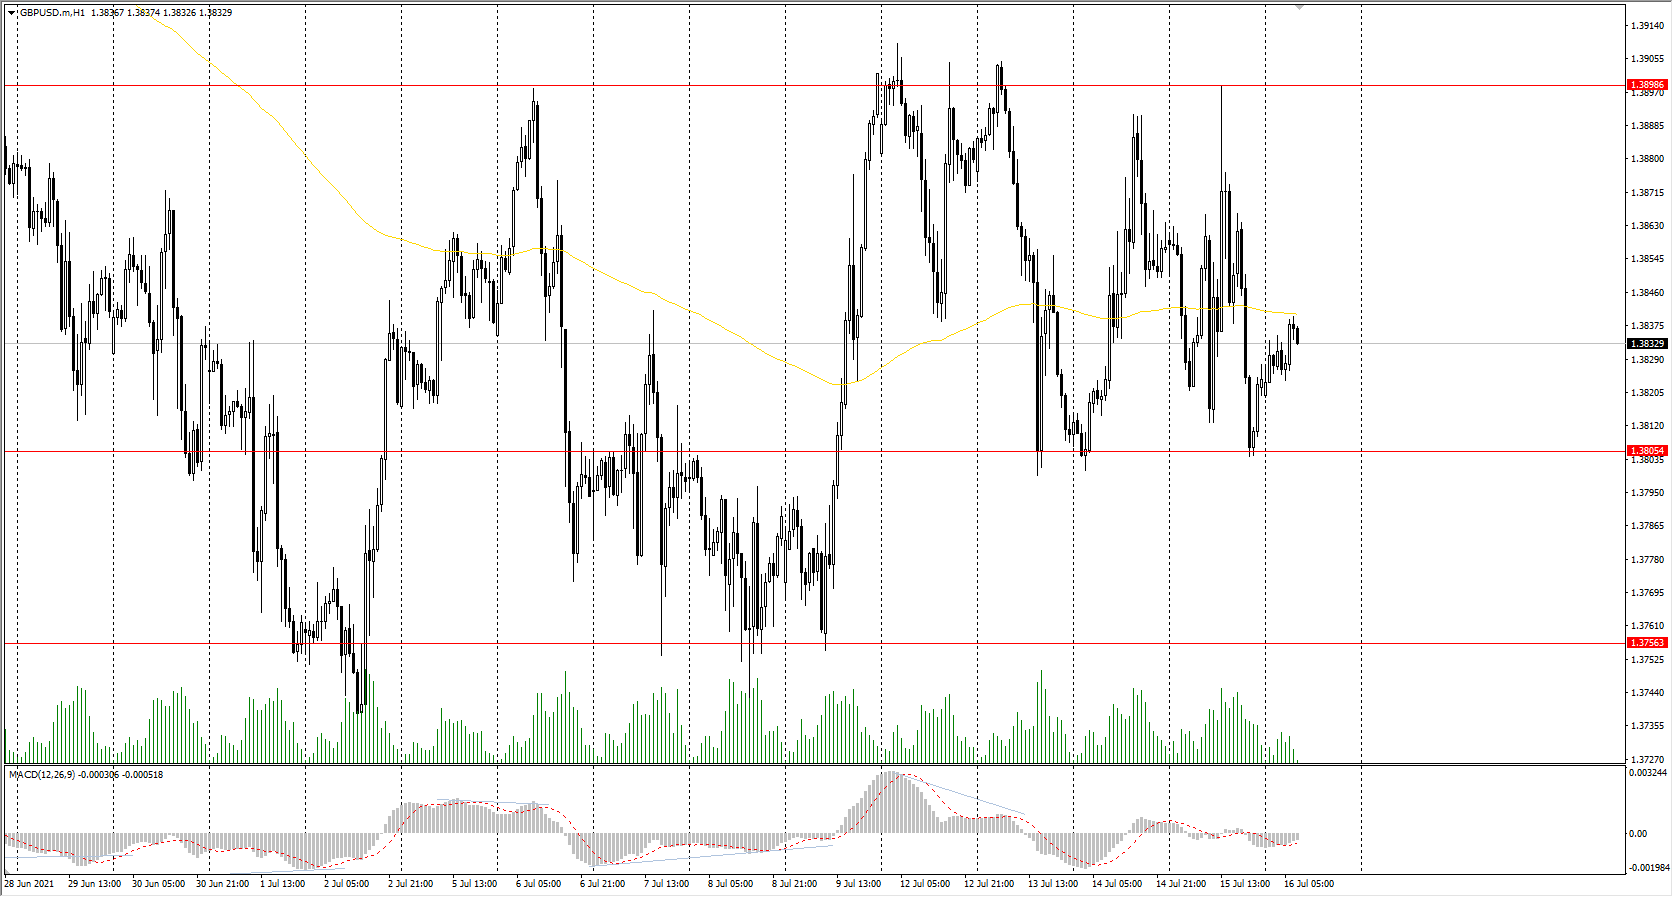
Support levels: 1.3805, 1.3756
Resistance levels: 1.3899, 1.3923, 1.4002, 1.4075, 1.4101, 1.4138, 1.4191
The GBP/USD trend is bearish on the H1 timeframe. The price is trading in a wide range now. The MACD indicator has become inactive. Under such market conditions, it is better to consider intraday trading. For sell positions, traders should wait for a pullback to the resistance level. Entries for long positions can be found on support levels.
Alternative scenario: if the price breaks through the 1.3922 resistance level and consolidates above, the bearish scenario is likely to be canceled.
The USD/JPY currency pair
Technical indicators of the currency pair:
Prev Open: 109.62
Prev Close: 109.83
% chg. over the last day: -0.08%
Japan's central bank kept its key monetary policy easing measures unchanged and retained its inflation target at 2%. The bank also announced that it would provide zero percent loans to increase investment in green initiatives.
Trading recommendations
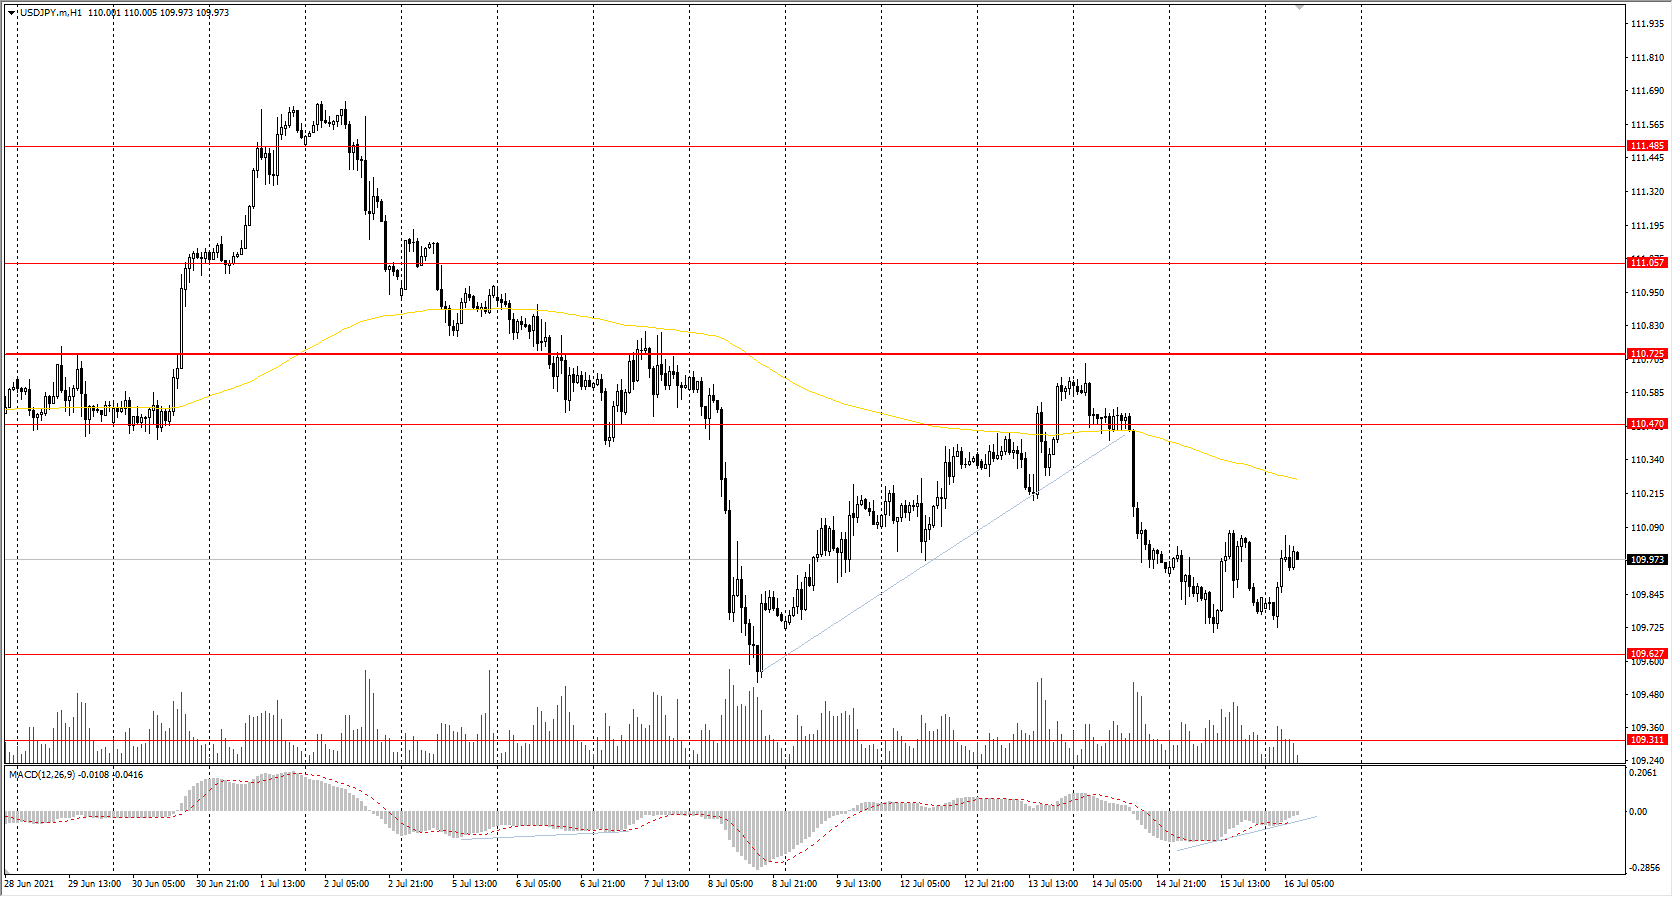
Support levels: 109.63, 109.31
Resistance levels: 110.47, 110.73, 111.06, 111.48, 110.73, 112.18
From the point of view of technical analysis, the situation has not changed. There is a downward trend on the H1 timeframe, as the price is still trading below the priority change level and below the moving average. The MACD indicator has become inactive. Under such market conditions, traders are better to look for sell positions from the resistance levels on intraday timeframes. Buy positions should be considered from support levels, but only with short targets.
Alternative scenario: if the price rises above 110.73, the uptrend is likely to be resumed.
News feed for 2021.07.16:
- BoJ Monetary Policy Statement at 06:00 (GMT+3);
- BoJ Outlook Report at 06:00 (GMT+3);
- BoJ Press Conference at 06:00 (GMT+3).
The USD/CAD currency pair
Technical indicators of the currency pair:
Prev Open: 1.2502
Prev Close: 1.2592
% chg. over the last day: +0.72%
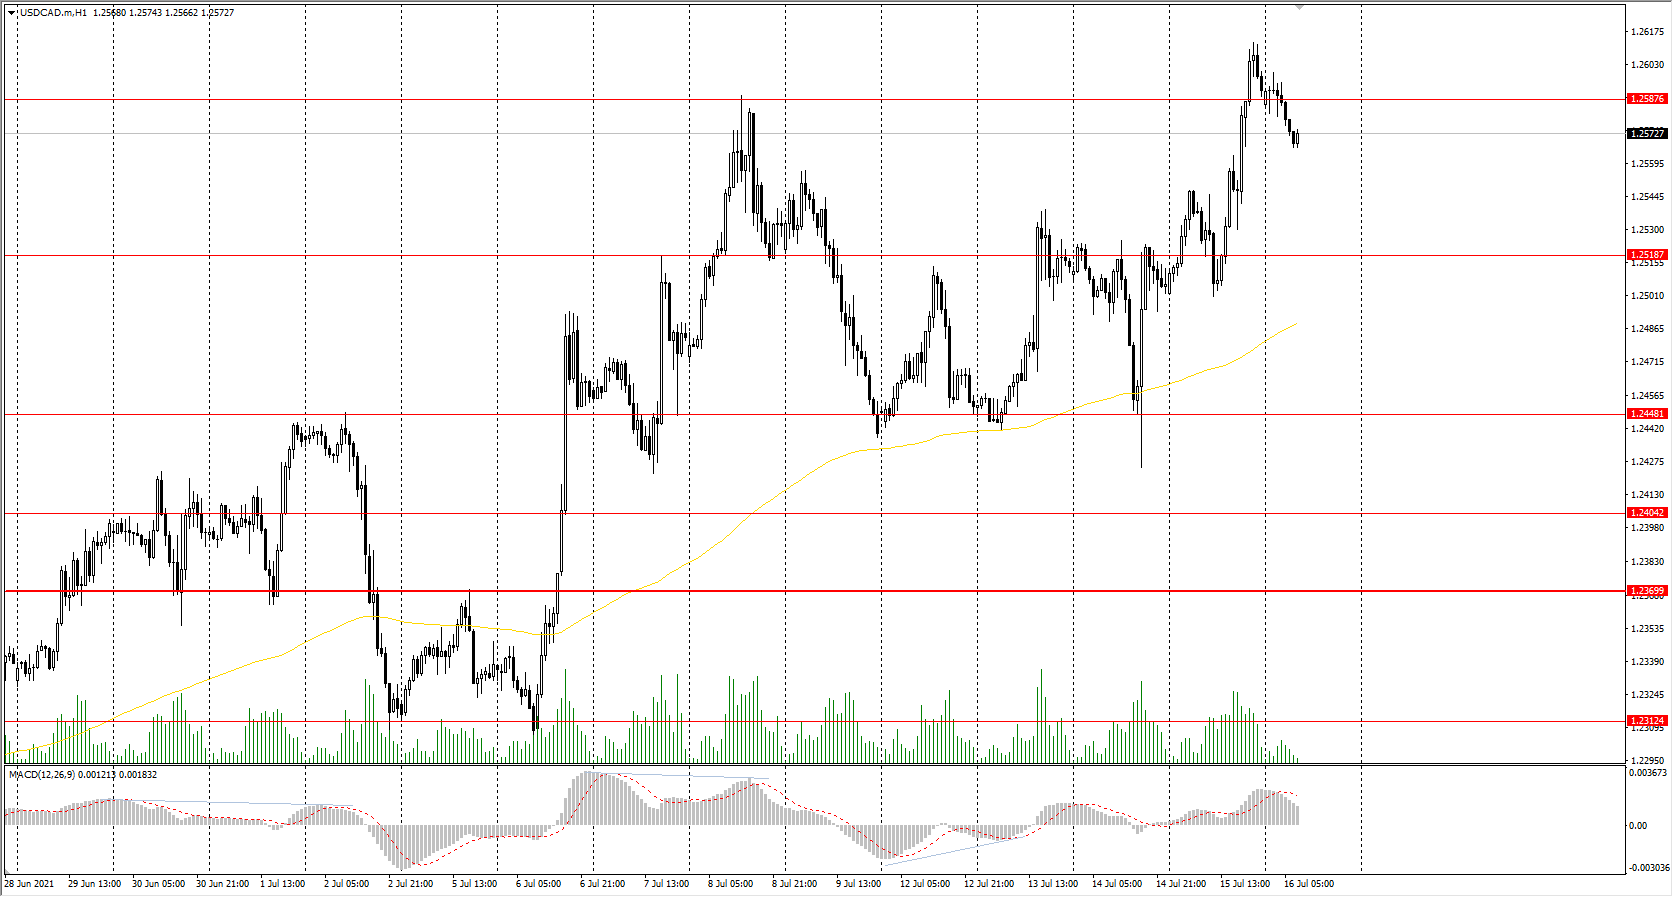
The USD/CAD currency pair increased by 0.72% yesterday. The growth was caused by two factors: the growth of the dollar index and the decline in oil prices. The Canadian dollar is a commodity currency, so a decline in oil prices has a negative impact on the CAD.
Trading recommendations
Support levels: 1.2519, 1.2448, 1.2404, 1.2347, 1.2312, 1.2260, 1.2190
Resistance levels: 1.2587
Technically, the trend remains bullish. The price is still trading above the moving average and above the priority change level. The MACD indicator is in the positive zone with no signs of reversal. Under such market conditions, it is best to look for buy trades from the support levels. There are no optimal entry points to open sell positions now.
Alternative scenario: if the price breaks through the 1.2370 support level and fixes below, the downtrend is likely to be resumed.