Sample Category Title
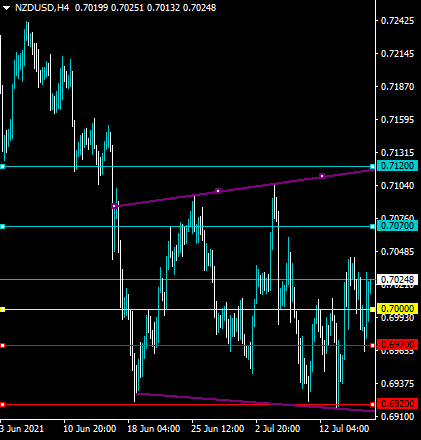
NZDUSD Bullish Above 0.7000
The New Zealand dollar is on the rise against the US dollar after the New Zealand inflation report came in much stronger than the market had been expecting. The four-hour time frame shows that the NZDUSD pair is trading inside a large broadening expanding wedge pattern. Sustained gains above the 0.7000 level could encourage bulls to test towards the top of the wedge pattern.
The NZDUSD pair is only bullish while trading above the 0.7000 level, key resistance is found at the 0.7070 and 0.7120 levels.
The NZDUSD pair is only bearish while trading below the 0.7000 level, key support is found at the 0.6970 and 0.6920 levels.
XAU/USD Outlook: Dips To Provide Better Buying Opportunities $1800 Support Expected To Hold
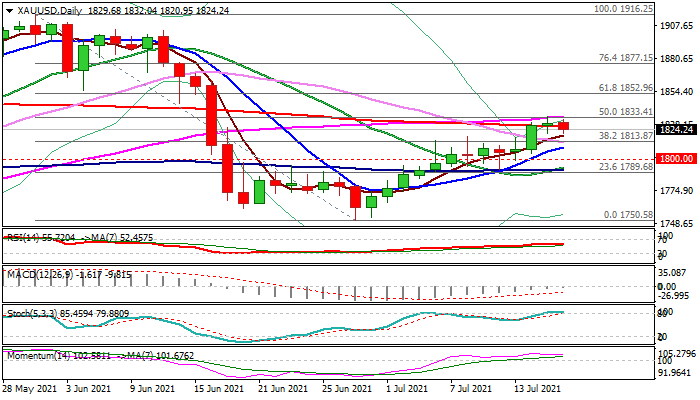
Spot gold eases on Friday morning after larger bulls broke above pivotal 200DMA ($1826) but Thursday’s Doji candle signaled indecision.
Dips are likely to provide better buying opportunities, as near-term structure is bullish, and the yellow metal remains attractive for investors as US central bank will keep its accommodative policy to support economic recovery.
Also, the view that global economy have peaked and strong post-pandemic activity is likely to take a breather, adds to positive signals for the metal.
Gold is on track for the fourth straight week of gains that supports bullish outlook, with dips to ideally find footstep at 1.1813/09 zone (broken Fibo 38.2% of $1916/$1750 / rising 10DMA) and extended downticks to stay above psychological $1800 support.
Res: 1813, 1828, 1833, 1852.
Sup: 1820, 1813, 1809, 1800.
GBP/USD Outlook: Clear Break Out Of Triangle To Provide Fresh Direction Signal
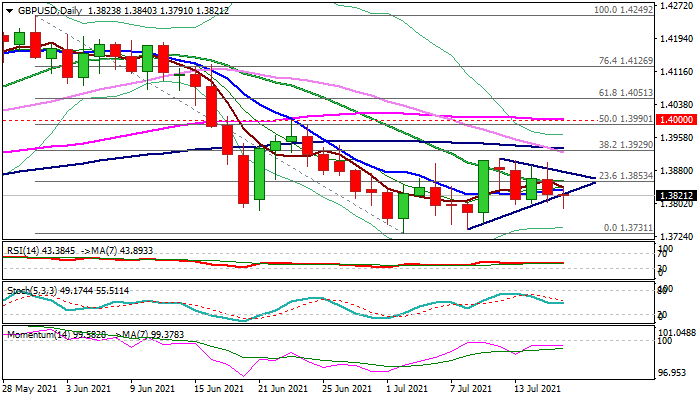
Cable probes below triangle support line in early Friday, after repeated rejections at the upper boundary of the pattern, signaled that bulls are lacking momentum, despite positive UK inflation data.
Fresh weakness is mainly driven by strength of the dollar on growing hopes that the Fed may start tightening earlier than expected.
Daily studies show fresh negative momentum and moving averages back to a bearish setup that supports a negative scenario, which requires close below the triangle, to signal an end of a corrective phase.
Conversely, the extended sideways mode could be expected on failure to break lower and return to triangle, while lift above the triangle would generate bullish signal.
Res: 1.3853; 1.3875; 1.3904; 1.3929.
Sup: 1.3791; 1.3755; 1.3731; 1.3688.
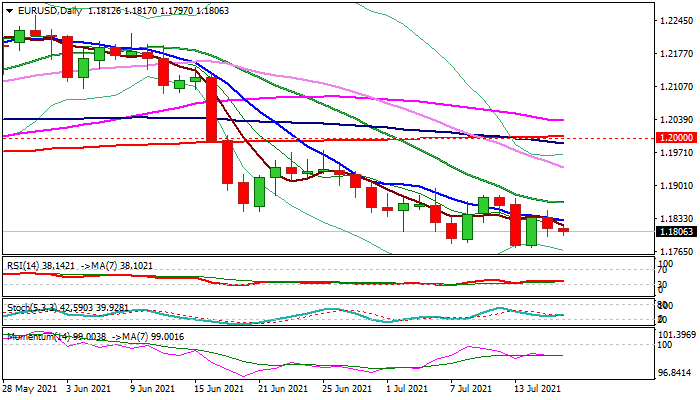
EUR/USD Outlook: Weak EU Inflation Figures Would Add To Negative Near-Term Outlook
The Euro is standing at the back foot in early European trading ahead of EU inflation data.
Thursday’s close in red after upside rejection and signal of bull-trap above falling 10DMA, weighs on near-term action, along with bearish daily techs (momentum remains deeply in the negative territory and MA’s are in bearish configuration).
Forecasts for soft June inflation figures add to a negative near-term tone, threatening of full retracement of short-recovery (1.1772/1.1850) that would keep in play risk of testing key support at 1.1704 (2021 low, posted on Mar 31).
Falling 10DMA (1.1827) marks a solid barrier, which is expected to cap and keep near-term bias with bears.
Only lift and close above 20DMA (1.1866) would sideline bears and shift focus higher.
Res: 1.1819, 1.1828, 1.1850, 1.1866.
Sup: 1.1781, 1.1772, 1.1737, 1.1704.
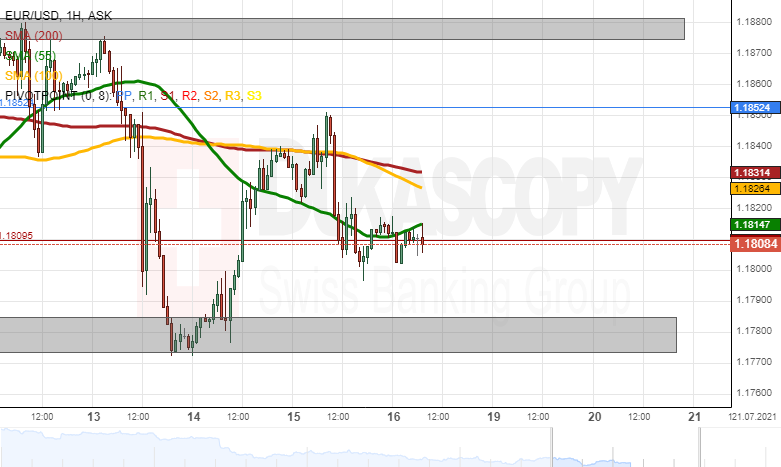
EUR/USD Analysis: Bounces Off 1.1850
The recovery of the EUR/USD failed to pass the resistance of the 1.1850 mark. It resulted in a decline, which eventually found support in the 1.1800 level. On Friday morning, the rate was trading sideways above the 1.1800 level.
In the case that the rate recovers it would face the resistance of the 55-hour simple moving average at 1.1815 first. Afterwards, the 100 and 200-hour SMAs near 1.1830 could provide resistance. Above the SMAs, the 1.1850 level could provide resistance.
On the other hand, a potential decline below the 1.1800 mark would look for support in the July low zone from 1.1773 to 1.1785.
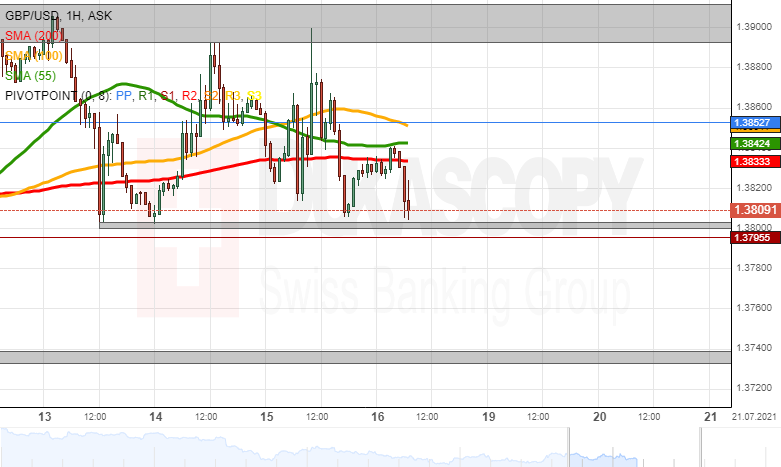
GBP/USD Analysis: Remains In Range
The GBP/USD failed to pass the resistance zone near the 1.3900 level. Namely, the rate bounced off exactly the 1.3900 mark. This was followed by a decline to the support zone of the July 13 and 14 low levels just above the 1.3800 mark.
Meanwhile, note that, by large, the rate ignores the hourly simple moving averages.
In the near term future, the rate was expected to trade between the 1.3800 and 1.3900 levels despite the high volatility range of 100 base points. Eventually, the rate would break out of this range.
A break out above the 1.3900 level would face the resistance of the 1.3950 mark and the weekly R1 simple pivot point at 1.3963. Above these levels, the 1.4000 mark would provide resistance.
On the other hand, a decline below 1.3800 would immediately test the support of the weekly S1 simple pivot point at 1.3796. Afterwards, the rate would have no support as low as the July low levels near 1.3740.
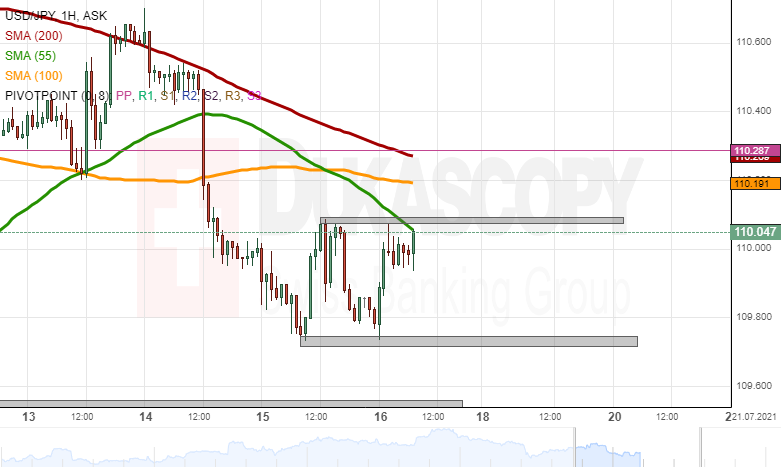
USD/JPY Analysis: Reveals Support And Resistance
The USD/JPY currency exchange rate has revealed that it is trading sideways in a 35 base point range between the 109.74 and 110.09 levels. Meanwhile, additional resistance was being provided by the 55-hour simple moving average at 110.05.
In the case that the rate passes the levels near 110.00, it would face additional resistance from the 100-hour simple moving average at 110.20. Above that, level 200-hour simple moving average and the weekly simple pivot point at 110.29 could provide resistance.
On the other hand, a decline below 109.74 could look for support in the July low level at 109.54. Below the July low level, the weekly S1 simple pivot point at 109.38 could provide additional support.
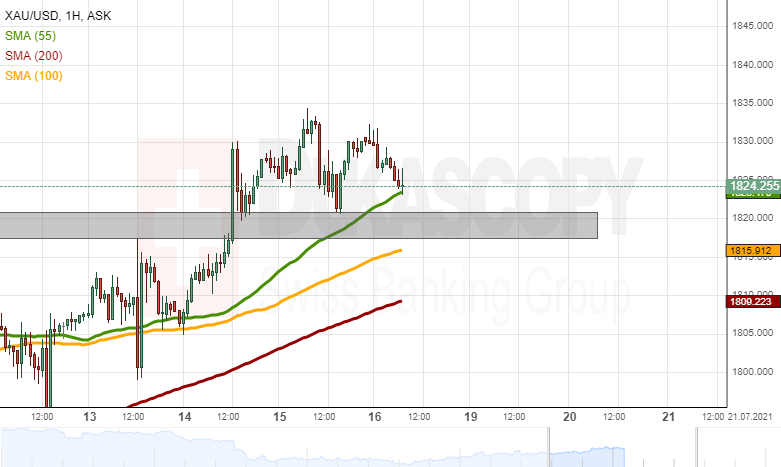
Gold Analysis: Remains Below 1,835.00
The yellow metal failed to properly reach the 1,835.00 level before starting a retracement down. The retracement ended just above the 1,820.00 level. Since the middle of Thursday's trading, the metal has traded between the mentioned price levels.
On Friday, the bullion was approached by the support of the 55-hour simple moving average near 1,824.00.
If the SMA manages to push the price up, it could pass the resistance of the 1,835.00 level and test other round price levels. On the other hand, a potential decline below the SMA would look for support in the zone near the 1,820.00 mark.
EUR/JPY Analysis: Bounces Off Support
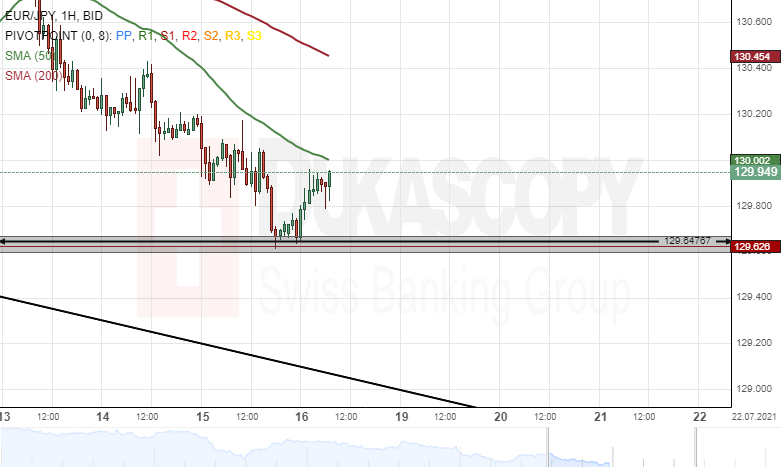
Since this week's trading sessions, the 50– hour simple moving average continued to pressure the EUR/JPY currency pair lower. The common European currency fell by 52 pips or 0.40% against the Japanese Yen on Thursday.
As for the near future, the exchange rate could continue to edge lower. Bearish traders might target the 129.40 region within the following trading session.
However, the weekly support level at 129.62 could provide support for the currency exchange rate during Friday's trading session.
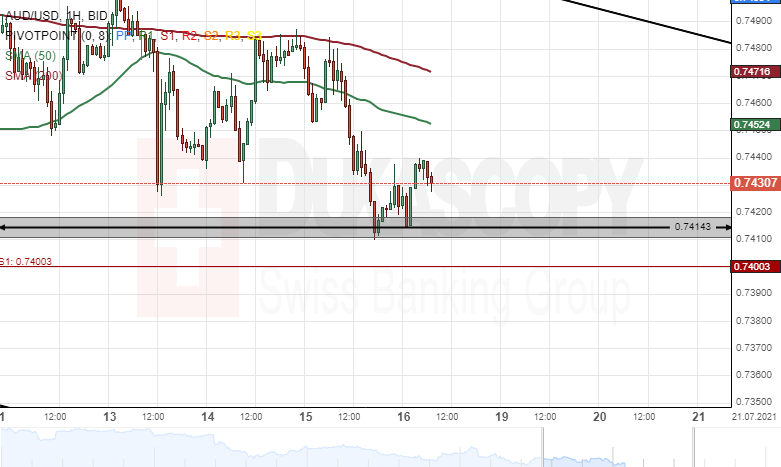
AUD/USD Analysis: Decline Could Continue
On Thursday, the 200– hour simple moving average pressured the AUD/USD currency pair lower. As a result, the Australian Dollar declined by 66 pips or 0.88% against the US Dollar.
All things being equal, the exchange rate could continue to edge lower during the following trading session. The potential target for bearish traders will be near the 0.7380 area.
However, the weekly support level at 0.7400 could provide support for the currency exchange rate within this session.